
AgilePlace process flows
Overview
This practical guide walks Agile teams through using the agile team delivery capability to deliver work effectively using Planview AgilePlace. It outlines key process steps, demo videos, and reporting insights to support each phase—from managing team backlogs and execution to integration. With a focus on aligning day-to-day activities with Agile best practices, teams can learn to streamline collaboration, track progress, and continuously deliver value.
New to Agile team delivery? Watch this video series to see how AgilePlace helps teams visualize work, stay aligned, and deliver value more efficiently using Kanban boards and Lean practices:
 |
 |
 |
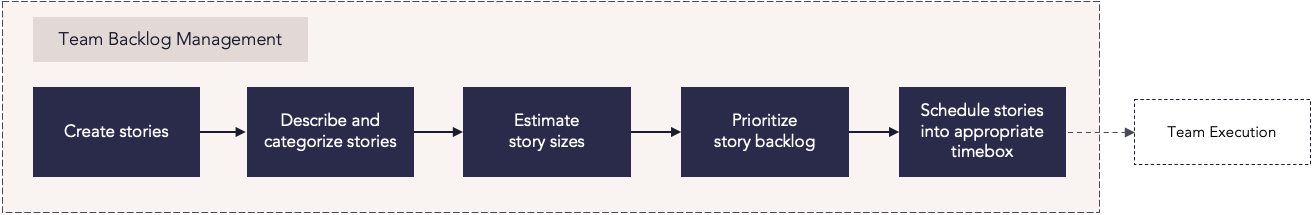
Team backlog management
Process steps
| Process step | Description |
|---|---|
| Create stories | Break features down into discrete user stories for the team to work on. |
| Describe and categorize stories | Clearly define a goal for each user story that team members can work toward. |
| Estimate story sizes | Realistically assess the scope of the work that will be required to complete each user story. |
| Prioritize story backlog |
Rank the stories in the backlog to determine which stories should be worked on first. Use metrics in Card Scoring to determine what work should be prioritized. |
| Schedule stories into appropriate timebox | Schedule story cards across timeboxes or sprints, and set work in progress (WIP) limits to avoid overloading team members with work. Use the Agile Planning Series view to visualize how planned stories and delivery dates align to higher-level planning increments, such as program increments (PIs). After planning, teams begin work toward their defined goals. |
Reports
How are we able to understand what is in the backlog and can be planned within WIP limits?
| All Planning Series Report | Analytic Report | This AgilePlace report allows you to view all the cards that have been assigned to planning increments. |
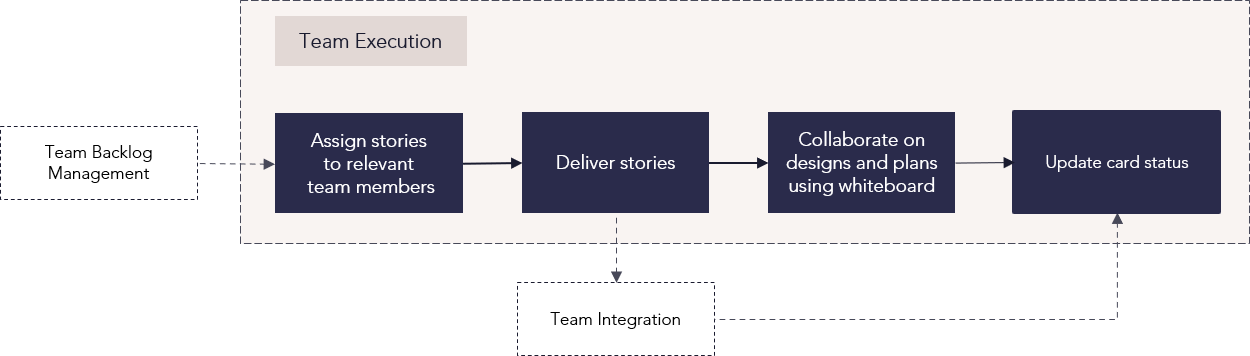
Team execution
Process steps
| Process step | Description |
|---|---|
| Assign stories to relevant team members | Spread story assignments across the available team members based on available team members' abilities, workloads, and schedules. |
| Deliver stories | Iterate on the work required to complete each user story. |
| Collaborate on designs and plans using whiteboard | The Whiteboard is a tool that you use to create designs and plans while collaborating or brainstorming, similar to an actual whiteboard. You can use elements such as shapes as you brainstorm, and if desired convert text within elements to cards on a specified board. |
| Update card status | As work is accomplished on each user story, assigned team members can update cards by moving them toward review or completion. |
Reports
How are we able to view key metrics based on team execution?
|
Analytic Report |
This burndown chart helps teams visualize progress on work that needs to be completed during a specific time period and gauge whether they’re on track to complete their planned work by the deadline. It also highlights how many cards or card sizes may be at risk of missing the deadline. This chart is helpful for team retrospectives to understand past performance and historical trends. |
|
|
Analytic Report |
This chart displays the relative amount of work in progress for each lane or section of a board over time. Variations in the width of the colored bands indicate how smoothly work is flowing, and serve as a visual indicator of potential bottlenecks or workflow constraints. Key takeaways at the top of the chart display the rate teams are adding, starting, and moving cards on the board during a specified date range. |
|
|
Analytic Report |
This report displays the amount of in-process work that was active or inactive over a given time period. You can select specific lanes to understand which areas of your board may be inefficient and determine where and how to implement lane WIP limits. |
|
|
Analytic Report |
This chart compares cards' planned finish dates to their actual finish dates to determine whether each item due on a particular date was finished early, on time, late, or remains unfinished. The ability to toggle between original and current planned finish dates to get a better understanding of how you are performing against your original plan is also supported. |
|
|
Analytic Report |
This report is used to calculate the amount of time work items take from the time they enter work in progress until they are complete. It consists of a bar chart that displays the number of cards completed in a time period, and a jitter plot that plots cycle time, or how many days it took to complete the work. |
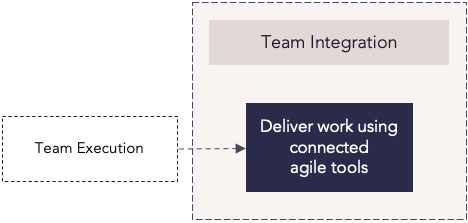
Team integration
Process steps
| Process step | Description |
|---|---|
| Deliver work using connected agile tools |
Teams use their preferred agile team tools to complete work and user stories, with status information visible in Planview AgilePlace. This is supported by Planview's agile integration capabilities which allow organizations to connect one or more agile team tools, as well as multiple federated instances of a given team tool, into Planview AgilePlace. |
Best practices
Center on continuous improvement
One of the main benefits of agile methodology is the understanding that incremental steps in the right direction will lead to vast improvement over time through an iterative, emergent process. Change can be challenging, and results won’t happen overnight—but committing to continuous improvement will pay off in the long run.
Aim for Minimum Viable Product (MVP
The first iteration isn’t meant to be perfect. Starting with an MVP helps teams gather feedback and experience quickly, setting the stage for future improvements and more impactful results over time.
Use what works
Different teams have different needs—and that’s okay. Let teams choose the methods and timeboxes that suit them best, whether it’s Scrum, Kanban, Scrumban, or something else. The goal is to empower teams to work effectively.
Integrate tools
Give your teams the tools they need to work their way—while ensuring leadership has visibility. Integrated systems, dashboards, and onboard reporting create a single source of truth that’s easy to use and understand across the organization.
Create cross-functional teams
Break down silos by forming teams based on shared goals rather than similar roles. Cross-functional teams help eliminate delays and foster collaboration around creating specific value for the organization.
Limit Work-in-Progress (WIP)
Agile isn’t about being fast—it’s about staying focused. Keep WIP limits in place to help teams concentrate on delivering small, manageable tasks without being overwhelmed.
Visualize work and blockers
Use tools like Kanban boards to make it easy to see what’s in progress, what’s blocked, and where bottlenecks are forming. Clear visualization supports faster problem-solving and better team alignment.
Measure delivery time
Track metrics like flow, throughput, and cycle time to understand how long work takes from start to finish. These insights help identify inefficiencies and support better planning and faster delivery.