
Product Portfolio and Pipeline Planning
Product Portfolio and Pipeline Planning
Product portfolio and pipeline planning supports a clearly defined process to initiate business requests, as well as collect relevant categorization and scoring information and initial financial data for products. A consistent intake process is created for new products by ensuring the appropriate gated process is applied to products, enabling accurate review and approval actions on these requests at each decision stage.
Learn more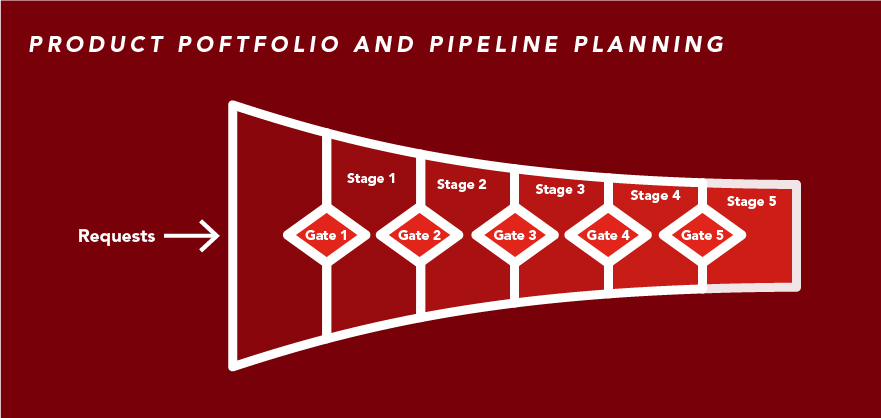
 Business Requests
 Product Planning and Pipeline Intake
 Gated Process Automation (Stage-Gate)
Capability resources
AdaptiveWork process flows
Review step-by-step guidance, process flows, and best practices for end users to achieve specific business outcomes.
Learn morePortfolios process flows
Review step-by-step guidance, process flows, and best practices for end users to achieve specific business outcomes.
Learn more