
Portfolios process flows
Overview
This practical guide walks teams through using the work management capability to plan, execute, and track projects effectively using Planview Portfolios. It outlines key process steps, best practices, and reporting insights to support each phase—from project planning and scheduling to change, risk, and issue management, and execution tracking. With a focus on aligning project work to organizational priorities and maintaining visibility into progress, teams can learn to improve delivery, manage risks, and optimize project outcomes.
New to work management? Watch these demo videos to learn how Planview helps teams build project schedules, manage milestones, track execution, and ensure work stays aligned to strategic goals:
 |
 |
Project planning and scheduling
Process steps
| Process step | Description |
|---|---|
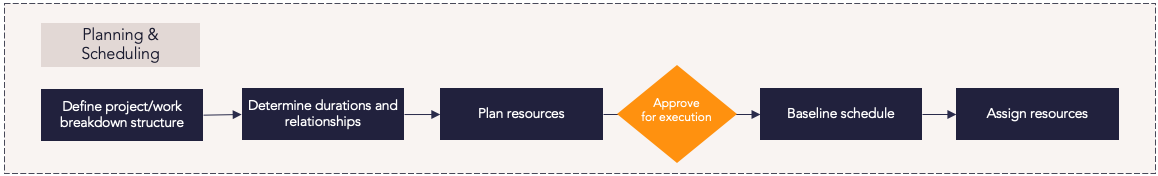
| Define project/work breakdown structure |
Define the project by building out the work breakdown structure to form the basis of the project schedule. As part of this step, you should also add dates, durations, dependencies, and assign resources to the project. The project schedule consists of any elements in the work breakdown structure (WBS) that exist below the project level in the hierarchy, such as phases, tasks, and activities as well as dates, durations, and categorizations. You can add the relevant associated resource assignment information to produce a full project delivery plan.
NOTE In the connected Portfolios-ProjectPlace use case where governed work is created in Portfolios but delivered by teams in ProjectPlace, project managers have the option to create work in Portfolios but manage the plan in ProjectPlace. When the plan is managed in ProjectPlace, ProjectPlace becomes the system of record for the plan, and the synced plan in Portfolios becomes read-only. Project managers can continue to use Portfolios to support other capabilities such as resource management, financial planning, project portfolio planning, and reporting. For more detailed information on how work is synced in a connected Portfolios-ProjectPlace environment, refer to the Project Team Delivery (ProjectPlace – Connected) capability. For Planview administrators to configure ProjectPlace to manage the plan, refer to the steps in Hybrid Delivery: Configure (coming soon).
|
| Determine durations and relationships | Determine the duration of work tasks and establish logical relationships between work items in the project schedule that you defined in the previous step. |
| Plan resources | Plan which resources will work on tasks and activities and populate the project schedule with an accurate and realistic role-based forecast in the form of resource requirements. |
| Baseline schedule | Take a baseline of the project schedule to capture a snapshot of the project's schedule as it proceeds into execution. This schedule baseline provides a record of the planned work phases, tasks, milestone dates, and durations as of the end of the planning phase to track any variances as the work progresses. |
| Assign resources | Assign resources to work on tasks and activities. Resource assignments built out in the project schedule in the form of role-based reserves and allocations provide a method of capturing the short-term planned resource effort for named individuals who will be working on projects. |
Reports
How are we able to understand when key planning events are forecast?
|
Work Portfolio – Portfolio Manager – Customizable Column Set |
Screen |
Custom column sets provide an overview of work items in a portfolio and their details, such as synced AgilePlace boards, start and finish dates, and percentage complete. |
|
Screen |
The Plan screen for a project details the work breakdown schedule (WBS) for the project with the tasks, milestones, dates, resource assignments, and related attributes to accurately track all details of the project schedule. |
|
|
Tile |
This tile is available for a single project or portfolio of projects. It shows all open milestones for the projects and highlights variances from baseline dates and late milestones. |
|
|
Tile |
This tile shows all action items for a single project or portfolio of projects. Items can be grouped and sorted by attributes as well as exported. |
|
|
Power BI Dashboard |
This dashboard summarizes work action item information for projects and their assigned resources. You can drill down into data points for further analysis. |
|
|
FastTrack Power BI Showcase Dashboards – Work Portfolio – Portfolio Status |
Power BI Dashboard |
This dashboard provides an overview of the work portfolio with overall project count and costs, along with visualizations of lifecycle stage, work status, overall status assessment, projects over or under budget, and projects on time or late. It also includes a table of project details that can be sliced by data from the visualizations, such as lifecycle stage or overall status. |
| FastTrack Power BI Showcase Dashboards – Work Portfolio – Milestone Details |
Power BI Dashboard |
This dashboard provides insight into the overall health of a work portfolio and its KPIs, and includes a high-level status and timeline view along with cost and investment visualizations. Work portfolio milestone metrics can be categorized by type, identifier, and due date, and displayed in a Gantt chart or detailed table view. |
How are we able to understand the impact of resource constraints on our ability to deliver?
|
Screen |
Using the Gantt and Baseline view in the Schedule and Assignments screen allows you to compare how the current schedule and milestone dates vary from the selected baseline, and adjust as appropriate. |
|
|
Tile |
This tile is available for a single project or portfolio of projects and displays an overview of allocations that exceed the selected utilization percentage. The sort parameter and utilization percentage determine which allocations are displayed in the table. |
|
|
Analytic |
This report displays the capacity and utilization of resources assigned to a portfolio or project. Demand is based on requirements, reserves, and allocations in project schedules, and data can be pivoted by different resource dimensions. Out-of-portfolio demand (assignments to work and standard activities not included in the portfolio or project) can also be displayed. This report allows you to identify over- and under-utilized teams or resources and better predict project delivery dates based on the alignment of supply to demand. |
|
|
Screen |
This screen provides a graphic view of planned versus actual effort. Standard activities decrement from capacity then allocations, reserves, and actuals. Here you can filter by entity type to view unfilled resource requirements, and use the 'Group by' attribute to view resource teams. |
|
|
Analytic |
This analytic provides an organizational view of resource capacity versus demand. Demand is based on requirements, reserves, and allocations in project schedules, and data can be pivoted by different resource dimensions. This analytic allows you to identify teams or resources that are under- or over-utilized, and improve project delivery estimations based on available capacity. |
How are we able to understand when work and key events vary from the agreed timeline?
|
Work Portfolio – Portfolio Manager – Customizable Column Set |
Screen |
Custom column sets provide an overview of work items in a portfolio and their details, such as synced AgilePlace boards, start and finish dates, and percentage complete. |
| Plan – Schedule and Assignments – Gantt and Baseline View |
Screen |
Using the Baseline and Gantt view in the Schedule and Assignments screen allows you to compare how the current schedule and milestone dates are varying from the selected baseline, and adjust as appropriate. |
|
Analytic |
This report summarizes key project information into a one-page report for stakeholders and project review meetings. The report includes the following:
You can run the report for a single project or across the portfolio. The portfolio report includes an executive summary on the first page, followed by one-page summaries for each project on individual pages. |
|
|
FastTrack Power BI Showcase Dashboards – Work Portfolio – Portfolio Status |
Power BI Dashboard |
This dashboard provides an overview of the work portfolio with overall project count and costs, along with visualizations of lifecycle stage, work status, overall status assessment, projects over or under budget, and projects on time or late. It also includes a table of project details that can be sliced by data from the visualizations, such as lifecycle stage or overall status. |
|
FastTrack Power BI Showcase Dashboards – Work Portfolio – Milestone Details |
Power BI Dashboard |
This dashboard provides insight into the overall health of a work portfolio and its KPIs, and includes a high-level status and timeline view along with cost and investment visualizations. Work portfolio milestone metrics can be categorized by type, identifier, and due date, and displayed in a Gantt chart or detailed table view. |
How are we able to understand the impact of collaborative work?
|
Power BI Dashboard |
This dashboard summarizes work action item information for projects and their assigned resources. |
|
| Work – Plan – Schedule and Backlog Pivot View |
Screen |
The Schedule and Backlog Pivot view in the Plan screen enables you to schedule action items from your backlog and build the project work plan. The work schedule display outlines your project’s work breakdown structure and details action items in select projects. The backlog display lists unassigned action items, which can be created in this display or in the Backlog Pivot view. |
| Action Items | Tile | This tile shows all action items for a single project or portfolio of projects. Items can be grouped and sorted by attributes as well as exported. |
Change, risk, and issue management
Process steps
| Process step | Description |
|---|---|
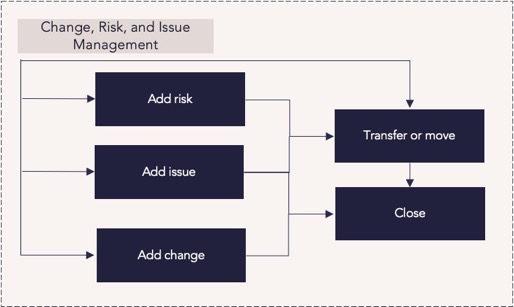
| Add risk |
Record the risks associated with the delivery of the work, including additional details to describe and categorize the risks. Risks identify and track things that may happen, including their impact and likelihood. Risks require a response or mitigation plan to address them. For more information: |
| Add issue |
Record the issues associated with the delivery of the work, including additional details to describe and categorize the issues. Issues identify and track things that are happening now that require an owner to take action. For more information: |
| Add change |
Record the changes associated with the delivery of the work, including additional details to describe and categorize the changes. Changes are alterations to a project's scope or expected deliverables. Changes can be a result of addressing a risk or an issue or the result of changing needs from the customer or management. For more information: |
| Transfer or move |
Modify the subtype of a change, risk, or issue (CRI) from one type to another (for example, from a change to a risk) or move a CRI from one project or work item to another as needed. |
| Close |
Close changes, risks, and issues when appropriate in a timely manner to help maintain a current overview of the factors affecting a project's progress. Use the following guidelines to close CRIs: Risks – when they are no longer determined to be risks and have not been escalated or otherwise changed. Issues – when they have been resolved or mitigated. Changes – when all associated actions are finished. |
Reports
How are we able to understand the impact of risks, issues, and project change requests on the successful delivery of work?
|
Work Portfolio – Portfolio Manager – Customizable Column Set |
Screen |
Custom column sets provide an overview of work items in a portfolio and their details, such as synced AgilePlace boards, start and finish dates, and percentage complete. |
|
Tile |
This tile shows you active risks for entities in the work portfolio. |
|
|
Tile |
This tile shows you active issues for entities in the work portfolio. |
|
|
Tile |
This tile shows you active change requests for entities in the work portfolio. |
|
|
Analytic |
This report summarizes change requests for a portfolio of projects. This matrix is used to classify change requests by two parameterized attributes and is drillable, allowing you to slice the list of change requests. |
|
|
Analytic |
This report provides a risk registry summary for a portfolio of projects. This matrix is used to classify risks by two parameterized attributes and is drillable, allowing you to slice the list of risks. |
|
|
Analytic |
This report provides an issue log summary for a portfolio of projects. This matrix is used to classify issues by two parameterized attributes and is drillable, allowing you to slice the list of issues. |
|
| Analytic |
This report summarizes key project information into a one-page report for stakeholders and project review meetings.
You can run the report for a single project or across the portfolio. The portfolio report includes an executive summary on the first page, followed by one-page summaries for each project on individual pages. |
|
|
FastTrack Power BI Showcase Dashboards – Work Portfolio – Issue Tracker and Risk Matrix Tabs |
Power BI Dashboard |
These dashboards provide an overview of risks and issues within the portfolio, including the total count and number open, along with visualizations relating to the status and impact of the risks and issues. It also includes a table with projects associated to the risks and issues, allowing you to drill down into the project details. |
How are we able to understand the impact of project changes to approved delivery or financial targets?
|
Analytic |
This report summarizes key project information into a one-page report for stakeholders and project review meetings.
You can run the report for a single project or across the portfolio. The portfolio report includes an executive summary on the first page, followed by one-page summaries for each project on individual pages. |
|
|
Analytic |
This report summarizes change requests for a portfolio of projects. This matrix is used to classify change requests by two parameterized attributes and is drillable, allowing you to slice the list of change requests. |
|
|
Power BI Dashboard |
This report provides analysis of the volume and type of change requests for a portfolio of projects, including the rate they are opened and closed. |
|
|
Tile |
This tile shows you active change requests for entities in the work portfolio. |
|
|
FastTrack Power BI Showcase Dashboards – Work – Financial Summary |
Power BI Dashboard |
This dashboard allows you to compare strategic investments over time. You can view the total costs of a select portfolio over a given timeframe, view the breakdown of those costs by the strategic program, and identify portfolios that are meeting or exceeding approved budgets. Data for investment demand entities can be viewed and managed, allowing you to change their approval status, priority, and above or below-the-line status. |
|
FastTrack Power BI Showcase Dashboards – Work Portfolio – Financial Summary |
Power BI Dashboard |
This dashboard gives an overview of costs and benefits of the work portfolio, including baseline, actual/forecast, and variance data. It also contains visualizations of cost and benefits that can be sliced by data such as capital, expense, labor, cost savings, and investment benefits. |
Execution and tracking
Process steps
![]()
| Process step | Description |
|---|---|
| Do work |
Resources carry out the work that has been assigned to them. |
| Capture data on the progress of work |
As work progresses, resources' actual time spent on work is tracked, project managers update milestones and other dates as needed, and the Progressing Engine integrates actual time reported records with all the planning records in the database. Resources' time can be captured in the following ways:
|
| Review progress of work |
Track and monitor the progress being made on work using tools such as baselines to compare the current status with the planned progress. For example, project managers can monitor the scheduled and actual dates and track the variance against initial expectations, such as an initial baseline, to obtain a full understanding of the project progress. Then, they can take a new baseline to compare against a baseline taken at the start of the project. This helps project managers have a clear understanding of how a project is progressing in relation to the original baseline and identify where dates have slipped or been brought forward. Any variance from the original project baseline may have financial implications or require the proactive reassignment of resources in order to prevent any negative impact on the project. |
| Plan/re-plan remaining scheduled work | Manage the schedule for the remaining scheduled work, adjusting dates and durations if necessary. |
| Manage exceptions and report on project status and progress |
Ensure the project status and work details are correct and current, evaluating and re-prioritizing any items that aren't going to plan. Project managers can review or update the status of work on the Plan screen. Also, project stakeholders can view a summary of work status information on the WRK14 – Project (and Portfolio) Highlight Report, which is a FastTrack analytic. |
Reports
How are we able to understand the impact of time reported against remaining forecast?
|
Work Portfolio – Portfolio Manager – Customizable Column Set |
Screen |
Custom column sets provide an overview of work items in a portfolio and their details, such as synced AgilePlace boards, start and finish dates, and percentage complete. |
|
Analytic |
This report summarizes key project information into a one-page report for stakeholders and project review meetings.
You can run the report for a single project or across the portfolio. The portfolio report includes an executive summary on the first page, followed by one-page summaries for each project on individual pages. |
|
|
WRK28 – Portfolio/Project Scheduled vs. Actual Effort Analysis |
Analytic |
This report visualizes planned effort vs. actual or reported effort. It provides the resource activity, weekly-level details of the hours planned for each activity, and the hours reported. |
|
FastTrack Power BI Showcase Dashboards – Work Portfolio – Financial Summary |
Power BI Dashboard |
This dashboard gives an overview of costs and benefits of the work portfolio, including baseline, actual/forecast, and variance data. It also contains visualizations of cost and benefits that can be sliced by data such as capital, expense, labor, cost savings, and investment benefits. |
How are we able to view the status commentary and variance measures of work being delivered?
|
Work Portfolio – Portfolio Manager – Customizable Column Set |
Screen |
Custom column sets provide an overview of work items in a portfolio and their details, such as synced AgilePlace boards, start and finish dates, and percentage complete. |
| Work View – Project Status Summary | Screen |
This screen is used to enter the status assessments of a project with RYG or RAG statuses and summary descriptions for the defined assessment areas. Details here are also used in the WRK14 Project Highlight Report. |
| Red and Yellow Projects |
Tile |
This work portfolio tile shows all projects that are reporting an overall status of red and yellow or amber from the Project Status Summary screen. |
|
Analytic |
This report summarizes key project information into a one-page report for stakeholders and project review meetings.
You can run the report for a single project or across the portfolio. The portfolio report includes an executive summary on the first page, followed by one-page summaries for each project on individual pages. |
|
|
FastTrack Power BI Showcase Dashboards – Work Portfolio – Portfolio Status |
Power BI Dashboard |
This dashboard provides an overview of the work portfolio with overall project count and costs, along with visualizations of lifecycle stage, work status, overall status assessment, projects over or under budget, and projects on time or late. It also includes a table of project details that can be sliced by data from the visualizations, such as lifecycle stage or overall status. |
How are we able to view the progress of work and upcoming key events?
|
Tile |
Selecting the Gantt view within the Portfolio Manager tile will create a visual representation of the baseline and current schedule for all projects in the portfolio. | |
| Plan – Schedule and Assignments – Gantt and Baseline View |
Screen |
Using the Baseline and Gantt view in the Schedule and Assignments screen allows you to compare how the current schedule and milestone dates are varying from the selected baseline, and adjust as appropriate. |
|
Tile |
This tile is available for a single project or portfolio of projects. It shows all open milestones for the projects and highlights variances from baseline dates and late milestones. |
|
|
Power BI Dashboard |
This dashboard displays a range of out-of-the-box Power BI visualizations for the Financial Summary, Portfolio Balance Count, and Portfolio Balance Cost dashboards. Detailed information for each visualization is provided, highlighting the configuration steps required to recreate the visualization. |
|
|
Analytic |
This report monitors and provides insight into date changes on milestones in project schedules. This project portfolio-based report drives on-time project delivery and is based on snapshots taken by the Progression Engine. |
|
|
FastTrack Power BI Showcase Dashboards – Work Portfolio – Portfolio Status |
Power BI Dashboard |
This dashboard provides an overview of the work portfolio with overall project count and costs, along with visualizations of lifecycle stage, work status, overall status assessment, projects over or under budget, and projects on time or late. It also includes a table of project details that can be sliced by data from the visualizations, such as lifecycle stage or overall status. |
|
FastTrack Power BI Showcase Dashboards – Work Portfolio – Milestone Details |
Power BI Dashboard |
This dashboard provides insight into the overall health of a work portfolio and its KPIs, and includes a high-level status and timeline view along with cost and investment visualizations. Work portfolio milestone metrics can be categorized by type, identifier, and due date, and displayed in a Gantt chart or detailed table view. |
How are we able to understand when work is under- or overperforming against time and financial targets?
|
Work Portfolio – Portfolio Manager – Financial Variance Column Set |
Screen |
The Work Portfolio – Portfolio Manager – Financial Variance Column Set gives you an overview of the work items in a portfolio. This allows you to see negative and positive variances in costs and effort, along with access to the details of each work item. |
|
Analytic |
This report summarizes key project information into a one-page report for stakeholders and project review meetings.
You can run the report for a single project or across the portfolio. The portfolio report includes an executive summary on the first page, followed by one-page summaries for each project on individual pages. |
|
|
WRK32 – Project/Work Portfolio Financial Burndown Comparison |
Analytic |
This report compares versions of project and work portfolio financial plan data, with effort represented as FTEs, days, and hours, and financials as cost, benefits, and revenue. The report includes the following:
|
|
FastTrack Power BI Showcase Dashboards – Work – Projects Over and Under Budget |
Power BI Dashboard |
This dashboard allows for a side-by-side comparison of projects that are over or under budget, their total and baseline cost, and the time horizon. The report also includes a table that can be used to see individual project information such as status assessment, project manager, cost variance, and more. |
|
FastTrack Power BI Showcase Dashboards – Work Portfolio – Portfolio Status |
Power BI Dashboard |
This dashboard provides an overview of the work portfolio with overall project count and costs, along with visualizations of lifecycle stage, work status, overall status assessment, projects over or under budget, and projects on time or late. It also includes a table of project details that can be sliced by data from the visualizations, such as lifecycle stage or overall status. |
| FastTrack Power BI Showcase Dashboards – Work Portfolio – Financial Summary | Power BI Dashboard | This dashboard gives an overview of costs and benefits of the work portfolio, including baseline, actual/forecast, and variance data. It also contains visualizations of cost and benefits that can be sliced by data such as capital, expense, labor, cost savings, and investment benefits. |
Best practices
Standardize processes
Standardize the process for defining work and associated timelines, milestones, and activities. Create a formal and standard process for creating and closing a new Change, Risk, or Issue (CRI) to provide transparency into how work is defined and CRIs are received.
Ruthlessly prioritize
To produce successful results, work managers must proactively prioritize. Throughout the process of creating timelines, milestones, and activities, it’s critical to remain aligned to organizational priorities and not lose sight of the overall goal while using the detailed frame of reference needed to plan work.
Centralize information
Centralize project information to monitor work progress and health, coordinate execution, and ensure timely delivery aligned to strategic objectives. Provide a single source of truth for all project details to enable visibility into dependencies, risks, and shared commitments.
Track everything
Provide access to relevant, accurate, and timely data, ideally in one easy-to-understand report or dashboard. Use visual tools that compare performance to financial and schedule baselines that enable upward and downward transparency for alignment throughout the organizational hierarchy. Actively work with stakeholders to capture KPIs that can quickly identify the need to pivot, adjust funding or capacity, or pull back.
Manage stakeholders
Understand what your stakeholders need to know about the project and provide accurate and timely updates to stakeholders. Keep a clear, open line of communication with all stakeholders and keep all internal communication within a centralized location to minimize confusion.
Empower teams
PMO leaders should empower teams to deliver in a manner that supports the methods and approaches that best suit the team—whether waterfall, agile project execution, or a mixed hybrid approach. Execution today is a mix of technologies and hybrid methodologies that when aligned, provide a single line of sight that ensures strategic delivery.
Manage complexity
Follow these Work Breakdown Structure (WBS) rules to simplify risk identification, improve planning and accountability, implement smarter budget and resource allocation, and enhance visibility. Following these guidelines helps ensure no duplicate work will take place—and facilitates the management of challenges project managers face.
Avoid scope creep
Scope creep occurs when a project’s requirements or tasks change so much that it puts the project at risk for not finishing on time or within budget. Make sure you’re adhering to the boundaries laid out in the scope statement once you’re in the execution phase, and that stakeholders know the implications of making any changes.