
Portfolios process flows
Overview
Resource management allows you to optimize your strategic objectives by ensuring your resources are working on the right projects at the right time. By providing a single repository of resource availability information to your organization, resource managers can track and manage assignments of named resources, forecast future demand, perform what-if capacity and demand scenario planning, and collect time reporting information to measure actual project hours and costs.
New to resource management? Watch these demo videos for a quick overview:
 |
 |
Resource availability
Process steps

| Process step |
Description |
|---|---|
|
Manage resource availability (non-project work, planned absences) |
Capture resource commitments to standard activities (overhead, non-project activities such as company meetings, and other planned absences such as paid time off) to accurately record and understand resource availability for work, then compare and balance the availability against the resources' current allocations to determine current resource utilization. Resources should maintain records of their upcoming non-project activities (standard activities) to give resource managers an accurate picture of how much capacity each resource has for planned work. It’s important for budgeting and planning purposes to know how much time is spent in utilized standard activities like meetings and training, and how much is spent in non-utilized standard activities like vacation or sick days. Note that resource managers can also update standard activities for other resources if necessary. |
Reports
Resource assignments and utilization
Process steps
| Process step | Description |
|---|---|
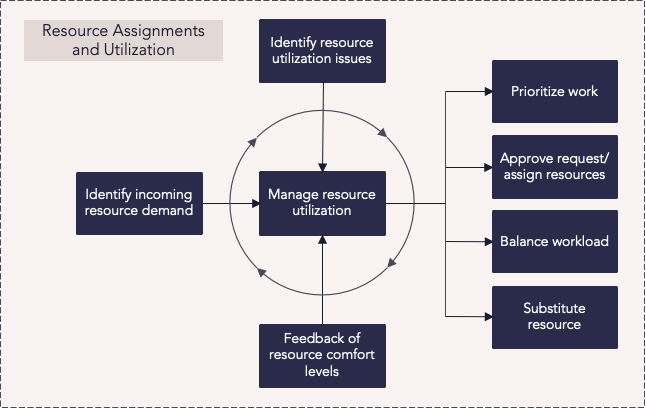
| Identify incoming resource demand |
Identify and quantify all incoming demand placed against all resource types in teams to maintain a balanced and efficient level of utilization among resources. To quantify resource demand, project managers use requirements to request resource effort that is needed to complete a project. |
| Identify resource utilization issues | Identify over- or underutilized resources. Once these are identified, take mitigating actions to ensure the delivery of projects and effective use of organizational resources is maintained. |
| Feedback of resource comfort levels | Obtain feedback from resources to determine how each individual feels about their current workload; this can help determine whether resources are over- or underutilized. |
| Manage resource utilization |
Quantify and balance resource utilization in the context of effort and budget capacity to determine the ability of the organization to deliver work. Ensure the workload for resources remains balanced, neither over- or underutilized. Using techniques such as eliminating resource overload, a resource manager can balance a project's resource demand against resource capacity to make informed decisions about resource utilization. This ensures an accurate view into the organization's ability to deliver work and manage resource effort and costs efficiently. Resource managers can also balance resource utilization and manage resource assignments from the Resource Staffing screen. |
| Prioritize work |
Project managers and resource managers should maintain a two-way dialog throughout the execution, prioritizing work items to ensure resources can be assigned to the higher-priority items. Managers can also use values from attributes that indicate the priority ranking, internal priority, or requestor priority to help adjust the ranking of planned work items. |
| Approve request/assign resources |
Identify and manage incoming resource requests and approve accordingly. |
| Balance workload |
Take actions to maintain a balanced workload; it may be appropriate to delay some of the work to a more suitable time or to increase resource capacity. |
| Substitute resource |
Manage critically over- and underutilized resources by making resource substitutions, allowing resource managers to maintain the resource commitment effort required to deliver the work. Changes from the planned resource utilization, such as unexpected leave or the slippage of project activities, could leave resources critically over-utilized and should be managed so resources can complete the work. |
Reports
How are we able to view resource demand for project and non-project work?
| Staffing Resource Portfolio Screen | Screen |
This screen provides a graphic view of planned versus actual effort. Standard activities decrement from capacity then allocations, reserves, and actuals. Here you can filter by 'Entity Type' to view unfilled resource requirements, and use the 'Group by' attribute to view resource teams. |
| RES03 – Resource Portfolio Supply and Demand | Analytic |
This analytic provides an organizational view of resource capacity versus demand. Demand is based on requirements, reserves, and allocations in project schedules, and data can be pivoted by different resource dimensions. This analytic allows you to identify teams or resources that are under- or over-utilized, and improve project delivery estimations based on available capacity. |
| RES24 – Resource Scheduled Effort Detail | Analytic |
This report provides a resource portfolio summary that details all scheduled or planned effort for each resource in the portfolio. |
| FastTrack Power BI Showcase Dashboards – Resources | Power BI Dashboard |
This interactive Power BI dashboard uses data from resource portfolio column sets to showcase a range of out-of-the-box Power BI visualizations. Resource-related data is presented in an engaging and meaningful way that aids detailed analysis through drill-down functionality. |
|
FastTrack Power BI Showcase Dashboards – Resource Management – Activity Analysis |
Power BI Dashboard |
This dashboard displays visualizations of resource demand by work attributes such as work type or project status, as well as utilization status by standard activities. The dashboard also presents a utilization table by project and resource, allowing for detailed analysis with drill-down functionality. |
How are we able to view the overall utilization of resource teams?
| Staffing Resource Portfolio Screen | Screen |
This screen provides a graphic view of planned versus actual effort. Standard activities decrement from capacity then allocations, reserves, and actuals. Here you can filter by 'Entity Type' to view unfilled resource requirements, and use the 'Group by' attribute to view resource teams. |
| RES06 - Resource Management Health | Analytic |
This resource portfolio-based report provides an organizational view of resource utilization based on different resource assignment types. This report supports healthy resource management processes, such as optimizing the utilization of resources to have a forward-looking utilization of 80-120%. |
| RES24 – Resource Scheduled Effort Detail | Analytic |
This report provides a resource portfolio summary that details all scheduled or planned effort for each resource in the portfolio. |
| FastTrack Power BI Showcase Dashboards – Resources | Power BI Dashboard |
This interactive Power BI dashboard uses data from resource portfolio column sets to showcase a range of out-of-the-box Power BI visualizations. Resource-related data is presented in an engaging and meaningful way that aids detailed analysis through drill-down functionality. |
|
FastTrack Power BI Showcase Dashboards – Resource Management – Demand and Capacity |
Power BI Dashboard |
This dashboard provides insight into the overall demand and capacity at an organizational level, including visualizations of overall resource utilization, demand versus capacity, and roles with the highest and lowest utilization. Visualizations can be viewed in units of Hours, Days, or FTE, and can be filtered by portfolio, resource hierarchy, team, location, period, and more. |
|
FastTrack Power BI Showcase Dashboards – Resource Management – Resource Analysis |
Power BI Dashboard |
This dashboard includes visualizations that help analyze resource distribution and utilization for specific resources, including breakdowns by activity type, resource hierarchy, and location. The dashboard also presents utilization information for specific resources and allows for detailed analysis through drill-down functionality. |
How are we able to understand which resources are available to assign work?
| Staffing Resource Portfolio Screen | Screen |
This screen provides a graphic view of planned versus actual effort. Standard activities decrement from capacity then allocations, reserves, and actuals. Here you can filter by 'Entity Type' to view unfilled resource requirements, and use the 'Group by' attribute to view resource teams. |
| RES03 – Resource Portfolio Supply and Demand | Analytic |
This analytic provides an organizational view of resource capacity versus demand. Demand is based on requirements, reserves, and allocations in project schedules, and data can be pivoted by different resource dimensions. This analytic allows you to identify teams or resources that are under- or over-utilized, and improve project delivery estimations based on available capacity. |
| RES24 – Resource Scheduled Effort Detail | Analytic |
This report provides a resource portfolio summary that details all scheduled or planned effort for each resource in the portfolio. |
|
FastTrack Power BI Showcase Dashboards – Resource Management – Resource Utilization |
Power BI Dashboard |
This dashboard provides a utilization table can be viewed by month, project, or work item, allowing for a visualization of which resources are over-utilized and underutilized. |
|
FastTrack Power BI Showcase Dashboards – Resource Management – Resource Analysis |
Power BI Dashboard |
This dashboard includes visualizations that help analyze resource distribution and utilization for specific resources, including breakdowns by activity type, resource hierarchy, and location. The dashboard also presents utilization information for specific resources and allows for detailed analysis through drill-down functionality. |
| Free Capacity | Tile |
This tile supports the identification and management of underutilized and overloaded resources. |
How are we able to understand when resources are under or overallocated?
| Staffing Resource Portfolio Screen | Screen |
This screen provides a graphic view of planned versus actual effort. Standard activities decrement from capacity then allocations, reserves, and actuals. Here you can filter by 'Entity Type' to view unfilled resource requirements, and use the 'Group by' attribute to view resource teams. |
| RES03 – Resource Portfolio Supply and Demand | Analytic |
This analytic provides an organizational view of resource capacity versus demand. Demand is based on requirements, reserves, and allocations in project schedules, and data can be pivoted by different resource dimensions. This analytic allows you to identify teams or resources that are under- or over-utilized, and improve project delivery estimations based on available capacity. |
|
FastTrack Power BI Showcase Dashboards – Resource Management – Resource Utilization |
Power BI Dashboard |
This dashboard provides a utilization table can be viewed by month, project, or work item, allowing for a visualization of which resources are over-utilized and underutilized. |
| Overloaded Resources | Tile | This tile supports the identification of resources with utilization that exceeds their capacity. |
| Free Capacity | Tile |
This tile supports the identification and management of underutilized and overloaded resources. |
Time and expense management
Process steps
| Process step | Description |
|---|---|
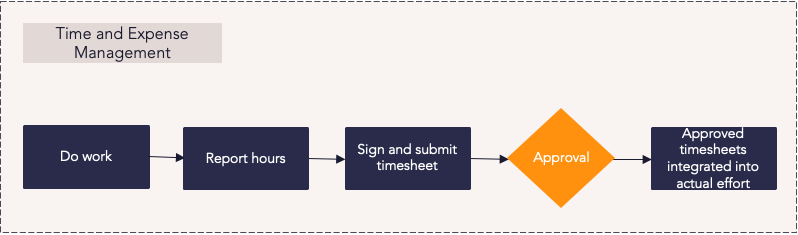
| Do work |
Resources carry out the work that has been assigned to them. |
| Report hours | The resources doing the work use timesheets to record when work was done and how many hours of effort were expended. |
|
Submit timesheet |
Resources sign and submit their timesheet once they report the time they spent on their work tasks. Once the timesheet is submitted, it is automatically sent to the appropriate resource for approval. |
|
Approved timesheets integrated into actual effort |
Once submitted and approved, timesheet hours (effort), actual start and finish dates, and percent complete are integrated into the project schedule when the weekly Progressing Engine runs. The Progressing Engine processes inputs for projects to determine actual progress and calculates the amount of remaining work and when it can be completed. The Progressing Engine is a scheduled process that generally runs weekly that applies actual progress to the project schedule and moves unfinished work forward in the schedule (since it cannot be completed in the past). For more information about the Progressing Engine, see the Using the Progressing Engine guide. |
Reports
How are we able to view the time reported to planned project work, other planned work, and non-planned work or absences?
| RES24 – Resource Scheduled Effort Detail | Analytic |
This report provides a resource portfolio summary that details all scheduled or planned effort for each resource in the portfolio. |
| RES25 – Resource Timesheet Monthly Summary | Analytic |
This report summarizes all timesheet hours for each resource in a portfolio, allowing you to see where project actual hours are being reported. |
| RES26 – Resource Weekly Timesheet Detail | Analytic |
This detailed timesheet report summarizes reported hours and timesheet comments to help you understand where project actual hours are being reported. This report is also used to validate contractor timesheets. |
| RES28 – Scheduled vs. Actual Effort Analysis | Analytic |
This resource portfolio-based report visualizes planned or scheduled effort vs. actual or reported effort to help identify overloaded resources and gauge the quality of planned work. |
How are we able to understand actual cost based on reported time and calculated rates?
| RES24 – Resource Scheduled Effort Detail | Analytic |
This report provides a resource portfolio summary that details all scheduled or planned effort for each resource in the portfolio. |
| RES25 – Timesheet Monthly | Analytic |
This report summarizes all timesheet hours for each resource in a portfolio, allowing you to see where project actual hours are being reported. |
| RES26 – Resource Weekly Timesheet Detail | Analytic |
This detailed timesheet report summarizes reported hours and timesheet comments to help you understand where project actual hours are being reported. This report is also used to validate contractor timesheets. |
| RES30 – Time Recharge Report Monthly | Analytic |
This resource portfolio analytic is used to extract timesheet effort and cost information for use in a robust time recharging process that accounts for new, late, and adjusted timesheets. |
How are we able to monitor timesheet status, submission, and approvals against our organizational targets?
| RES08 – Timesheet Compliance | Analytic |
This resource portfolio-based report provides an organizational view of timesheet compliance to timesheet submission and approval deadlines. |
| Tile |
This tile displays timesheets for resources that have been submitted and are ready for approval. |
|
| Timesheets Requiring Attention | Tile |
This tile lists resources that have timesheets ready for approval, disapproved timesheets, and overdue timesheets. |
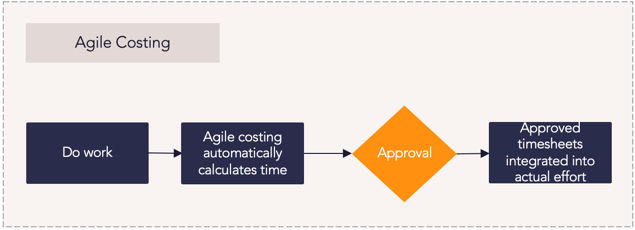
Agile costing
Process steps
| Process Step |
Description |
|---|---|
|
Do work |
Resources carry out the work that has been assigned to them. |
|
Agile costing automatically calculates time |
When an organization has Agile costing enabled, agile team members use cards on Kanban boards in Planview AgilePlace to track their own work as they normally would for those work items. The connector then uses the position of those cards and how recently each card was modified to create timesheet entries in Planview Portfolios. Managers can then use the data from the Planview Portfolios timesheets as if each team member had manually filled out a timesheet themselves. |
|
Approved timesheets integrated into actual effort |
Once submitted and approved, timesheet hours (effort), actual start and finish dates, and percent complete are integrated into the project schedule when the weekly Progressing Engine runs. The Progressing Engine processes inputs for projects to determine actual progress and calculates the amount of remaining work and when it can be completed. The Progressing Engine is a scheduled process that generally runs weekly that applies actual progress to the project schedule and moves unfinished work forward in the schedule (since it cannot be completed in the past). For more information about the Progressing Engine, see Understanding the Progressing Engine. |
Best practices
Monitor alignment to strategic goals
Use reporting tools to track resource assignments against high-priority projects and ensure continuous alignment with strategic objectives. Reliable, up-to-date data is critical for maintaining focus and driving successful outcomes.
Plan using different assignment types
Use hard bookings for short-term plans when details are known. Use soft bookings for medium-term planning and prioritization. Assign unnamed, role-based resources for long-term forecasting when specific resource details are not yet available.
Model what-if scenarios
Leverage what-if modeling to optimize resource assignments at both strategic and tactical levels. Test different scenarios for unplanned work, forward-looking resource planning, and portfolio changes without impacting live data.
Account for non-project time
Incorporate administrative time, paid time off, and other non-project work into resource planning. Capture time spent on unplanned activities to maintain accurate visibility into real resource capacity.
Implement time reporting
Use time tracking to gain visibility into where resources are spending effort. This enables better allocation decisions, improves forecasting accuracy, and helps evaluate the ROI of project work versus maintenance activities.
Ensure resources have the right skillsets
Compare required project skillsets to existing team capabilities. Dedicate teams with the highest-demand skills to critical work rather than splitting resources across projects, ensuring stronger execution and delivery.
Define a staffing process to ensure productivity
Establish a structured staffing process: plan for unexpected changes, resolve conflicts by strategic priority, avoid multitasking across too many projects, choose a direct or managed staffing approach, and maintain resource satisfaction through balanced workloads and development opportunities.