
Viz process flows
Overview
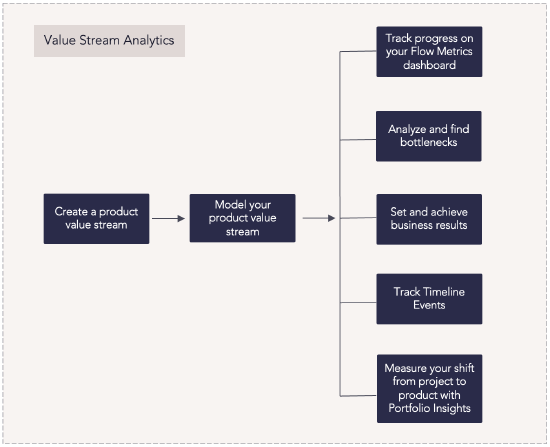
The value stream analytics capability enables organizations to measure and manage the performance of their product value streams using Planview Viz. By generating Flow Metrics and analyzing value stream data, CIOs, transformation leaders, and product and engineering executives can uncover bottlenecks, address dependencies, and improve software delivery speed, predictability, and profitability.
This guide provides a step-by-step approach for setting up product value streams, modeling artifacts and workflows, tracking key Flow Metrics, and using data-driven insights to drive continuous improvement. It outlines core processes, analytics tools, and best practices to help organizations align flow performance with business outcomes, monitor changes over time, and optimize delivery across the portfolio.
Process steps
| Process step | Description |
|---|---|
|
Create a product value stream |
Add a new product in Planview Viz to create a new product value stream. Name your product and fill out relevant fields to help your organization understand what your product does and how your value stream works. |
|
Model your product value stream |
Model your product value stream to generate flow metrics. This consists of two steps: Product Modeling and Artifact Modeling. Product Modeling points Viz to specific tools and datasets that are relevant to your product. In this step, add all pertinent artifact sets to the Ideate, Create, Release, or Operate work phases in your product modeling tab. Your tool connections should already be configured by your business admin. Once data is retrieved from your product model, it’s time to move on to Artifact Modeling. The Artifact Modeling tab shows all the different artifact types found. Determine which artifacts carry business value and then map them to one of the four flow items: Defect, Feature, Risk, and Debt. Then, conduct flow state modeling for each artifact’s workflow. Model each artifact’s workflow to one of five flow states: New, Waiting, Active, Done, and Canceled. You can also choose to apply the Smart Model instead. The Smart Model will pull in the artifact states across all tools in the product and map them to one of the five flow states. Once modeling is complete, Viz can start calculating metrics about your speed, velocity, and efficiency. |
|
Track progress on your Flow Metrics dashboard |
The Flow Metrics dashboard provides a clear view of whether your value streams and your flow can support targeted business outcomes. Track your product value stream’s Flow Metrics on your Flow Metrics dashboard, including Flow Velocity, Flow Time, Flow Efficiency, Flow Load, and Flow Distribution. See Flow Metrics Dashboard for more information.
|
|
Analyze and find bottlenecks |
Bottlenecks show where your work is slowing down and piling up. Types of bottlenecks include resource scarcity, lack of automation, process timing, and dependencies. Use Planview Viz’s built-in expertise to analyze your data and pinpoint the bottlenecks in your process so you can identify and fix these areas of improvement. See Bottleneck Analysis and related videos for more information. |
|
Set and achieve business results |
Each value stream exists to achieve targeted business results for value, cost, quality, and happiness. By evaluating Flow Metrics against business results, you can calibrate your value stream accordingly to obtain the desired outcome. |
|
Track Timeline Events |
Events such as adopting a new tool, implementing a new process, increasing headcount, or a company-wide re-org can all impact your Flow Metrics and business results. Adding Timeline Events to your value stream and overlaying them onto Flow Metrics help you better understand trends in your value stream and their underlying causes. |
|
Measure your shift from project to product with Portfolio Insights |
With multiple product value streams, Portfolio Insights present consolidated insights rolled up from all individual products to provide a high-level view into Flow Metrics and business results for executives and senior leaders. |
Best practices
Establish a performance baseline
Track the progress of your value stream to establish a baseline for your performance. Identify areas for improvement such as bottlenecks, wasted time, and areas where work is slowing down. Then, continuously improve by implementing practices that streamline your flow and help you reach your business goals.
Make data-driven decisions
After establishing a performance baseline, use your data as a jumping-off point to test hypotheses, inform operational reviews, drive decision-making, and set business goals. Incorporate Flow Metrics data in internal reporting by quickly and easily exporting snapshots of your data.
Avoid looking at metrics in isolation
Your Flow Metrics should not be viewed individually, but rather in relation to one another for the most accurate representation of your value stream’s performance. For example, by looking at a combination of Flow Load, Flow Time, and Flow Velocity, you can calculate neglected work in progress.
Accurately define flow states
Understand and be able to map work statuses in your workflow to four core states: New, Active, Waiting, and Done. Defining which work statuses map to which flow states informs how your Flow Metrics are calculated. Therefore, be accurate when defining your flow states to avoid misrepresenting your metrics.
Quickly access key metrics through a custom Planview.Me dashboard
Customize your Planview experience using Planview.Me to highlight the data and details you need to get work done. There are several widgets you can work with to customize your Planview.Me experience. The Viz Flow Metrics widget displays the Flow Metrics for a specified product in Viz over the last two full quarters.