
Program Portfolio Planning
Program Portfolio Planning
Program portfolio planning supports a clear process for initiating new business requests, managing new programs, and progressing programs through execution and delivery. A high-level estimate of program costs and benefits are captured in the financial plan, and a strategic program roadmap is created to track progress on project delivery, business outcomes, and important program milestones.
Learn more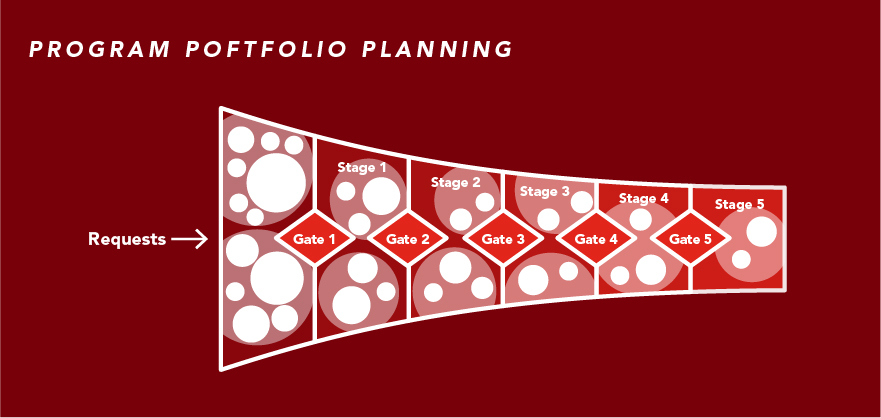
 Business Requests
 Strategy and Program Planning
 Program Governance
Capability resources

AdaptiveWork process flows
Review step-by-step guidance, process flows, and best practices for end users to achieve specific business outcomes.
Learn morePortfolios process flows
Review step-by-step guidance, process flows, and best practices for end users to achieve specific business outcomes.
Learn more