
Reports
Introduction
Planview Hub provides a Metrics dashboard to help you better understand Hub activity such as:
- Number of users
- Number of artifacts created by Hub
- Number of artifact updates by Hub
These metrics are a great tool to:
- Understand and troubleshoot downtime
- Communicate the value of Hub to your organization
- Analyze trends and patterns within your organization, such as:
- Are there certain times of year when higher quantities of customer requests flow from your CRM tool to your Requirements tool?
- Have defects flowing from your ITSM tool to your Agile tool decreased over time?
- ...and more!
The data used to create the metrics refreshes each time the page is reloaded.

Viewing the Reports Dashboard
To access the Metrics Dashboard, click Metrics in the right corner of the screen.

User Counting
The User Count dashboard should only be configured under the guidance of customer care. If the dashboard is configured without guidance, the user count reflected in your dashboard may be inaccurate.
Note that the above does not limit the terms of Planview's Support and Maintenance Policy.
The User Count dashboard lets you view and configure your user count so you can anticipate precisely how many user licenses you will need to purchase upon renewal.
On the User Count dashboard, you’ll see the Current User Count, Rolling 12 Month Count, and Monthly Usage Chart.

The Current User Count represents the number of users from your most recent license renewal date to the current date.
Note: Users that exist in data processed before the current date are not included in the count.

For the Rolling 12 Month Count, the same logic as the Current User Count applies; however, this count begins from precisely one year prior to the current date. This count, along with the Monthly Usage Chart, can help you understand trends in the number of users Hub processes over time.

To find the number of distinct users observed in artifacts processed by Hub, you can download the User Count Report.
This report provides a pipeline view of how many users remain in the user counting logic after each stage. It can also help you understand how exclusions are applied to determine the user count.
The User Count Report includes the following contents:
current-usage-breakdown: The files in this folder can be used to determine the number of users from the most recent license renewal date to the current date.
- 1-raw-data.csv: This is the starting point for the user count.
- 2-deduplicated-based-on-user-fields.csv: This intermediate report only contains users who are included in the user count and can be used to trace users if needed.
- 3-reconciled-based-on-settings.csv: This is the final result after applying person reconciliation overrides.
- 4-unmatched-based-on-settings.csv: This report contains users who are not associated with another person and could not be reconciled based on the configured settings.
12-month-usage-breakdown: The files in this folder can be used to determine the number of users from precisely one year before the current date.
- 1-raw-data.csv: This is the starting point for the user count.
- 2-deduplicated-based-on-user-fields.csv: This is an intermediate report that can be used to trace users.
- 3-reconciled-based-on-settings.csv: This is the final result after applying person reconciliation overrides.
- 4-unmatched-based-on-settings.csv: This report contains users who are not associated with another person and could not be reconciled based on the configured settings.
final-counts.csv: This is the final summary report of the user count results.
person-reconciliation-template.csv: This template can be used to configure Person Reconciliation Overrides on the User Count Configuration screen.
user-count-settings.json: These are the settings configured on the Metrics screen that are used to obtain the count.
To download the User Count Report, click Download Report.

Click User Count Configuration to configure your user count settings.

On the User Count Configuration screen, you can identify exclusions, person reconciliation overrides, and other options that determine user counts.

Integration Exclusions
In the Integration Exclusions tab, you can determine which integrations involve general employees submitting tickets to an IT help desk and non-production integrations, so you can ensure those users are excluded from your user count.
Note: To exclude users involved in an ITSM integration, you must also set the user type to 'Requester' in the User Type Exclusions tab.
User Type Exclusions
In the User Type Exclusions tab, you can further refine exclusions from your user count by determining the user type for the person fields in your repositories.

By default, the user type is set to Standard User, which is always included in the count.
- A Standard User is always included and represent the people doing the work.
- A Requester is always excluded from the count if the corresponding integration is also excluded, since they are seen as outside users (submitting IT or help tickets, for example) and are not employees or subcontractors of your company.
- An Excluded User is always excluded regardless of integration.
To better understand which user types will be counted, refer to the Impact on Count column, which identifies if the user type is included based on the Integration and User Type Exclusions configured.
- Counted indicates that the user type will be counted in the user count.
- Not Counted indicates that the user type will not be counted in the user count.
- Conditional (See details) indicates that the user type will not be counted in integrations that were checked as involving ITSM in the Integration Exclusions tab. If an integration containing the user type was not marked as involving ITSM, it will be counted in the user count.
Person Reconciliation Overrides
In the Person Reconciliation Overrides tab, you can de-duplicate users by mapping their IDs across tools. This ensures that users are not counted more than once in your user count.

To configure a person reconciliation override, click the + icon.

Next, select a repository and choose the user you'd like to reconcile.

Then, select the duplicate user in the other repository to complete the reconciliation override.

If multiple reconciliation overrides need to be configured at once, you can use Bulk Edit Mode.

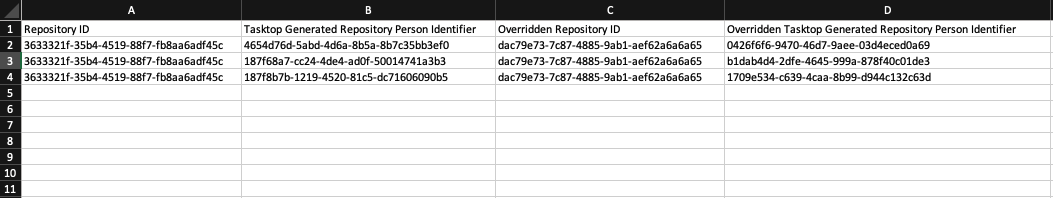
Before adding values in bulk edit mode, you'll first need to open the 1-raw-data.csv file and person-reconciliation-template.csv file (both found in the User Count Report).

After opening the raw data file, copy the Repository ID and Tasktop Generated Repository Person Identifier for the values you'd like to reconcile.
Then, paste the values in the template and save the template as a CSV.
After saving the template, return to the Person Reconciliation Overrides tab and click Bulk Edit Mode.

A pop-up will appear where you can copy and paste the values from the template.
Note: Do not include the column headers from the template when inserting the values.

Once filled out, an entry might look like this:

Start Date
In the Start Date tab, you can select the start date for the User Count report if your contract date differs from your license start date or expiry date. By default, the User Count report will be generated from the start of your most recent license renewal anniversary.

Artifacts Processed
The Artifacts Processed section includes:
- Total Artifacts Created
- Total Artifacts Updated
- Calculated ROI
Note: In Planview Hub Cloud, you can include or exclude Enterprise Data Stream integrations from your Artifacts Processed metrics.

To help understand which artifacts are being synchronized, a pie chart will show the distribution for the metrics based on model, integration, or repository.

Additionally, users can choose to filter the data based on:
- Date Range
- Last 7 Days
- Last 30 Days
- Last 90 Days
- Last Full Year
- Since User Counting Date
- Custom Range
- Integration
- Repository
- Model


Calculated ROI
The Calculated ROI section helps you understand and communicate the direct cost savings enabled by Hub by quantifying the time and effort saved with Hub’s model-based tool integration.
Calculated ROI contains two subsections, Hours Saved and Total Transactions.
- Hours Saved estimates the efficiency gains from synchronization calculated as total hours saved. This number is derived from an estimate of six minutes saved per transaction.
- Total Artifacts, by filter represents the total number of artifacts created and updated based on the filters applied.
Note: You can use the filters to view ROI for a certain repository, integration, or model.
