Insights
- Last updated
- Save as PDF
Overview
With Insights, Viz surfaces issues related to your flow and makes recommendations on how to improve, based on an analysis of your combined Flow Metrics.
The first set of insights—leading indicator analytics—are WIP-related and highlight problems that are hiding under artificially favorable Flow Metrics, like Neglected WIP or a Predicted Flow Time Increase.
To learn more, watch this quick tutorial or see the sections below.
Getting Started with Insights
Insights are displayed at the top of your Flow Metrics dashboard after at least one month of data has been collected.
Note: If your product has between 1-3 months of data available, average Flow Time and Flow Velocity® from the available data will be utilized. As Viz collects additional data, insights will become more precise.
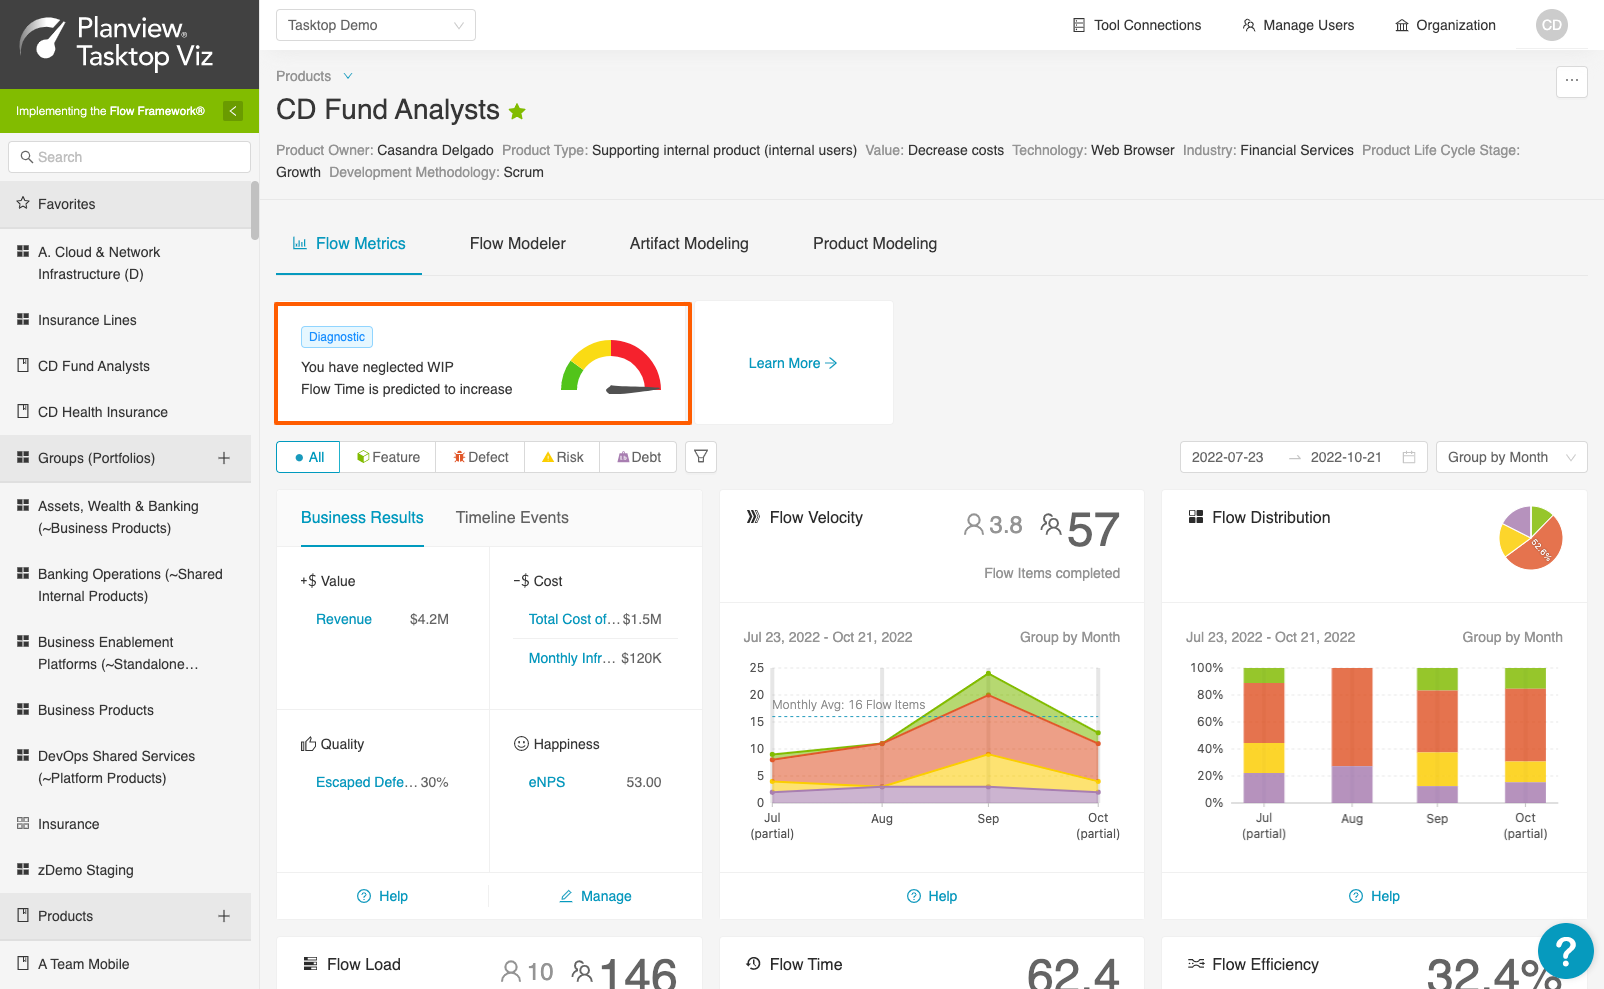
If there isn’t enough data, a banner will appear indicating that your insights are coming soon.

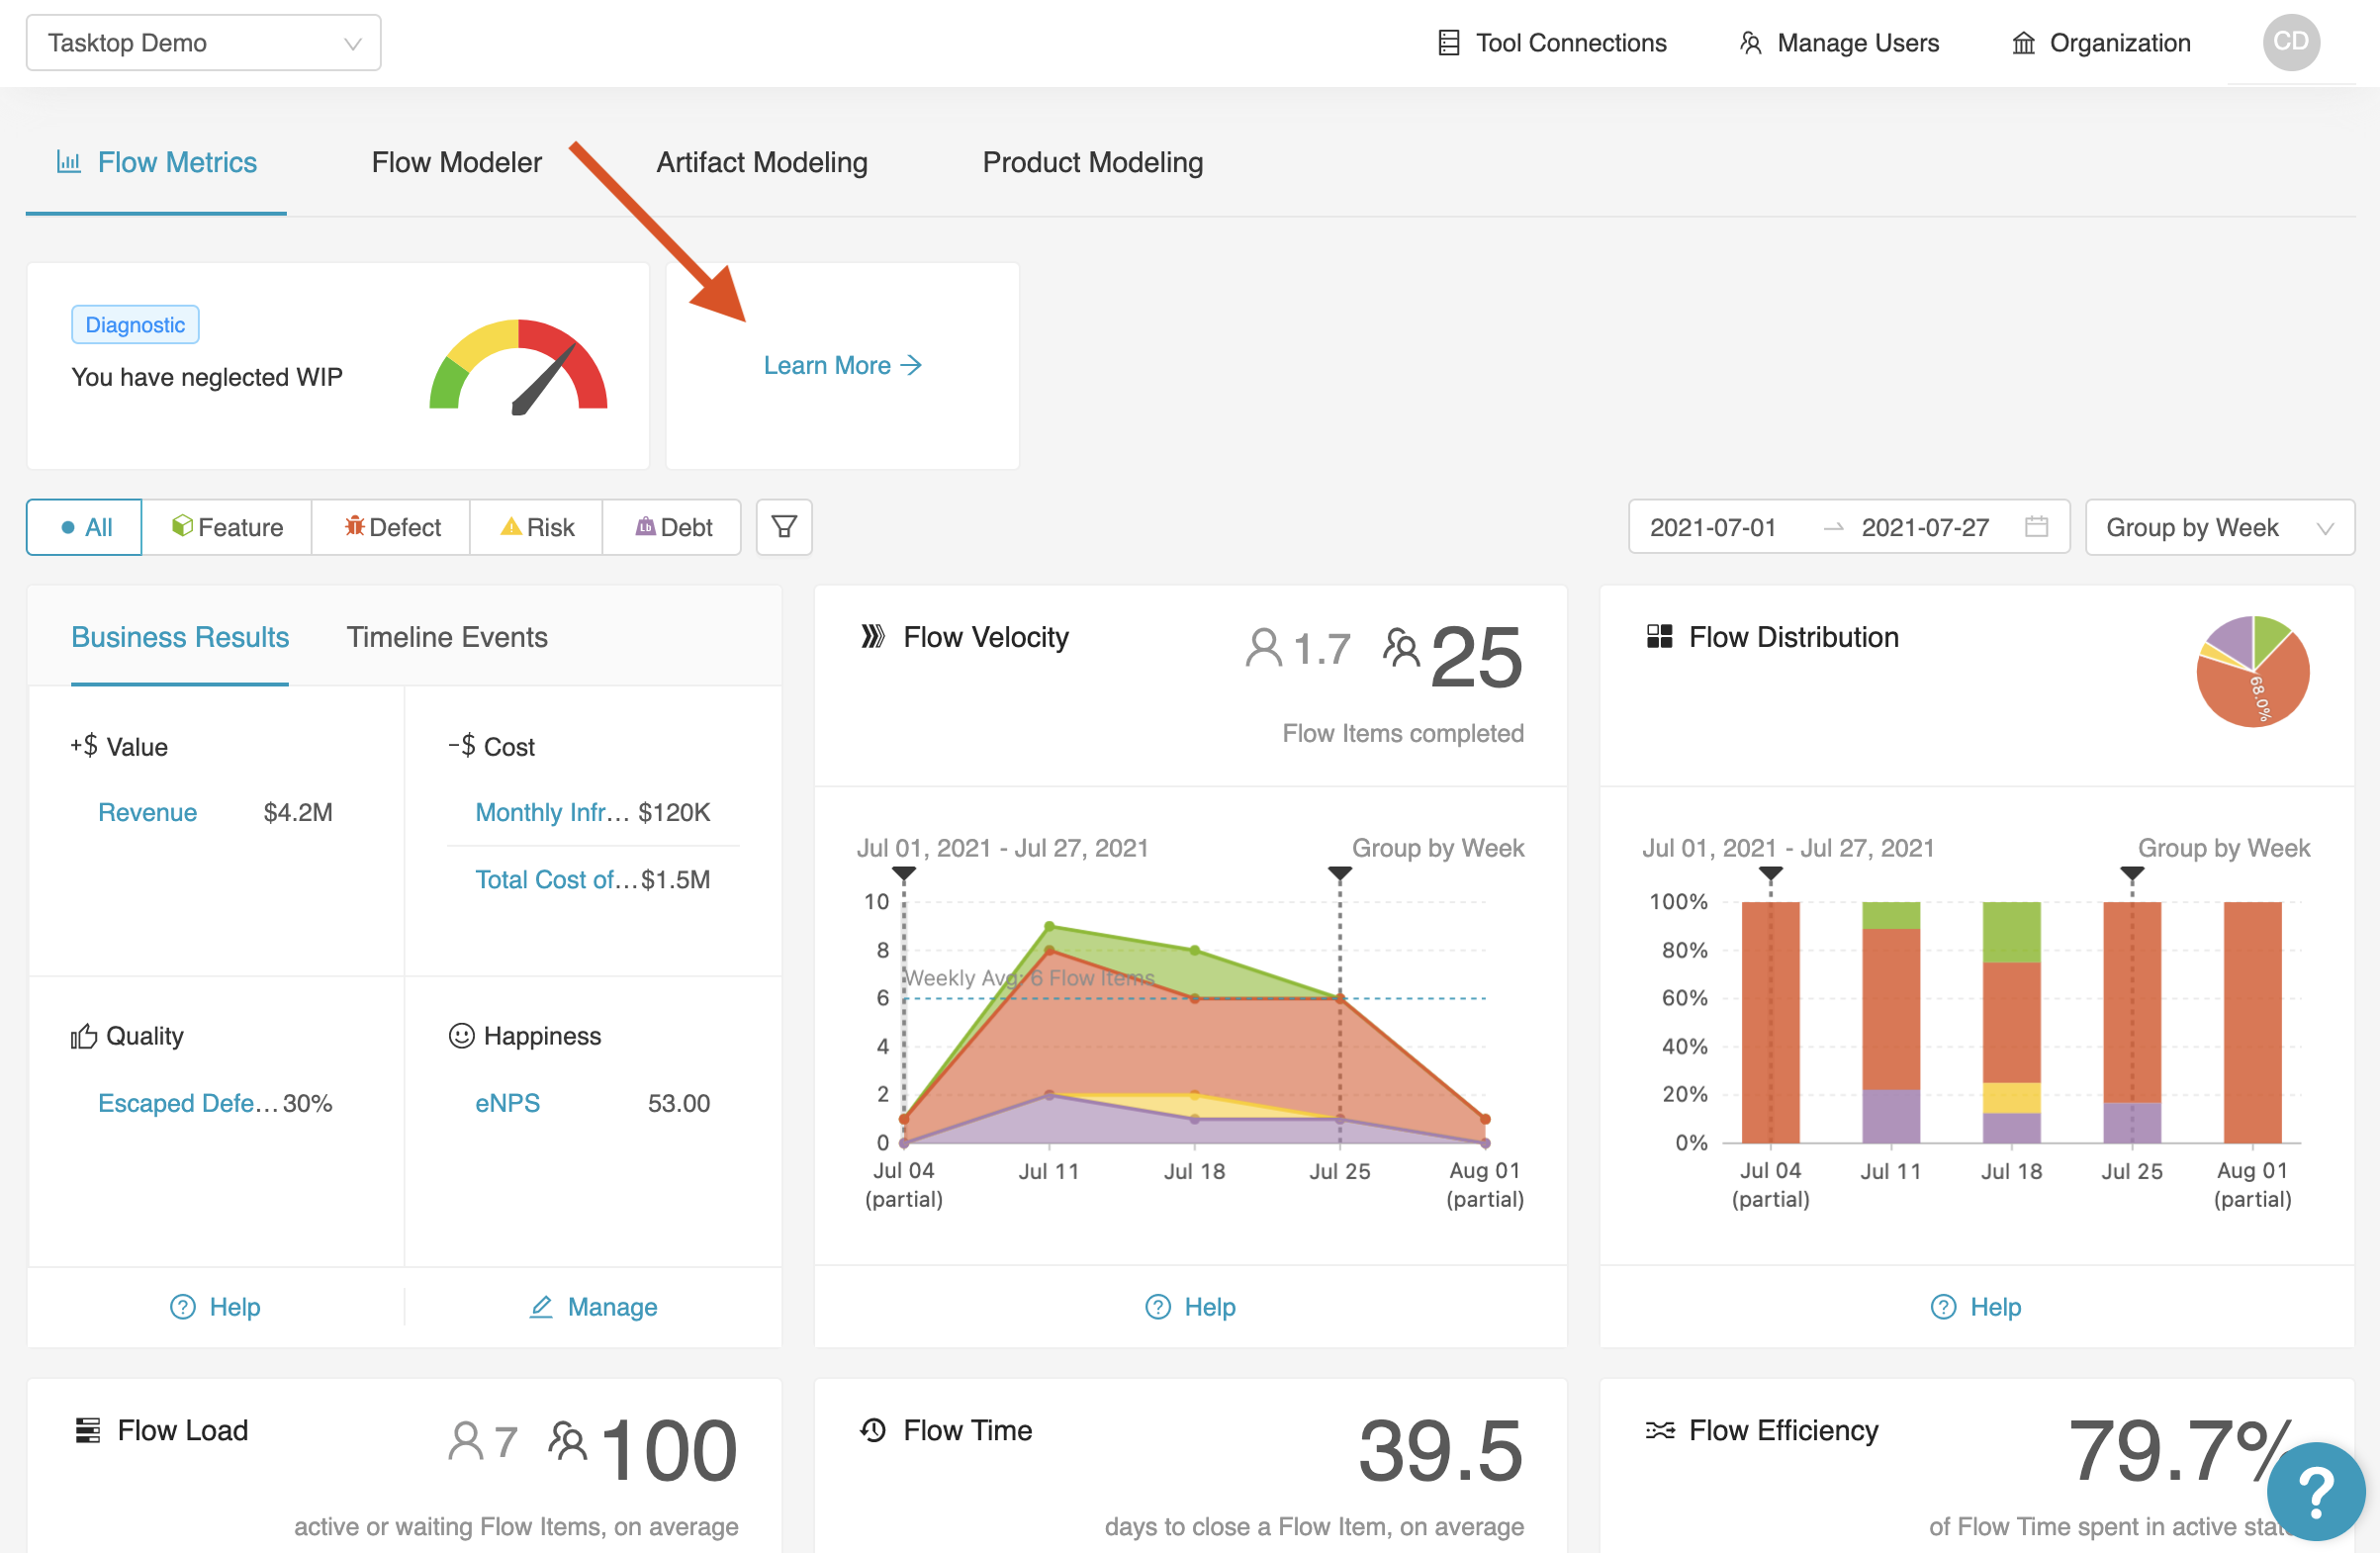
We’ll show you a selection of important insights right on the Flow Metrics page, but make sure to click Learn More to see a more comprehensive view of Viz’s findings.
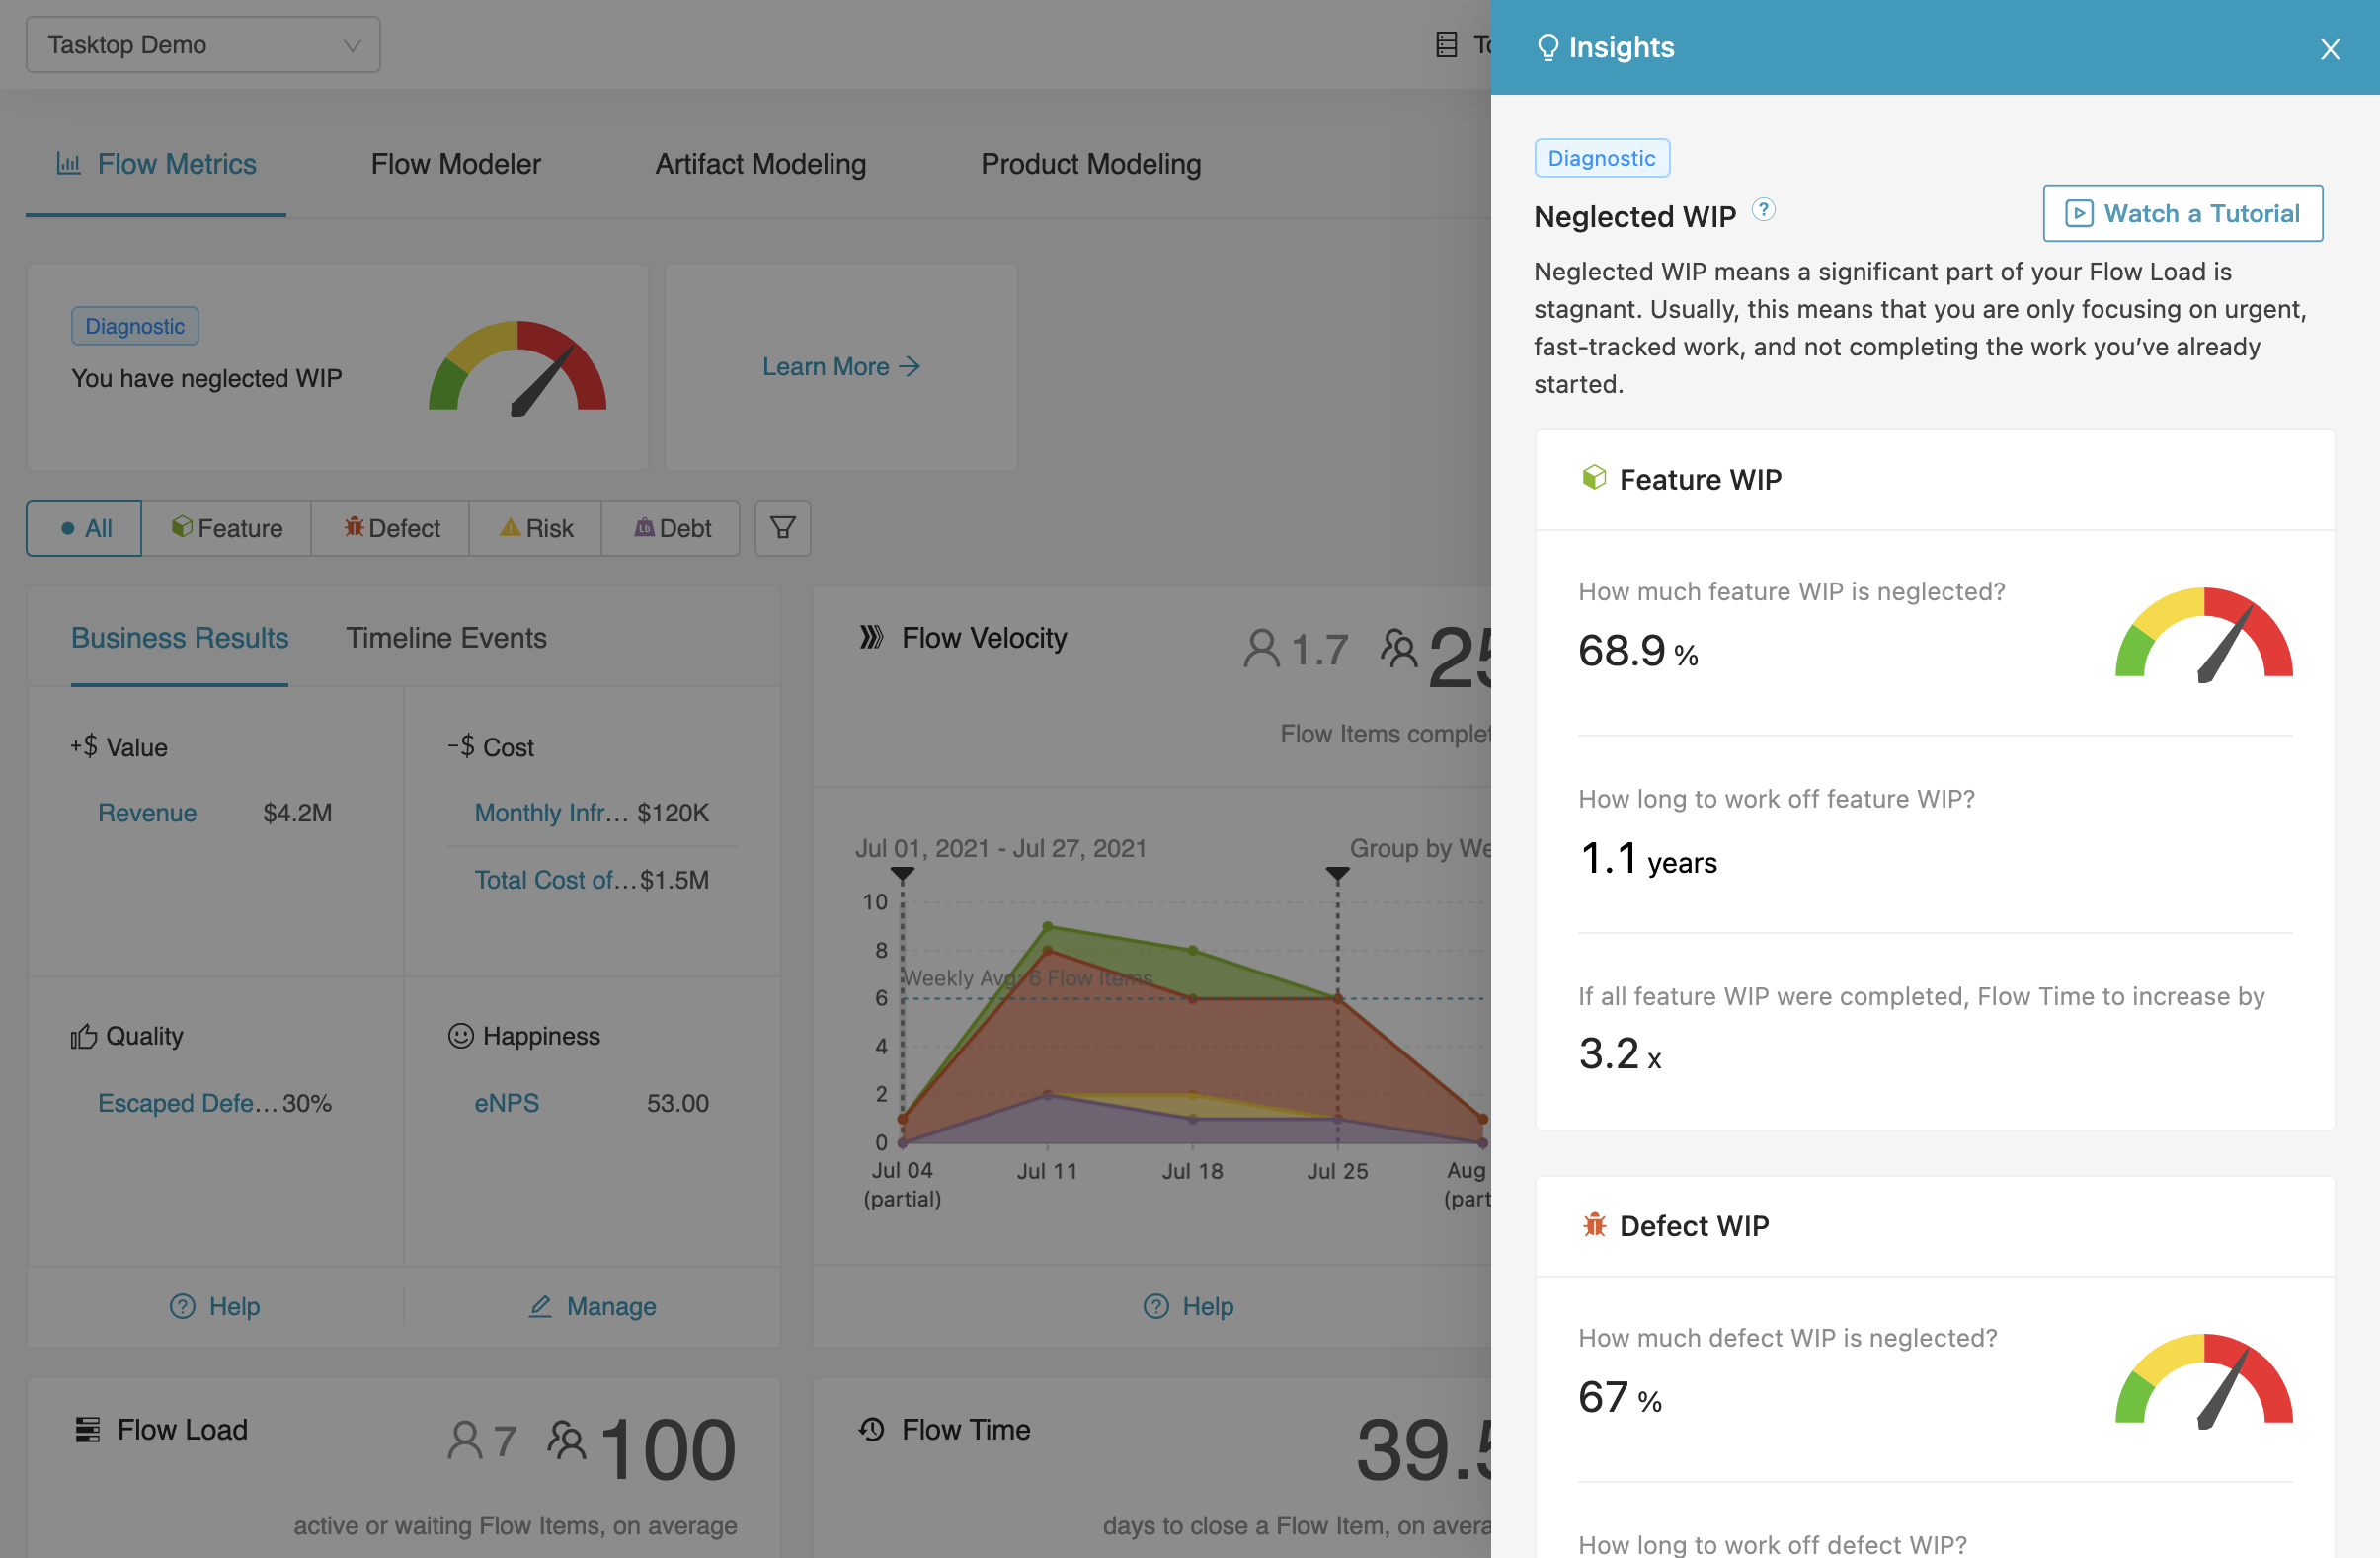
In the Insights drawer, you’ll see your neglected WIP metrics broken down by flow item type, as well as some additional metrics.
To learn more about how to evaluate these insights, click Watch a Tutorial.
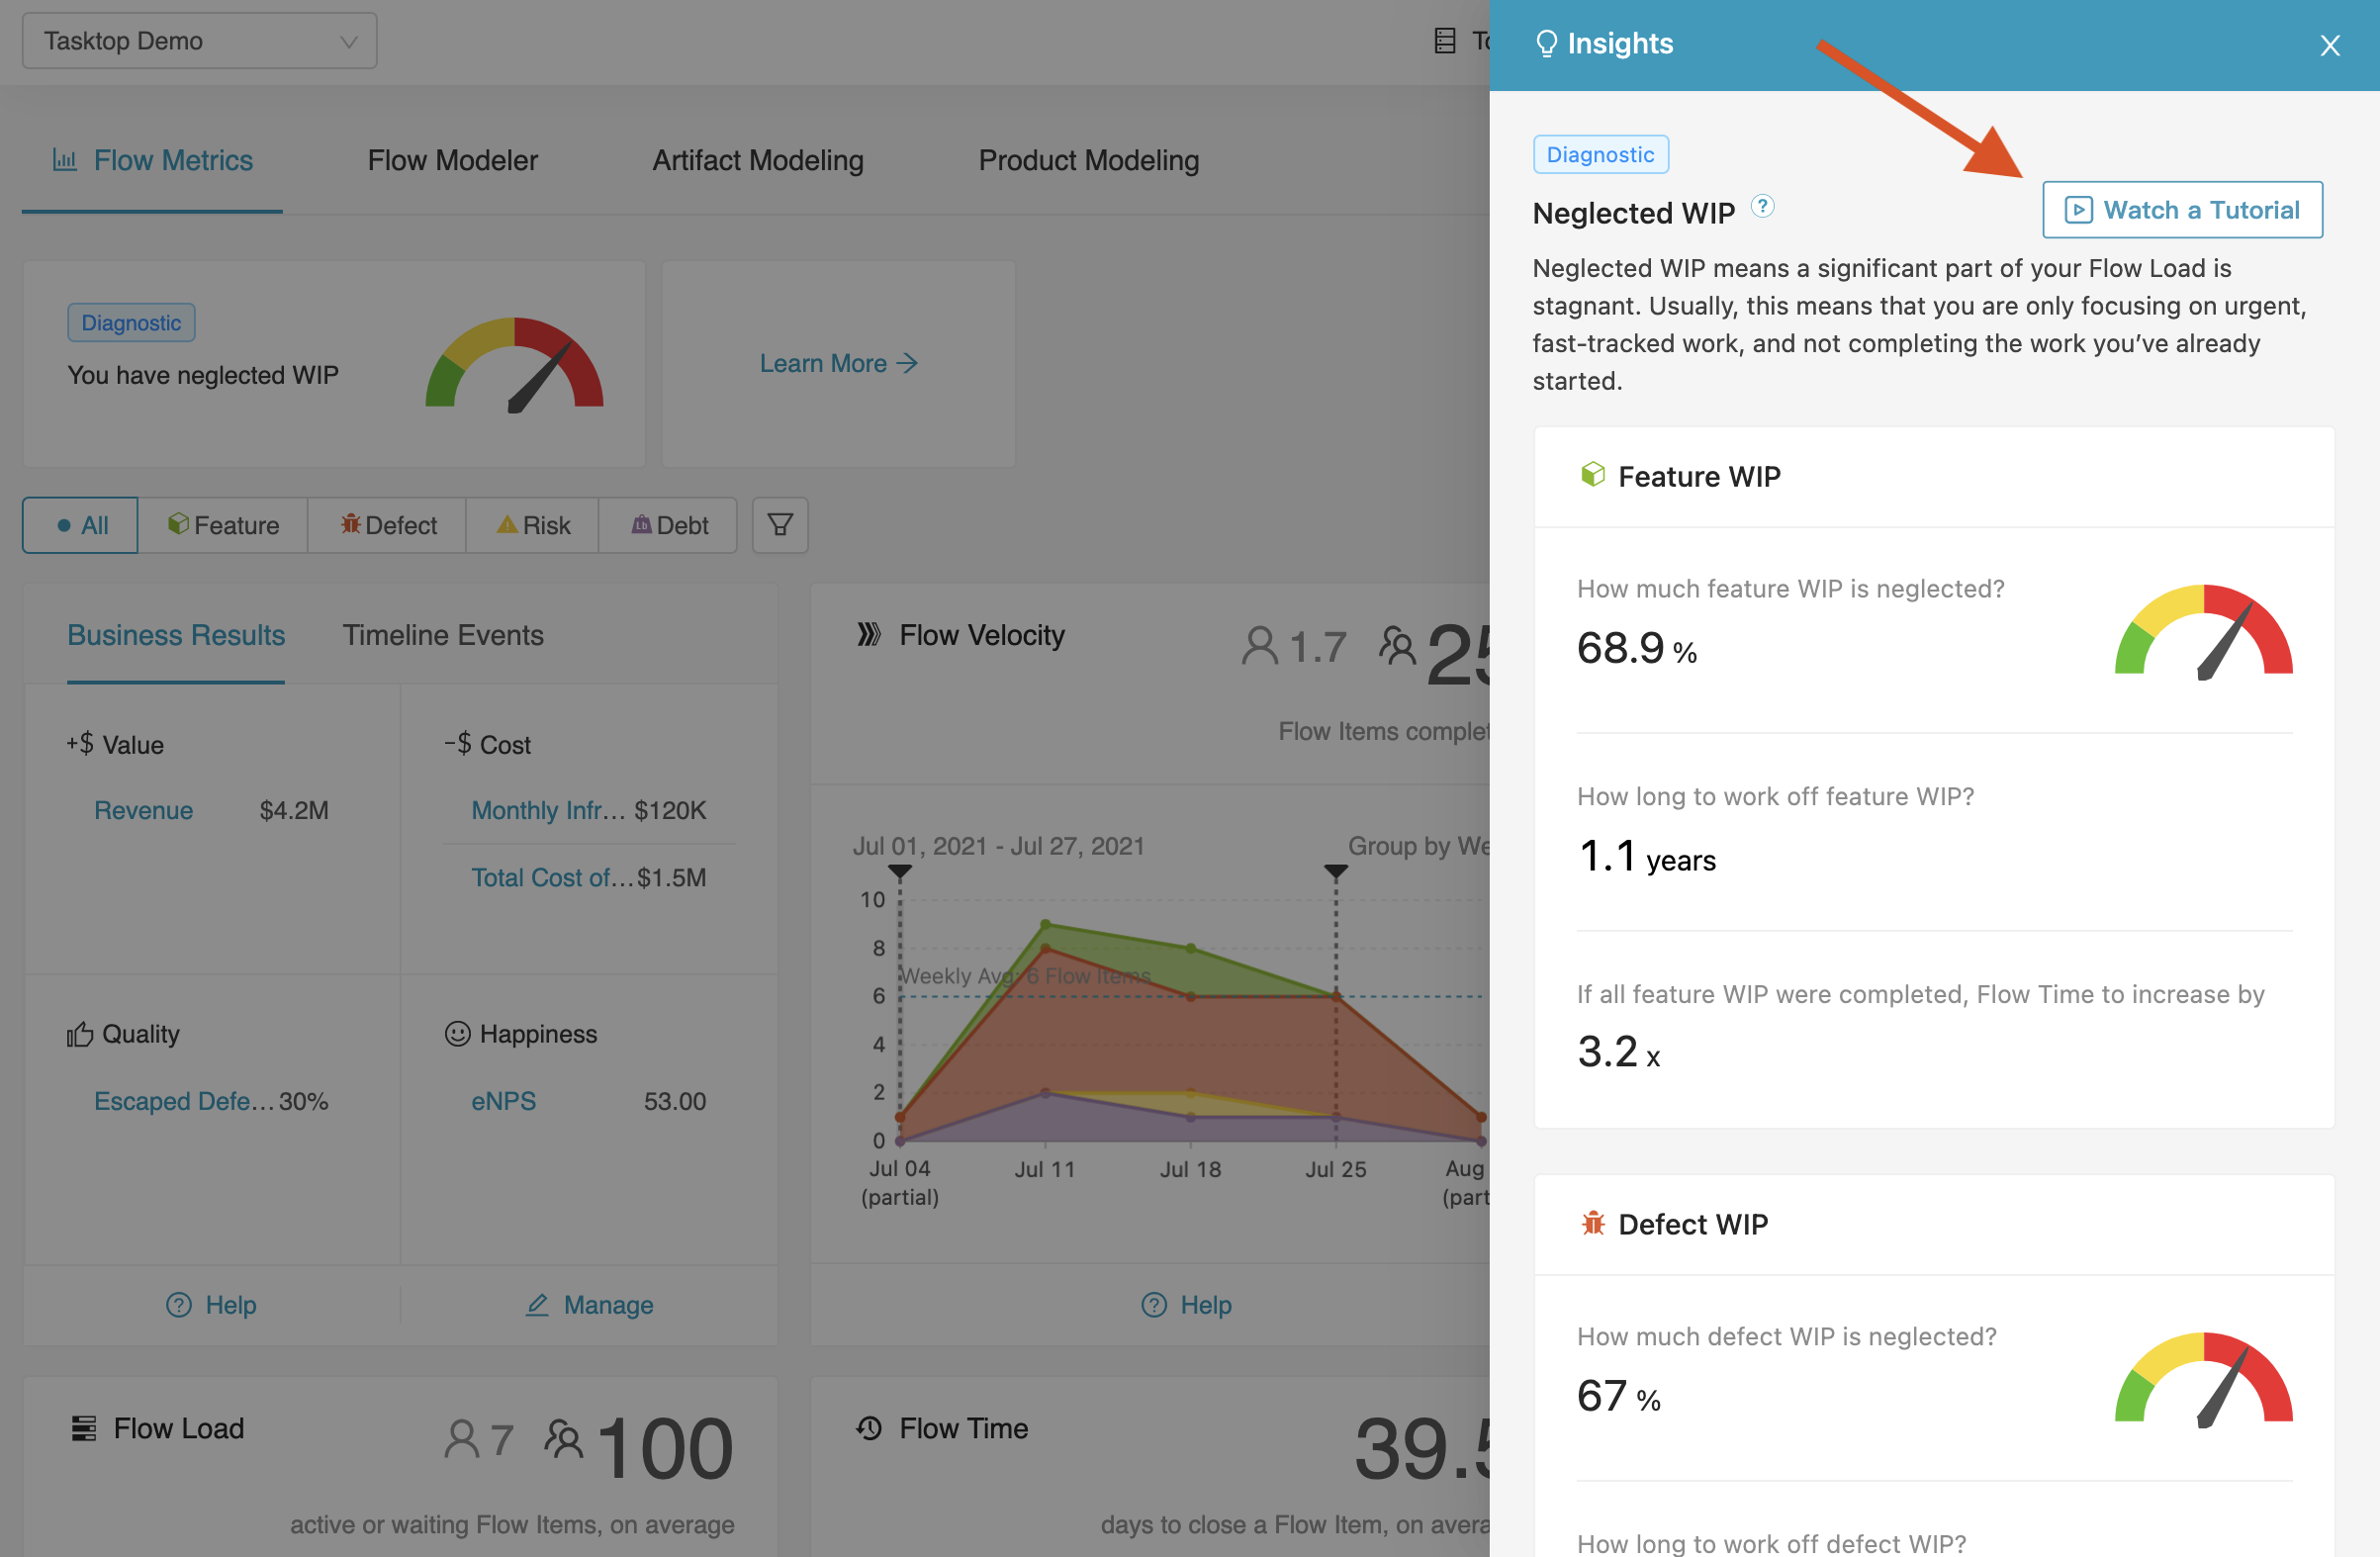
A tutorial from our value stream management experts will appear to advise you on these insights and strategies to keep WIP under control.
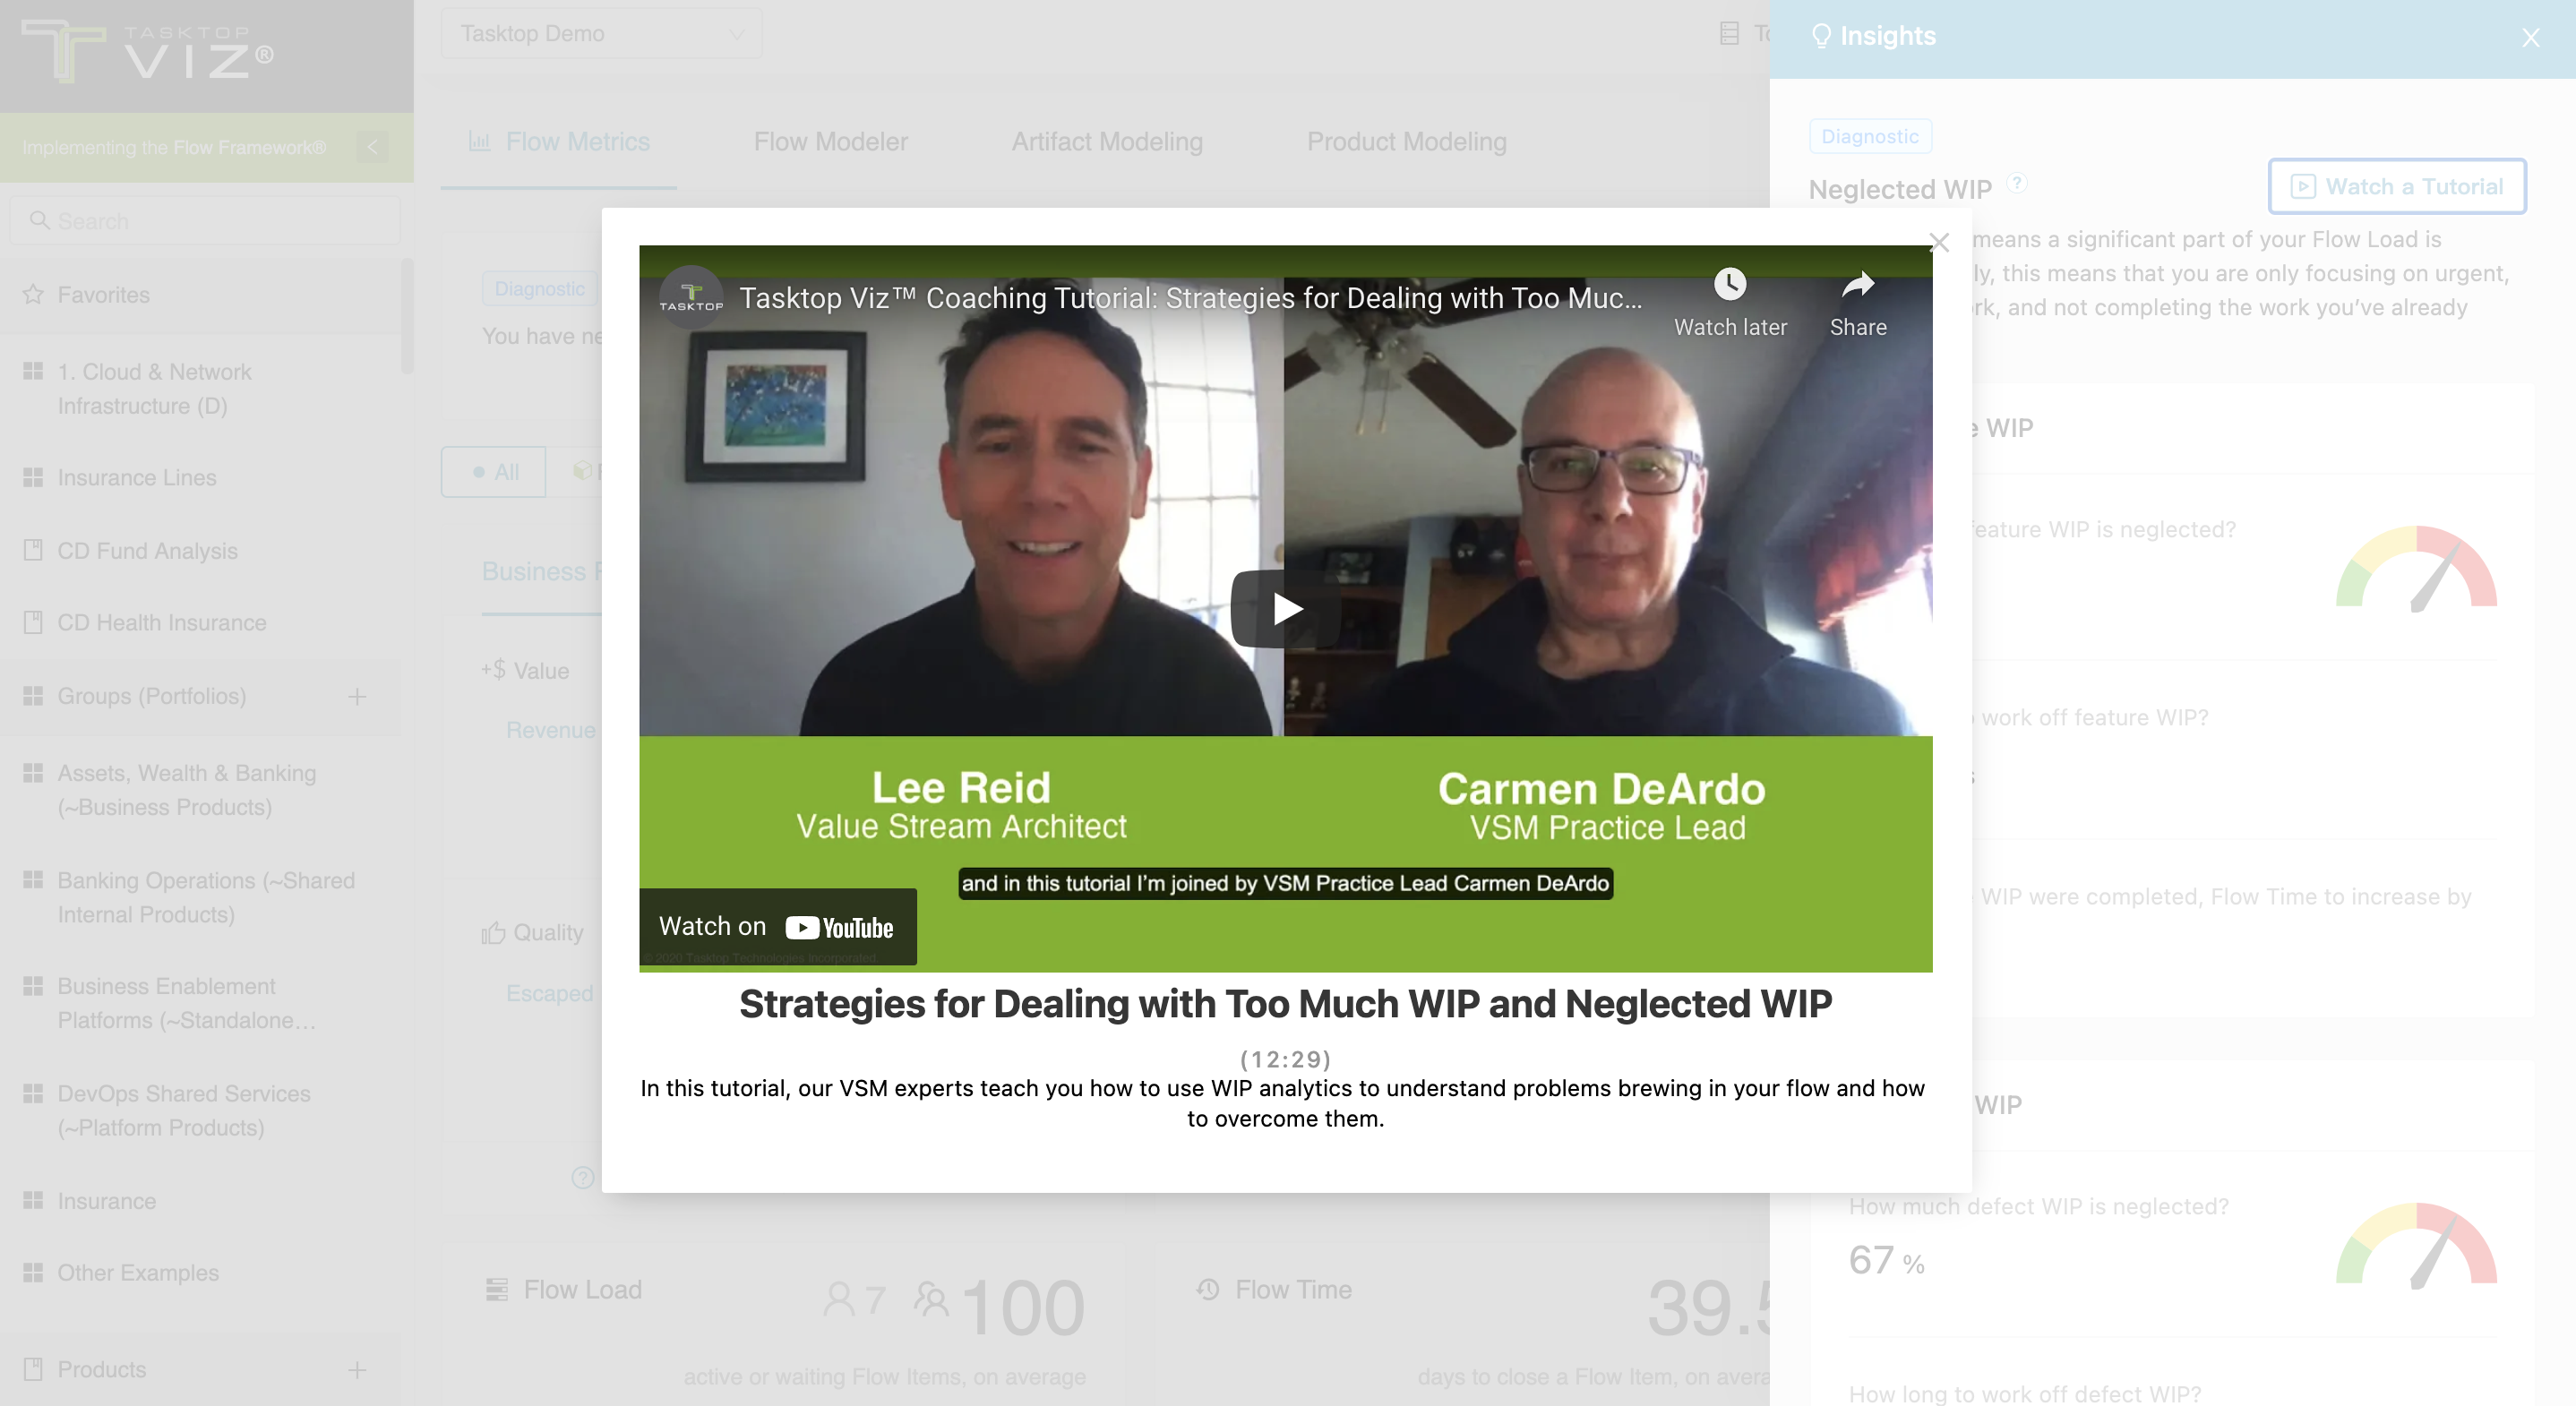
If you'd like to learn more about each insight, see the sections below.
Neglected WIP Insights
When value streams have too much work-in-progress (WIP), it often transpires that only the most urgent work gets attention. Everything else that’s been started just waits until it’s eventually forgotten — this is what we call neglected WIP.
The Neglected WIP insight is defined as the percentage of your Flow Load® that is above the predicted amount based on Flow Velocity® and Flow Time.
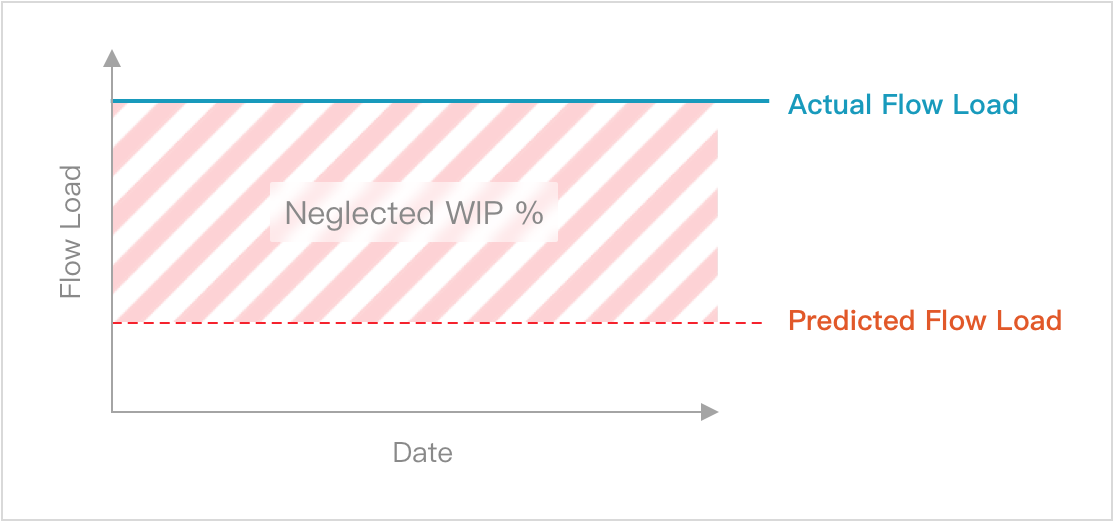
This insight is important to track as it is the best predictor of overall delivery performance. Ideally, all work should start and complete within the planned cycle (i.e., within Flow Time). When delivery time is delayed, customer trust is eroded, and Flow Time predictions are inaccurate. Flow Time and Flow Velocity may appear artificially good because they are measuring completed work. In the meantime, lots of your WIP is aging.
To keep WIP under control, monitor Neglected WIP weekly and consider the following:
- Ensure the Neglected WIP gauge stays green. This indicates less than 20% of WIP is neglected. This is often monitored by Scrum Masters, Teams, Product and Engineering Management.
- Respond to Yellow or Red Gauges. If the gauge turns yellow or red, take action to reduce WIP:
- Reduce Flow Load by the percentage of neglected WIP to maintain current Flow Time or reduce it to your monthly average Flow Velocity.
- Avoid starting new features.
- Move all but the highest priority features to the backlog.
- Pull in the next priority feature as soon as a current feature is completed, rather than waiting for the next planning period.
By maintaining a healthy level of WIP, you can improve delivery times and build trust with your customers and stakeholders.
How do I interpret the Neglected WIP gauge?
- Green: This indicates that less than 20% of WIP is neglected.
- Yellow: This indicates that 21-50% of WIP is neglected.
- Red: This indicates that 51-100% of WIP is neglected.
Here’s an example to demonstrate how too much neglected WIP can impact your product value streams.
Example:
The Alpha Trade value stream has an average Flow Time of 19.9 days. On average, 71 features are completed a month and there are 146 features in progress.

For ideal predictability, all work started should be completed in the average Flow Time. If the team only works on in progress items and no new work comes in, it will take 2.2 months to complete all the work. In this example, 70% of the total work started will not be completed in the average Flow Time.
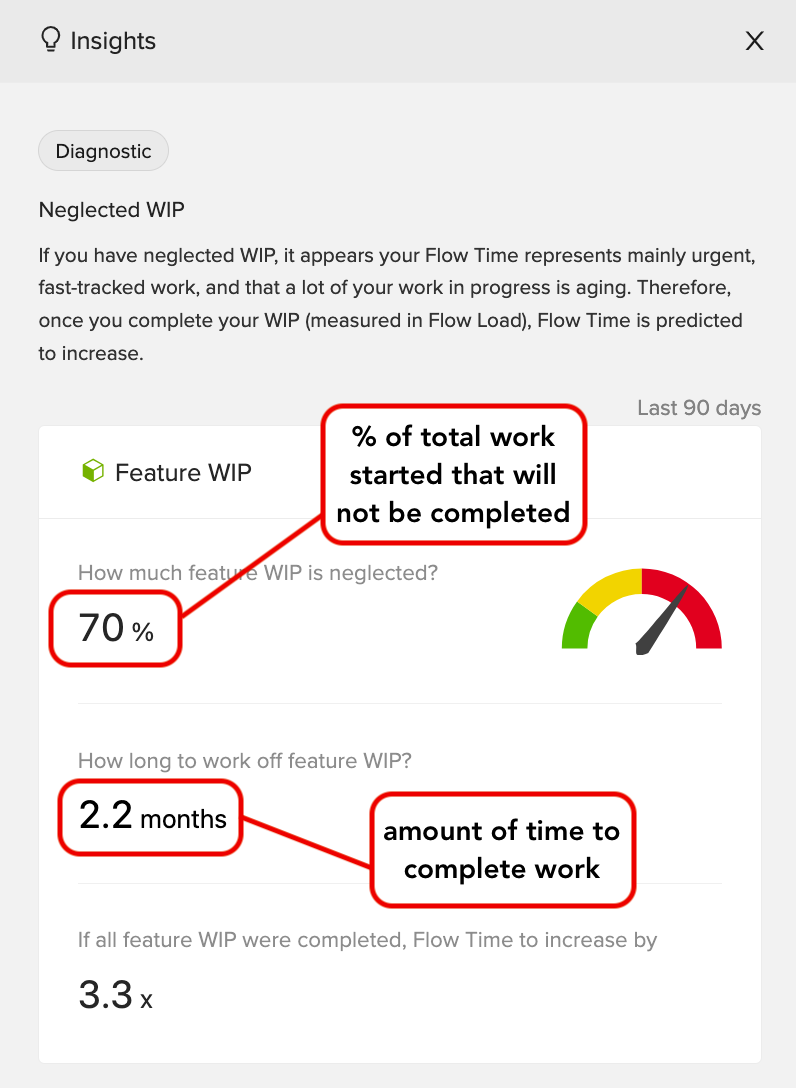
By using the data from the Neglected WIP insight, the team can take actions and make the adjustments needed to get back on track.
How much WIP is neglected?
This gauge indicates how much WIP is being neglected for each flow item type. Neglected WIP erodes trust with your customers, as you fail to meet your commitments despite the work having started.
Implications
- Work appears to be in progress, but is stalled
- Cognitive load on the team is high
- “Push work” mentality still exists
- Unplanned work may be jumping over existing started work, causing more work to be neglected
How can I use this insight?
You can use this insight to:
- Clean up (clear out waste, evaluate what truly needs to be in backlog)
- Add capacity to under-resourced roles for work of true business value
- Enforce WIP limits and utilize a pull model (lean practice)
- Identify the reasons and culture encouraging teams to take on work they cannot complete
How is this insight calculated?
When your Flow Load® exceeds what is predicted for a stable system based on your Flow Time and Flow Velocity®, you have Neglected WIP.* In a stable system, the intake of work is balanced with the capacity to execute and complete this work. Neglected WIP is WIP moving towards completion at a slower rate than work completed in the last 1–3 months.
To derive your Neglected WIP percentage, Viz analyzes average Flow Time and daily Flow Velocity® alongside your current Flow Load®.
*Planview Viz® applies Little’s Law to test the stability of your value stream’s Flow. A key characteristic of unstable systems is the violation of the assumptions of Little’s Law, namely that WIP is growing and work is not uniformly moving to completion.
How long to work off total WIP?
This insight informs product leaders how many months are required to work off existing WIP.
Implications
- Value could be stale by the time work is completed
- Creation of work that cannot be completed is waste
- Roles are incentivized for local optimization
- Context-switching can negatively impact productivity, morale, and engagement
How can I use this insight?
You can use this insight to:
- Collaborate with business partners to determine a healthy backlog size
- Revisit OKRs (Objectives and Key Results) for front-end work processes to ensure they do not incentivize priming work for intake
How is this insight calculated?
To derive this metric, Viz analyzes current Flow Load® and typical Flow Velocity®.
If all WIP were completed, Flow Time to increase by
This insight identifies when time-to-market, as measured by Flow Time, is predicted to increase based on current WIP levels.
Implications
- Flow Time can appear artificially low and misinform your future commitments
- If all Neglected WIP were closed, Flow Time would increase to show a more meaningful number
- Flow items being completed are almost entirely quick, high priority work that jumps the queue, while the rest of the work stagnates
How can I use this insight?
You can use this insight to:
- Better understand your true Flow Time and make business decisions accordingly
- Incorporate actual Flow Time and Flow Velocity® data into the planning sessions
How do I calculate this insight?
To derive this metric, Viz analyzes average Flow Time and Flow Velocity® alongside your current Flow Load®.
Coaching Tutorial
Learn more about addressing neglected WIP in this short coaching tutorial from our VSM experts:
Note: This tutorial can also be accessed from the Insights drawer.

