Portfolio View
Introduction
The Portfolio View (i.e., Products List) offers a birds-eye view of all the products in your portfolio — providing insight into trending Flow Metrics and easy access to Business Results and Timeline Events.
Note: You must be granted Executive user role permissions to access this feature.
The Portfolio View can be accessed in three ways:
- Click on your organization's name at the top of the Navigator and click the Products tab.
- Click All Portfolios & Products in the main menu and select the Products tab.
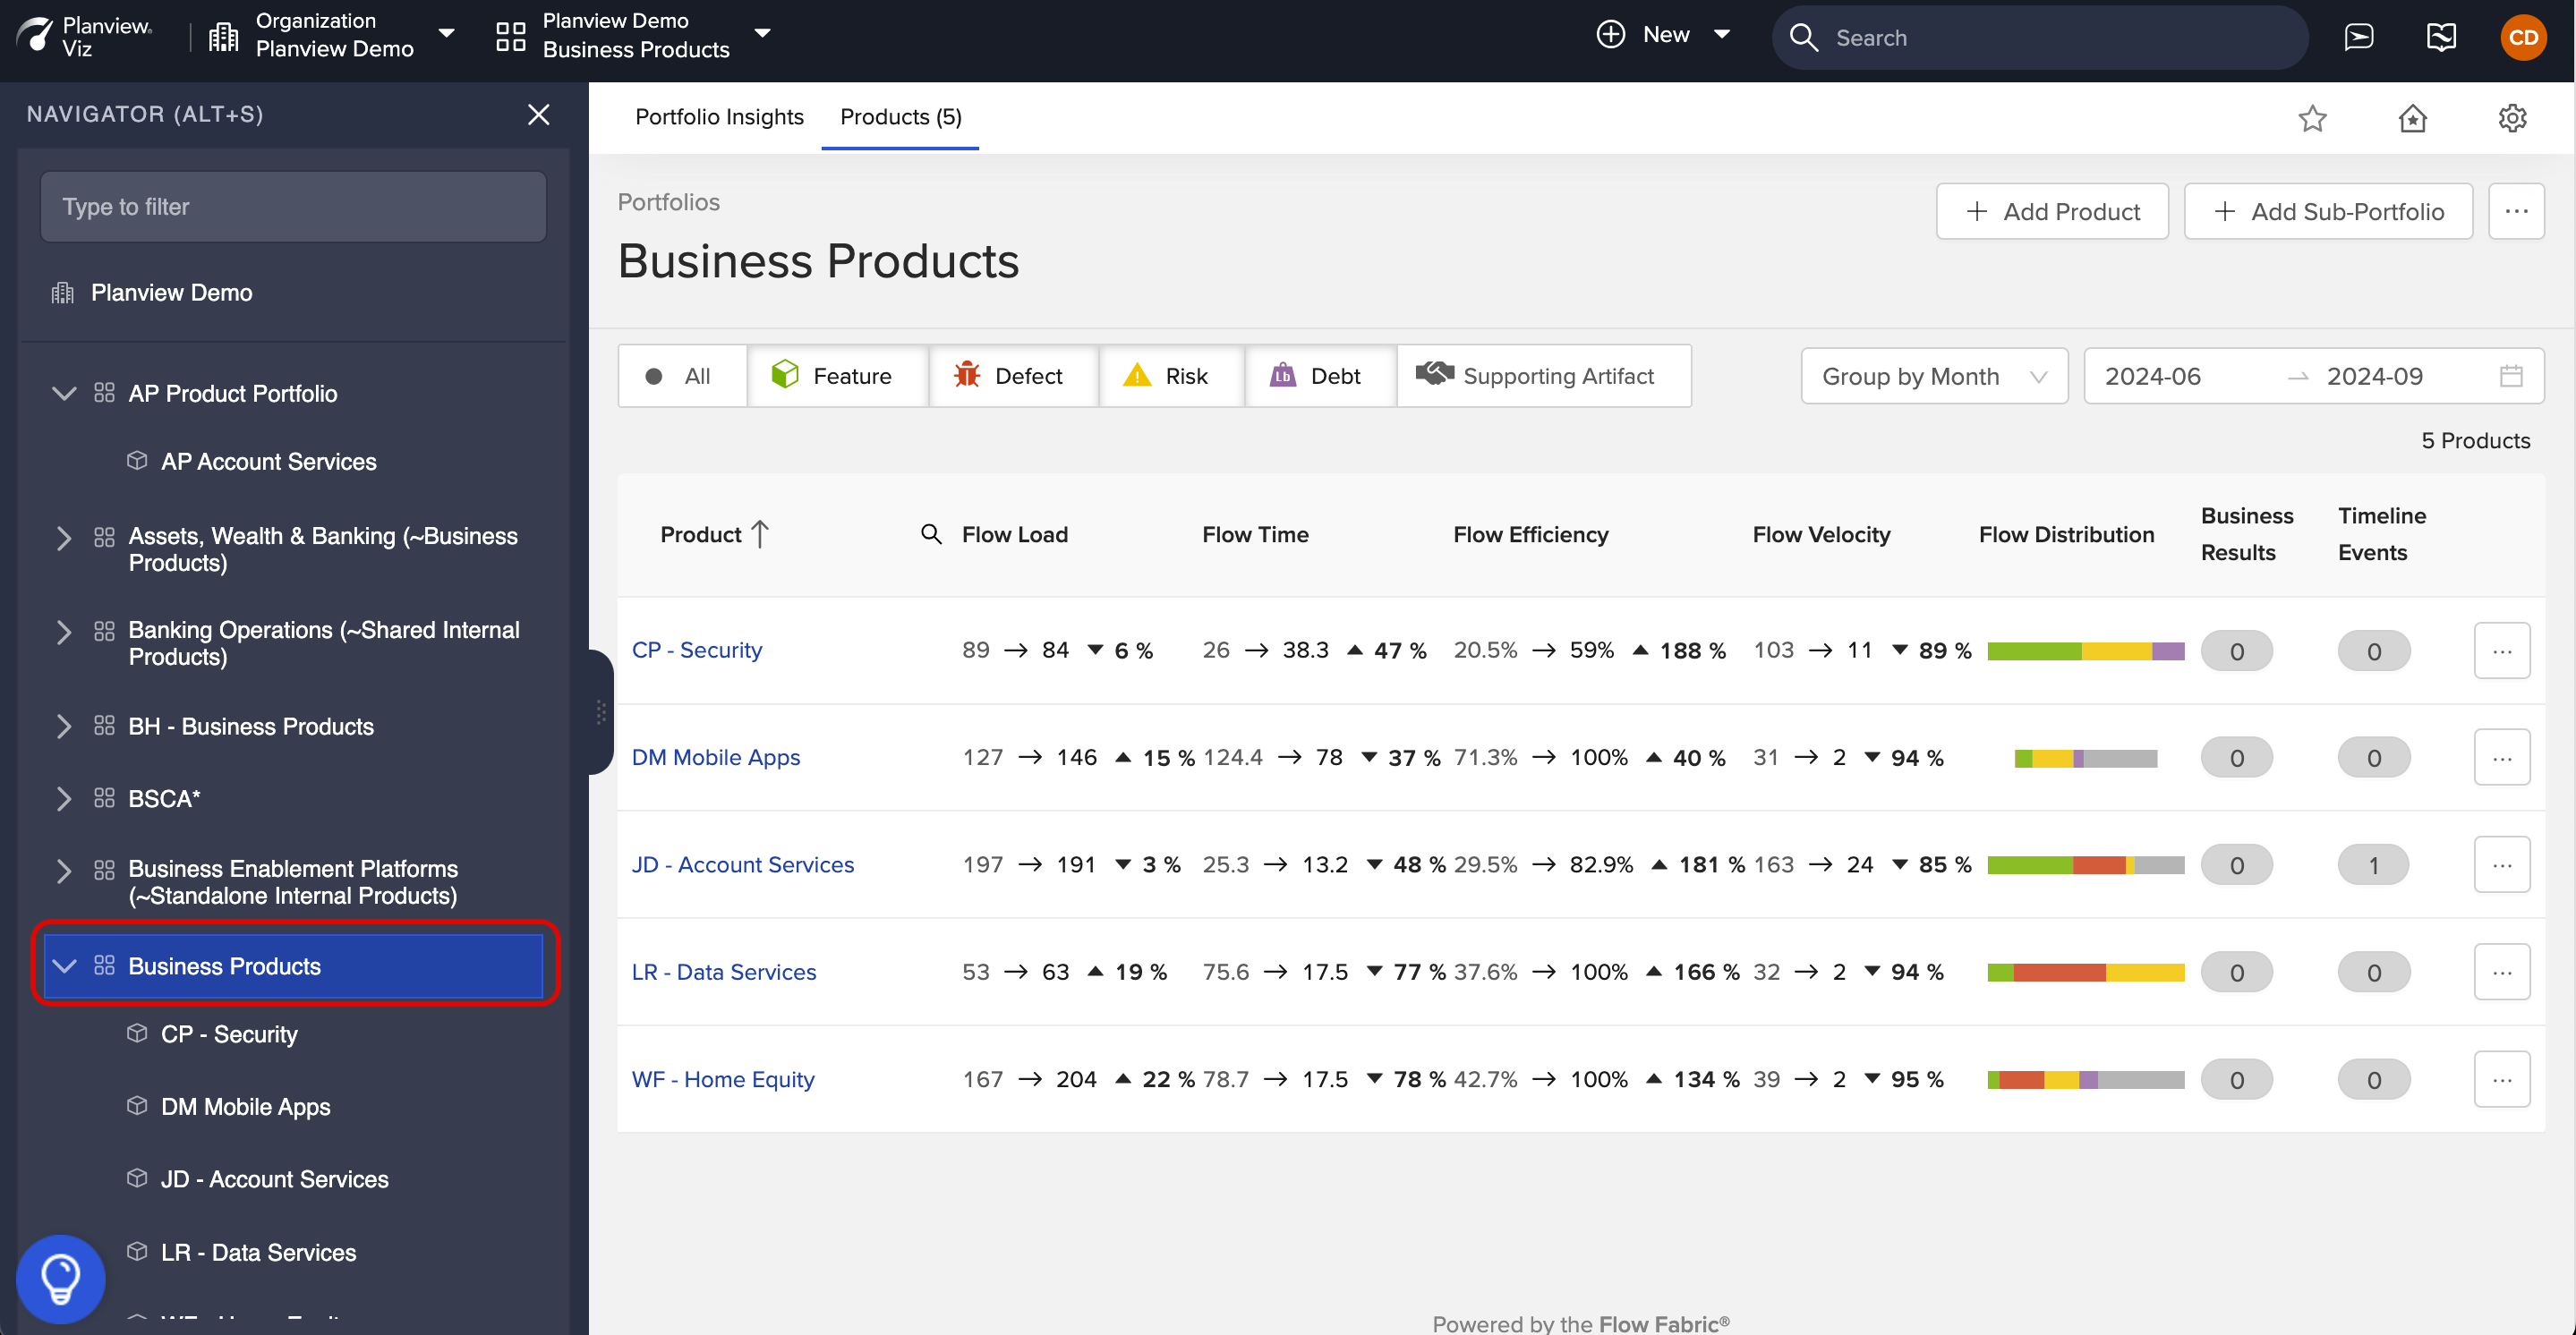
- Select an individual portfolio in the Navigator and click the Products tab.


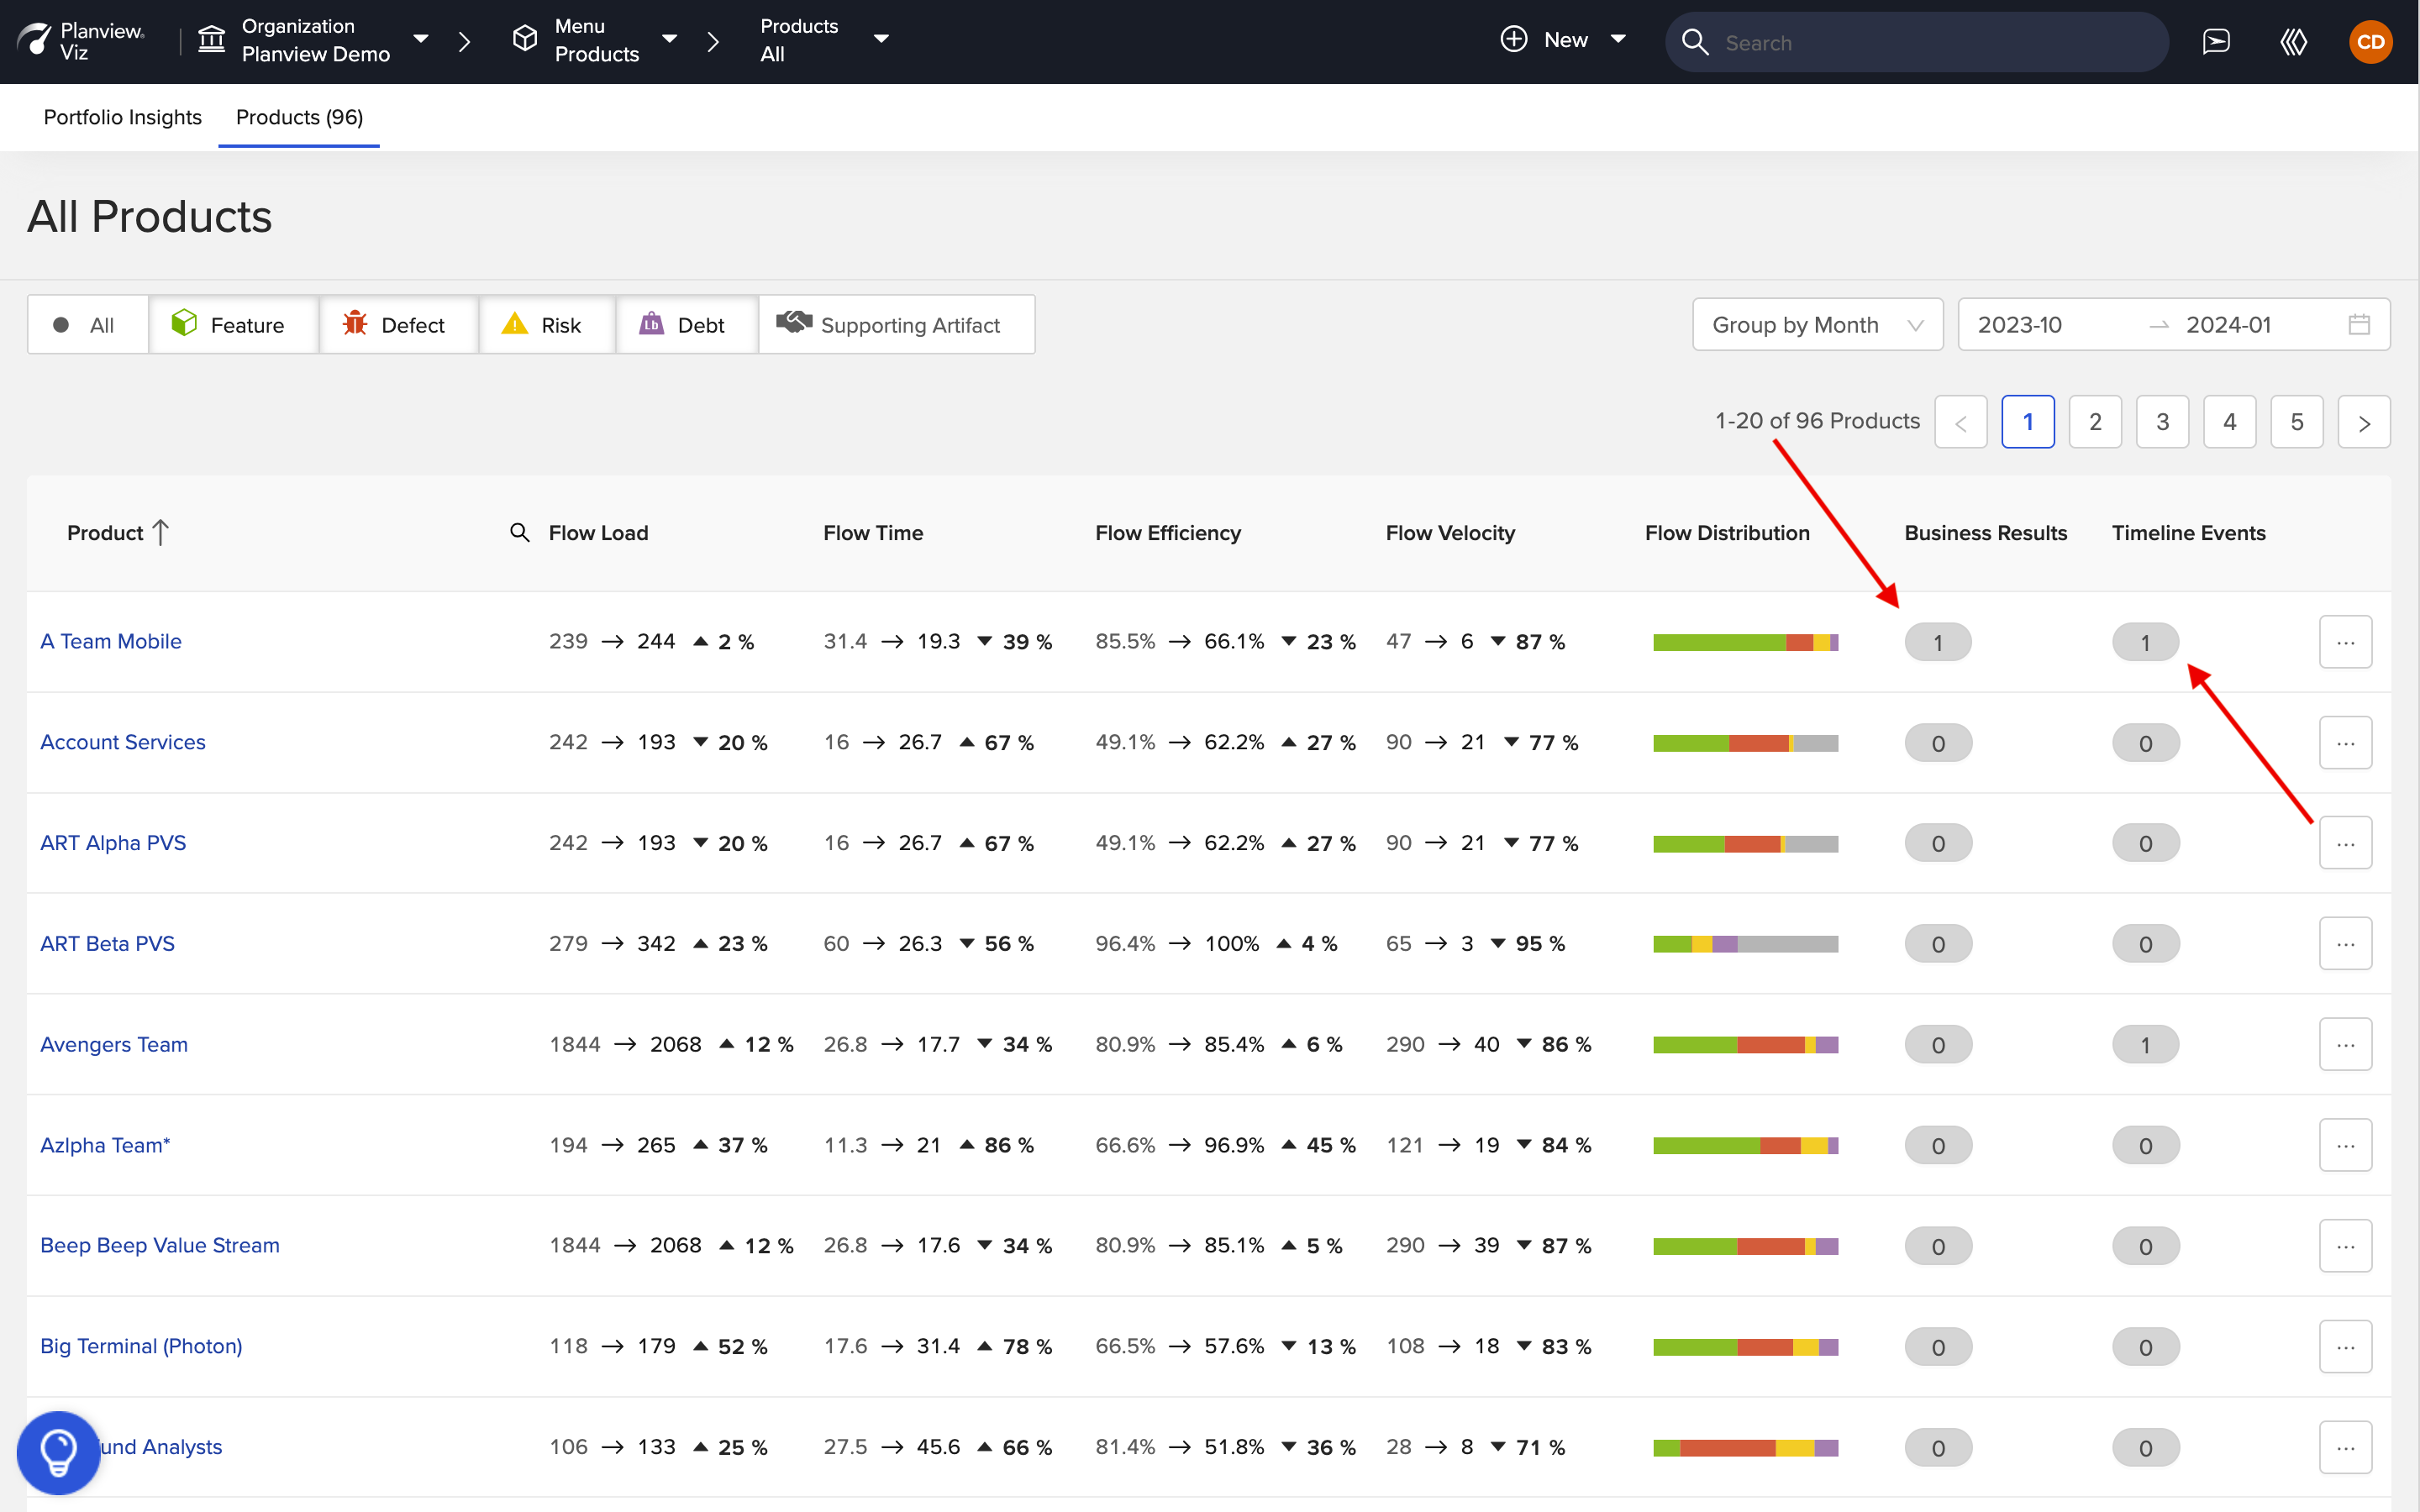
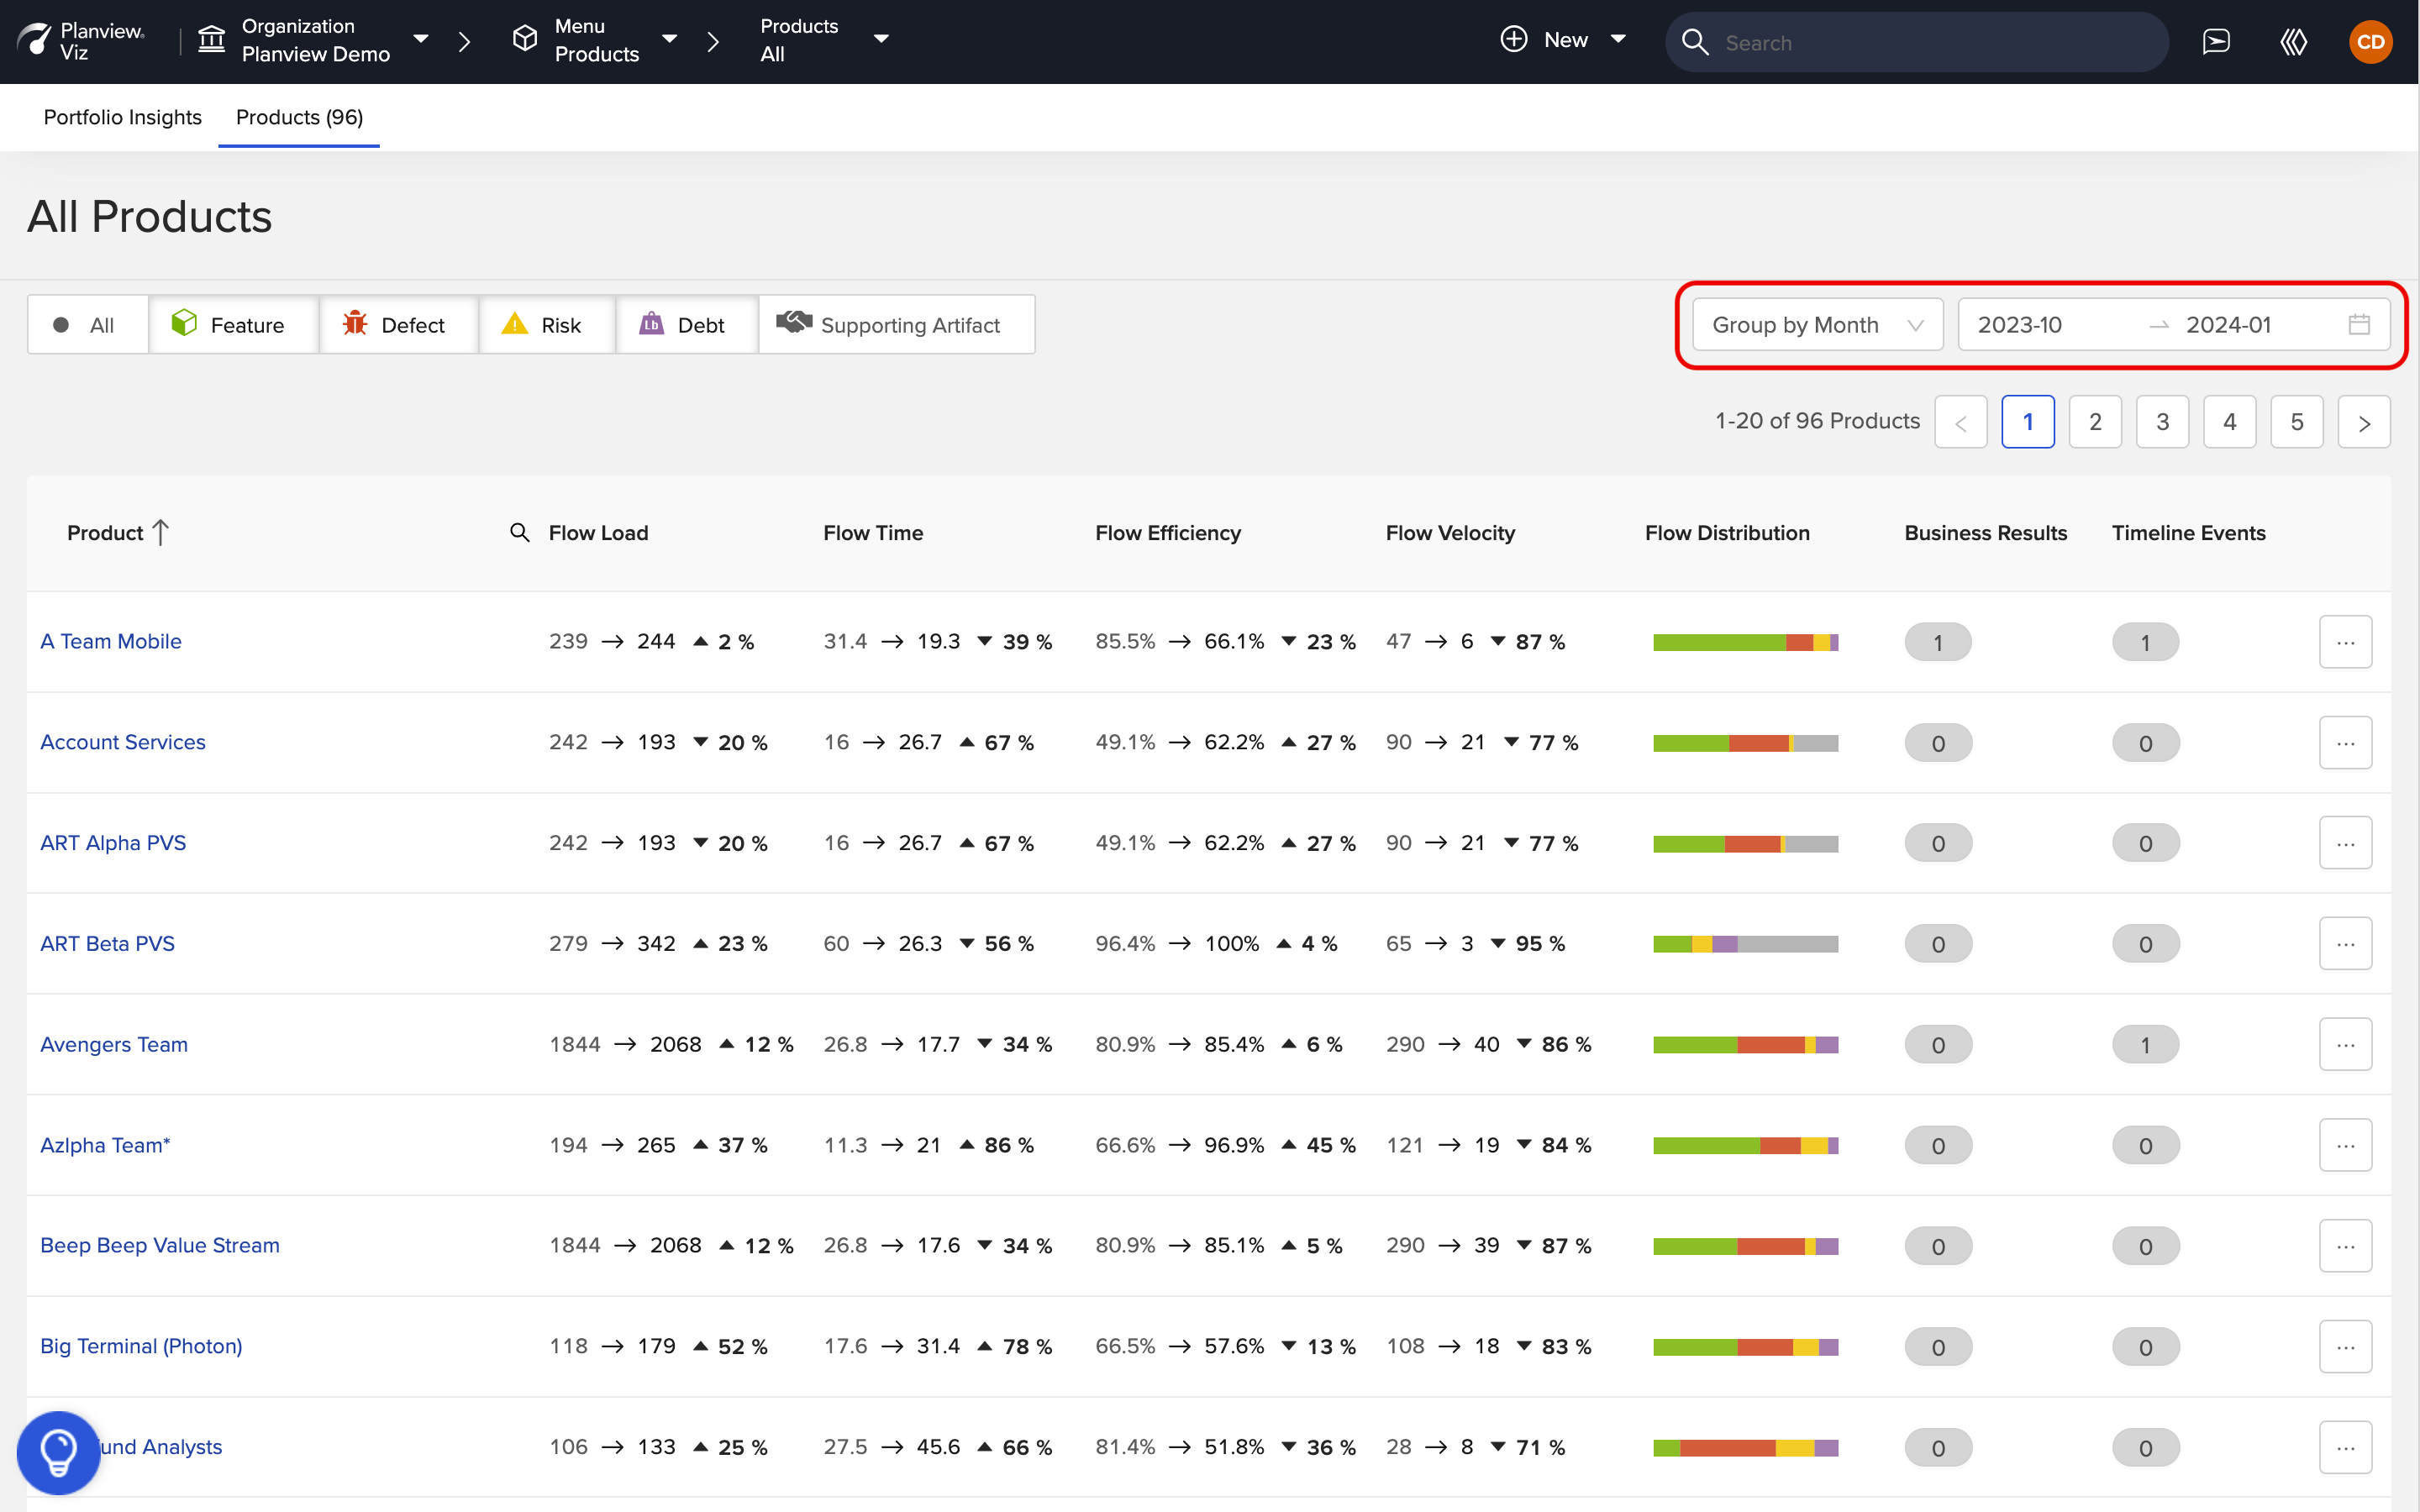
The Portfolio View will show you all the products in your organization or product group and the trending Flow Metrics for each product.
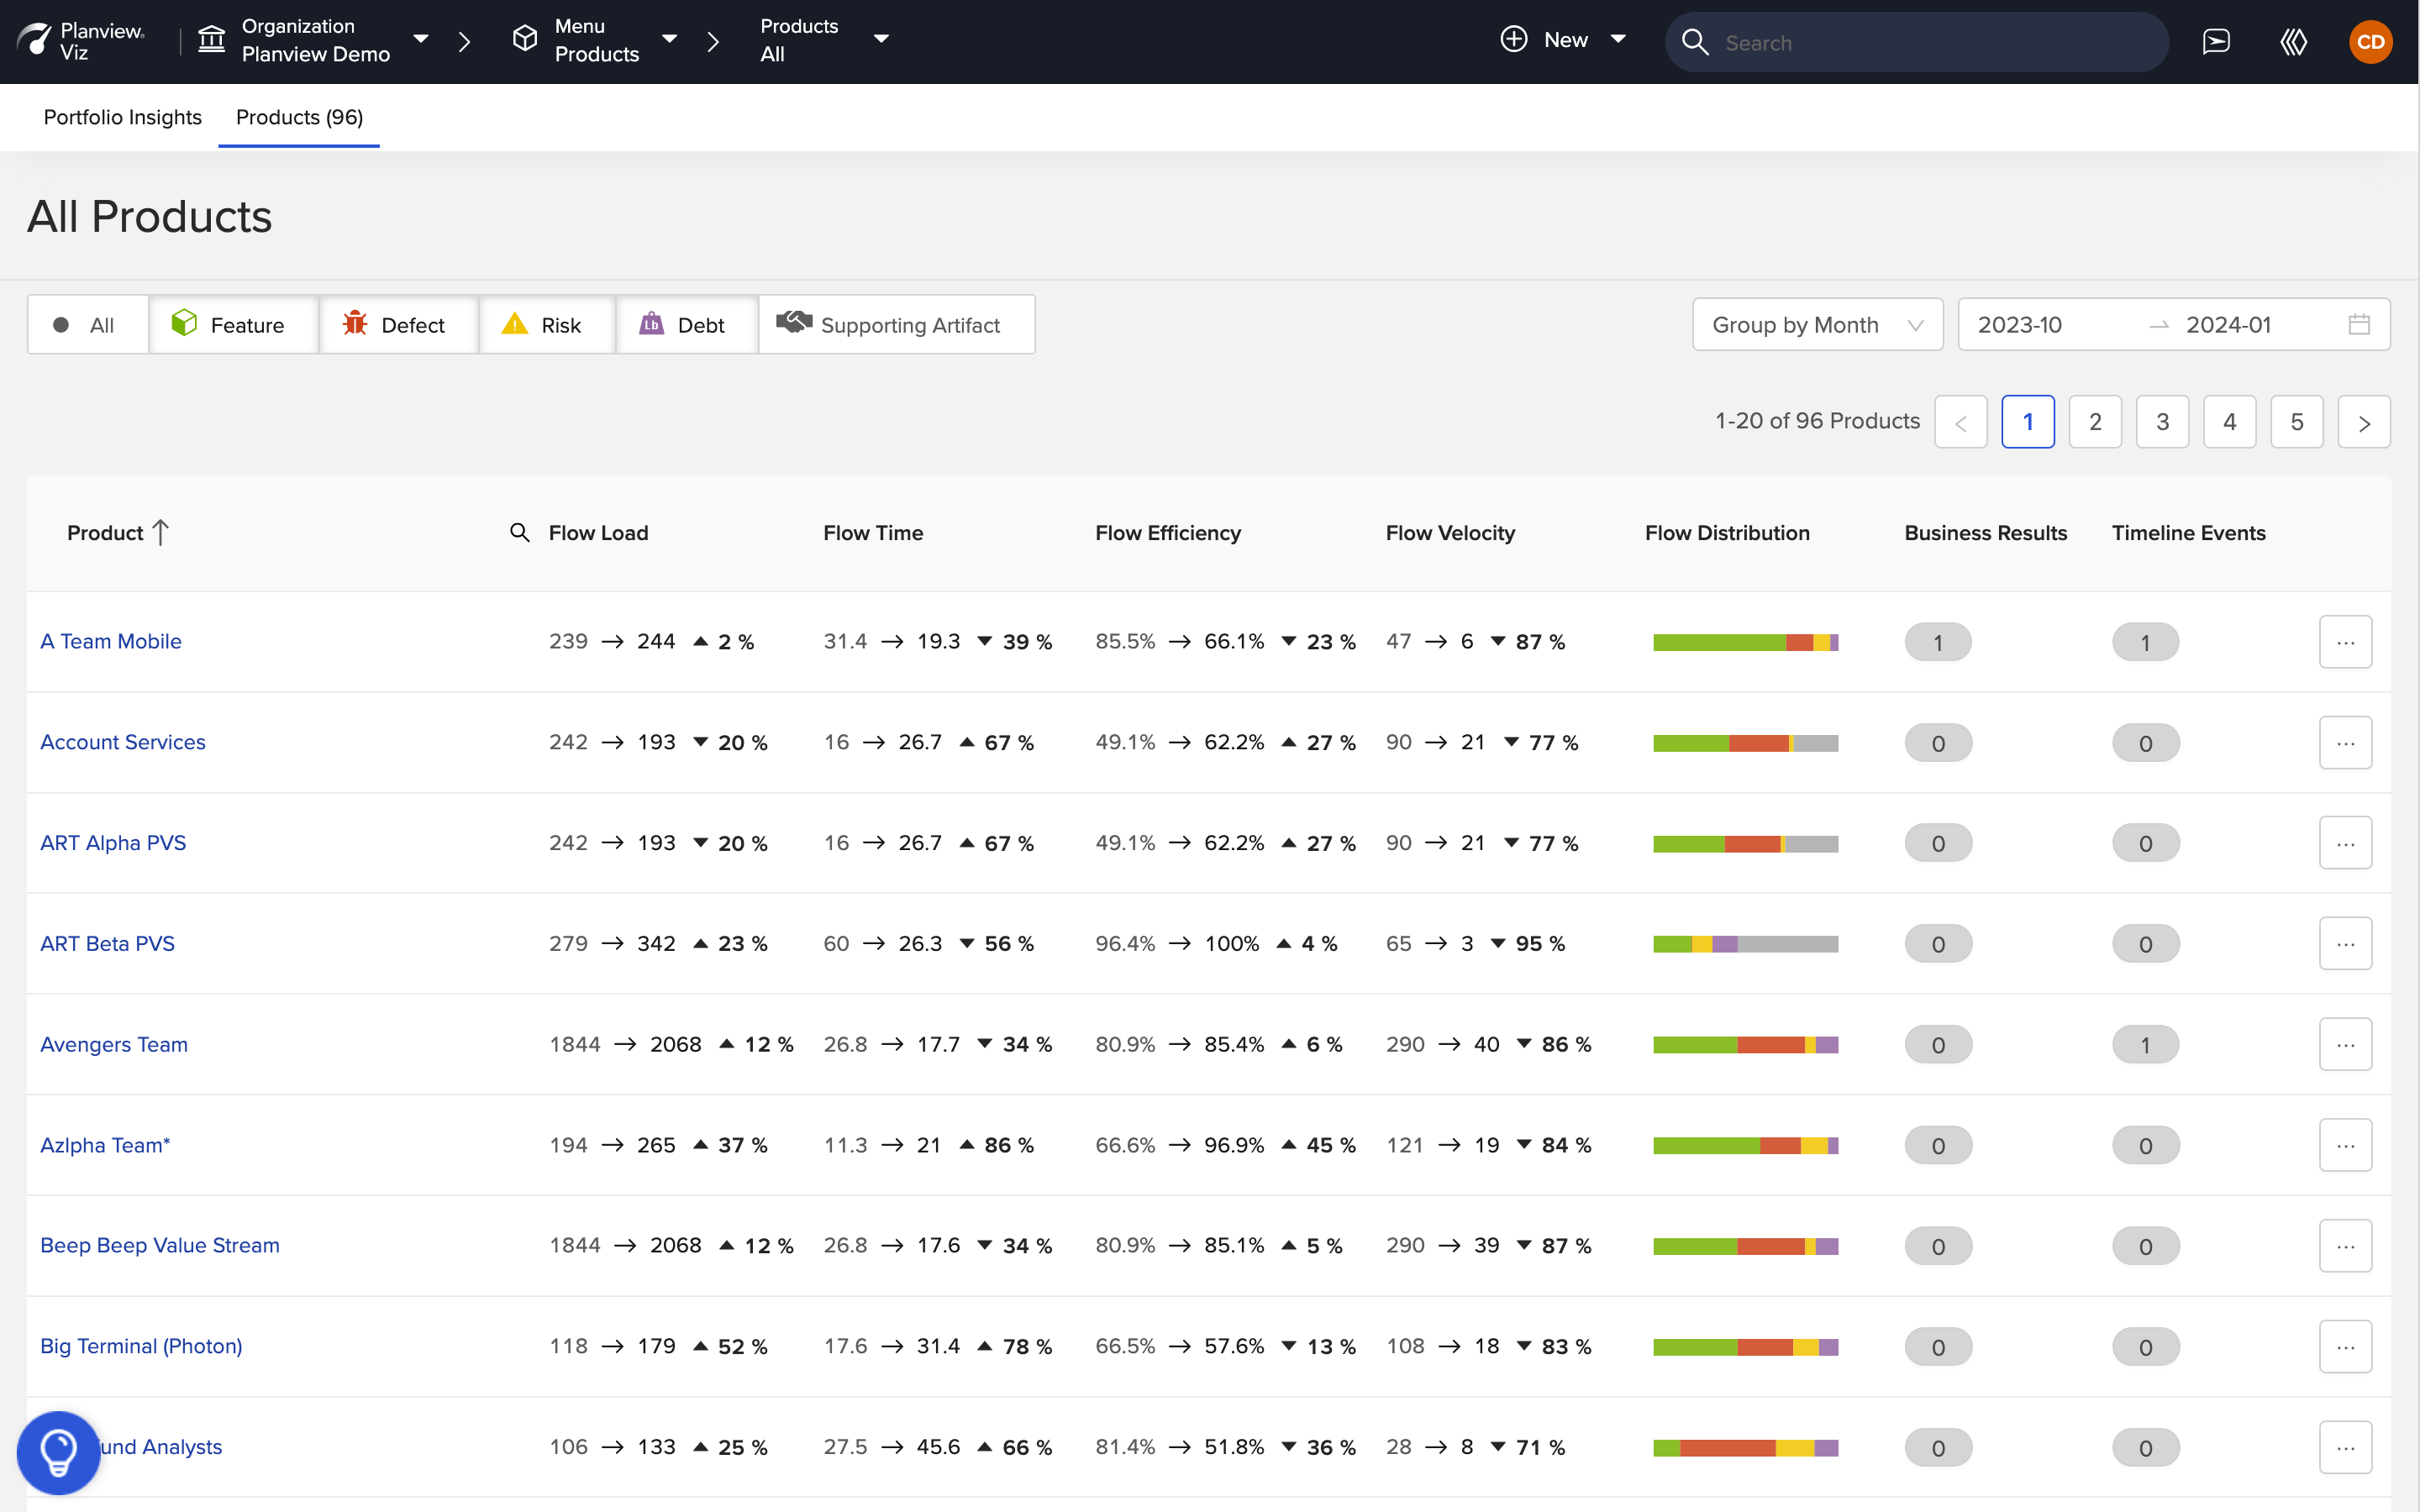
The date range for the Portfolio View will default to the range that most closely matches the range selected on your Flow Metrics dashboard.
If you’d like to customize your view, you can select a new range using the date picker.
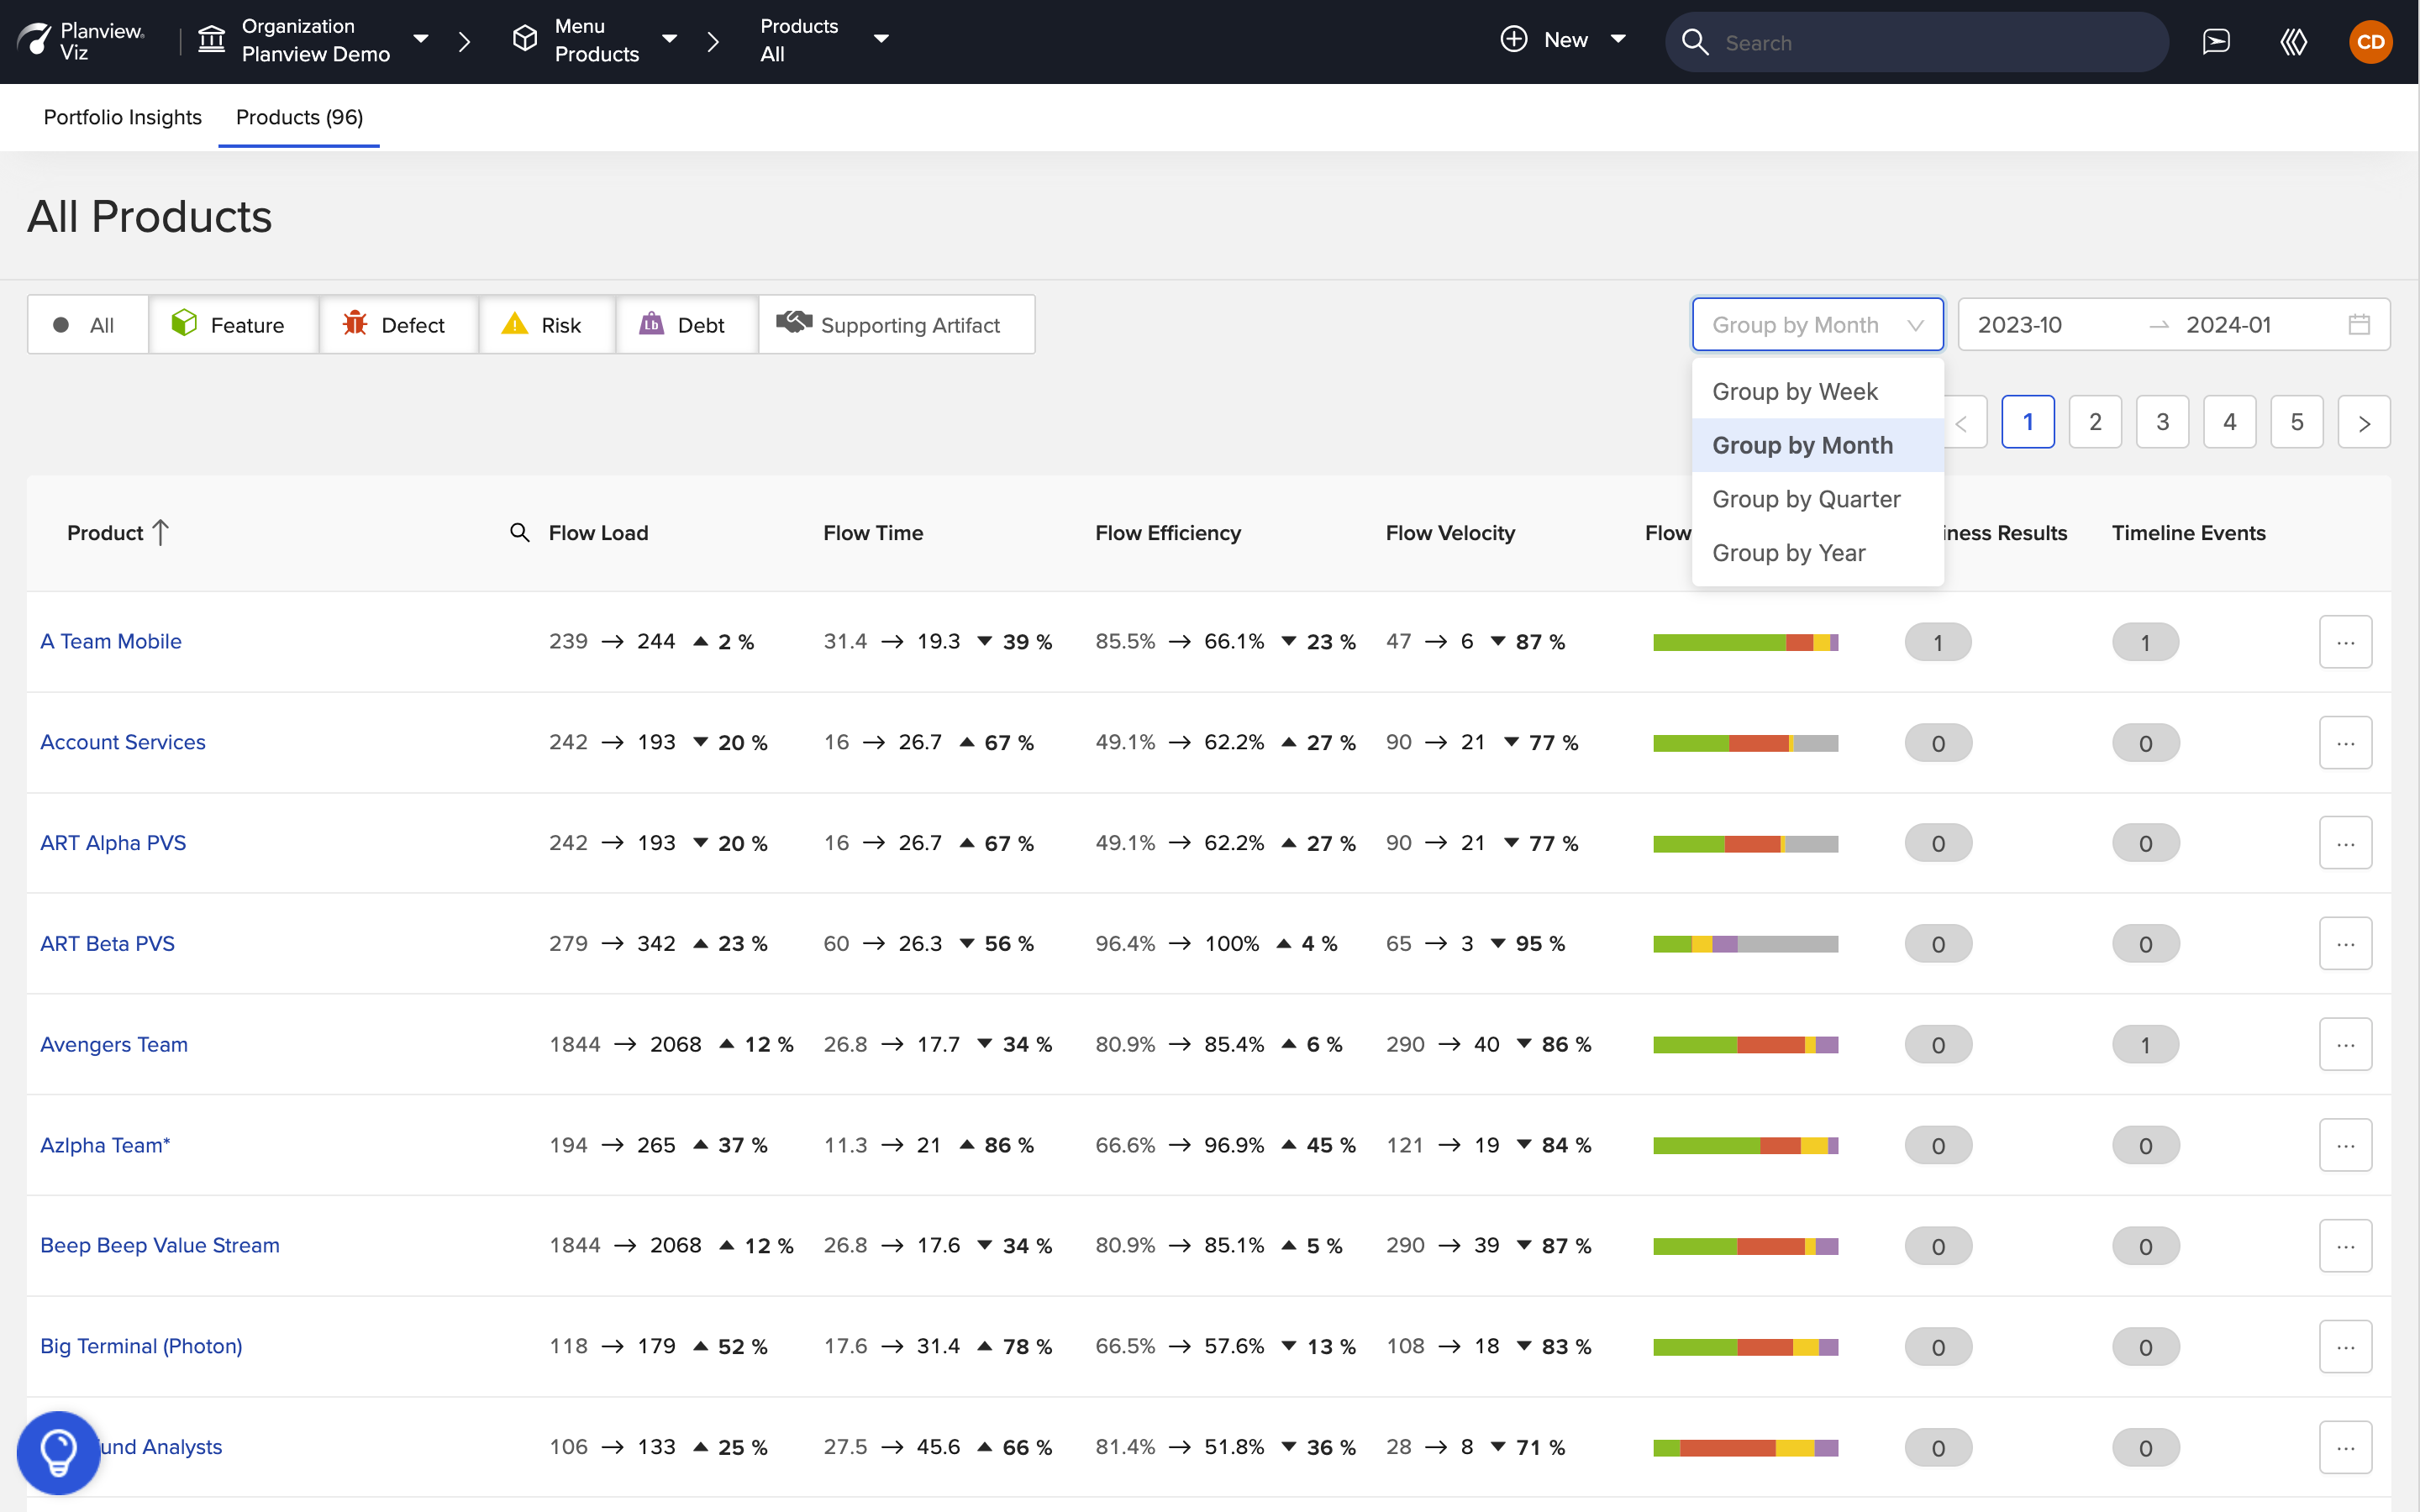
To do this, select a period to group by in the dropdown and then select a range.
Note: Viz will not allow you to select a partial period (i.e., A full week must be selected if grouping by week, a full month must be selected if grouping by month, etc).

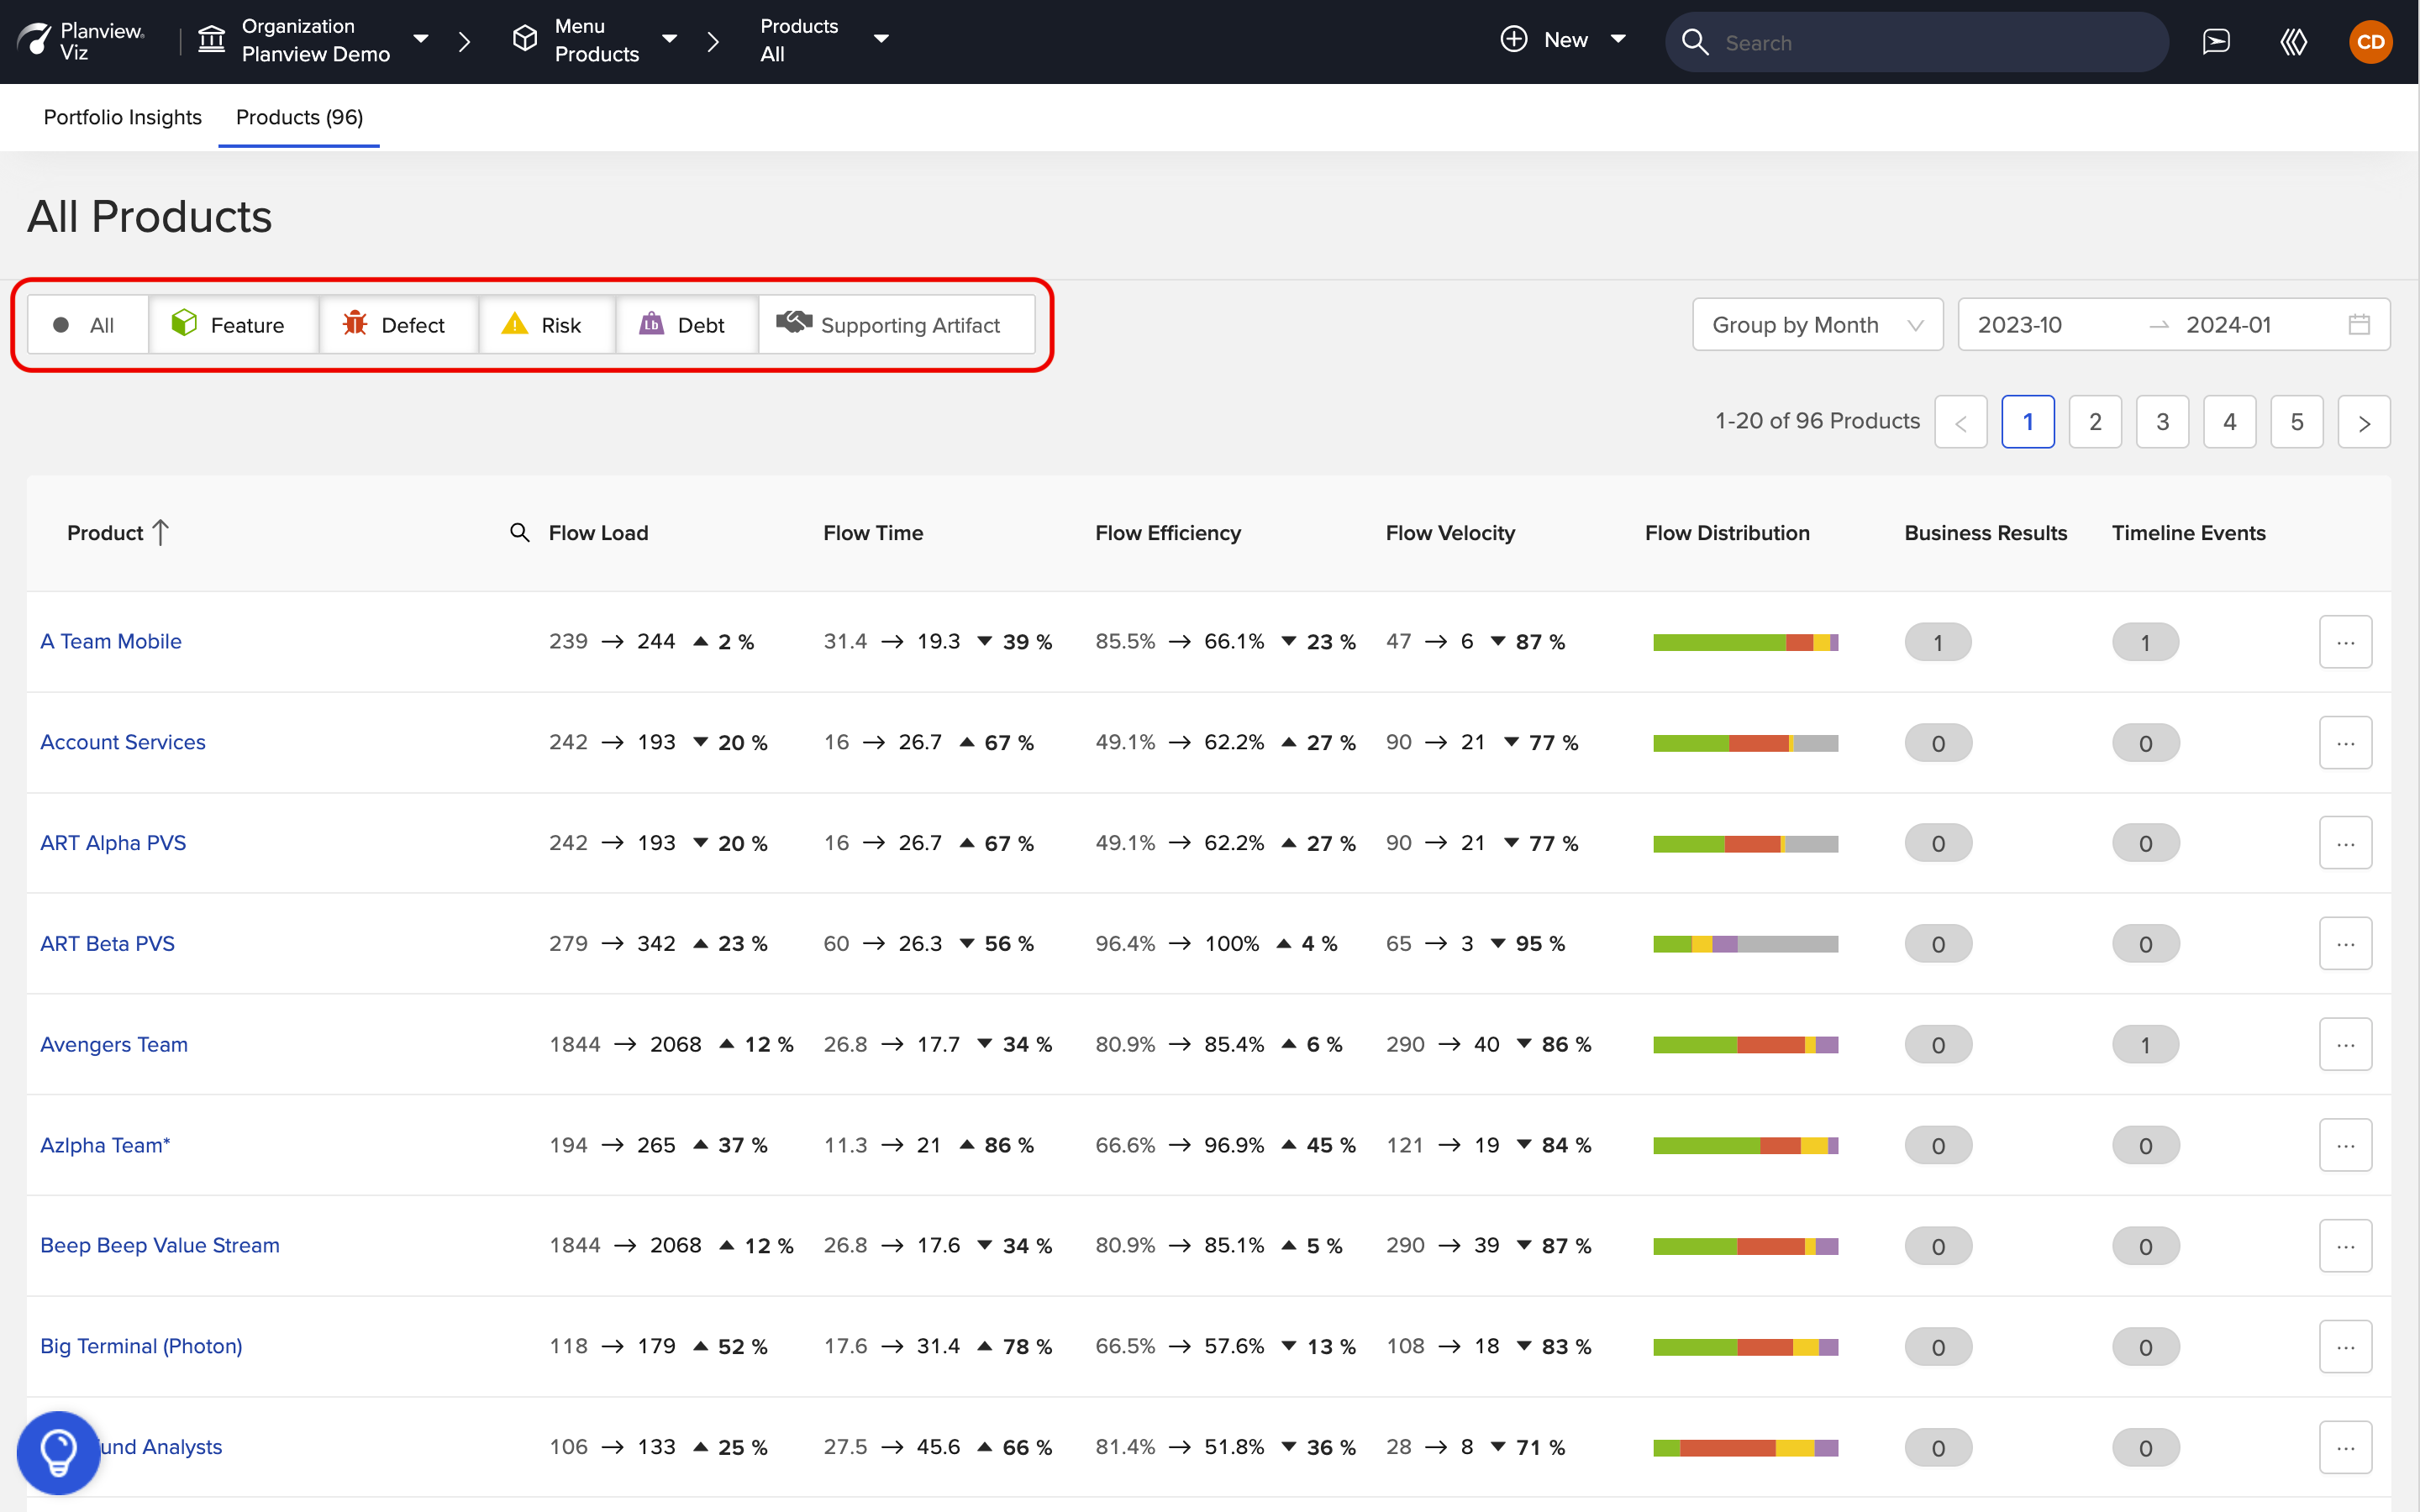
If you’d like to only include certain flow items in your Portfolio View, you can use the flow item type filter. This filter allows you to select one or more flow item types for your Portfolio View.
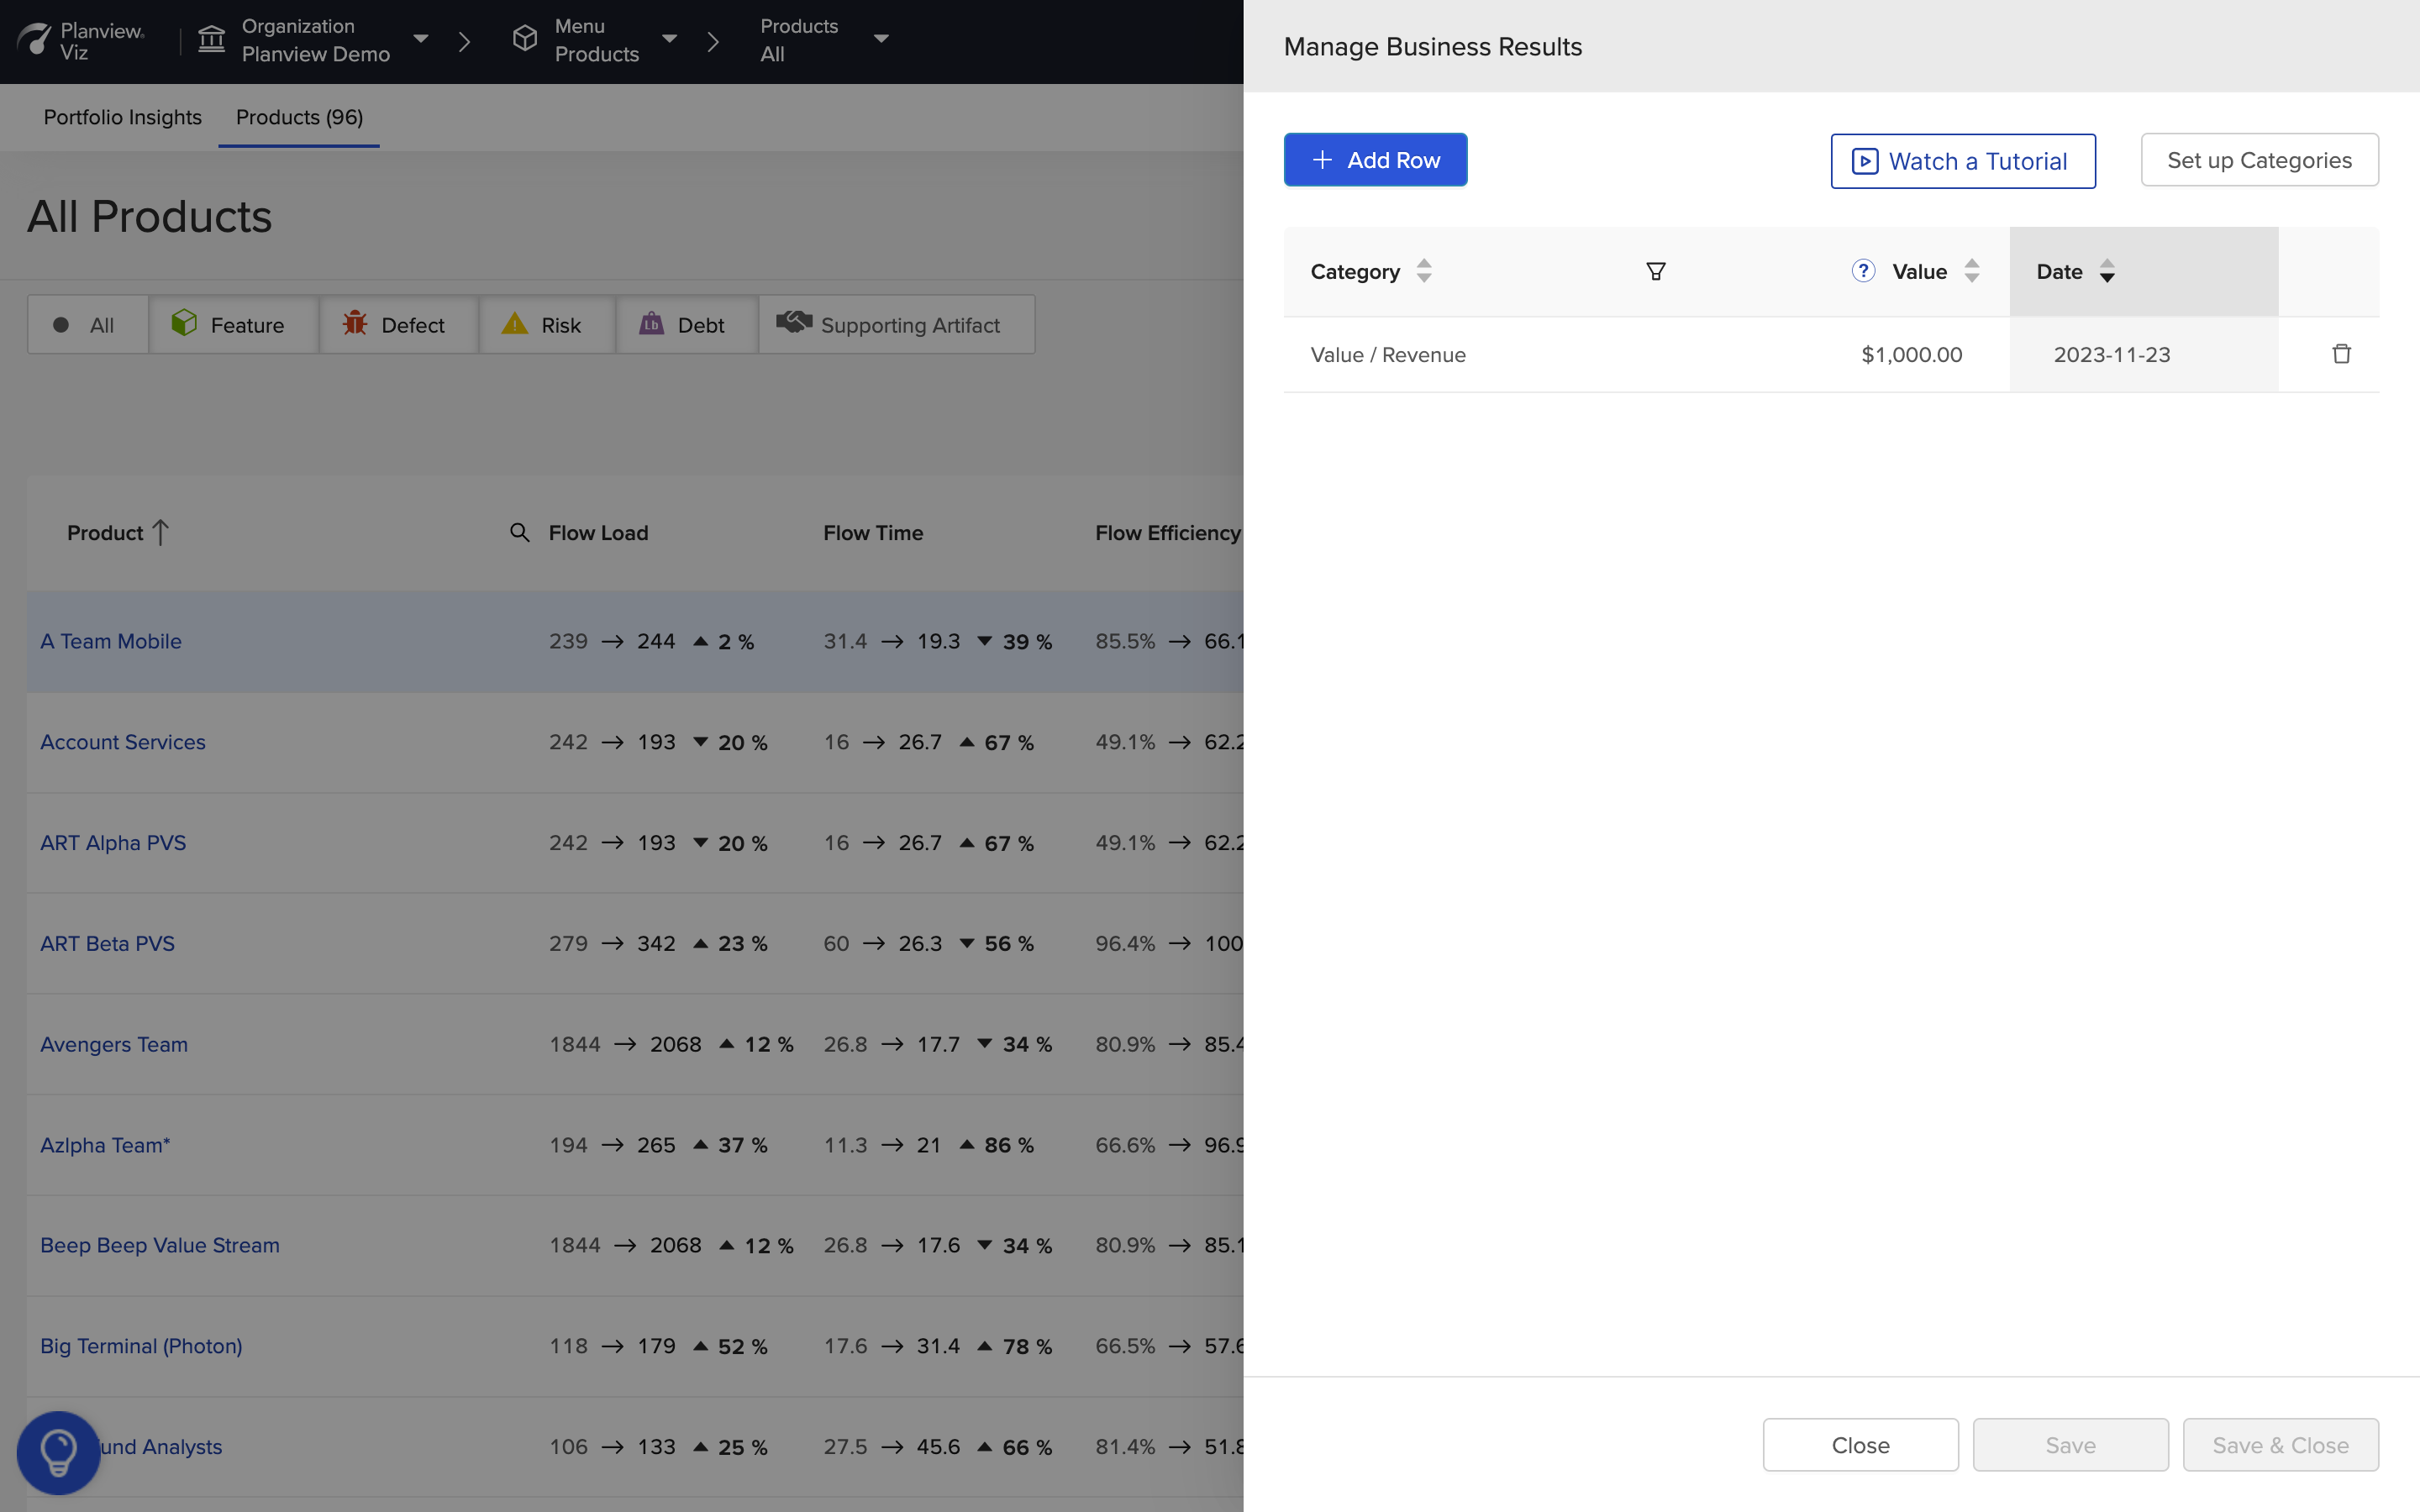
You can also conveniently analyze and manage Business Results and Timeline Events directly from this view — giving you context to the drivers behind changes to your Flow Metrics.
Simply click the Business Result or Timeline Event value to see the events or results associated with an individual product.