
Portfolio Insights
Introduction
With Portfolio Insights, data is rolled up from individual products in the groups you manage to present consolidated insights into the performance, quality, and value of your delivery.
This dashboard is the go-to view for executives and senior leaders to work with their direct reports on their progress towards business goals and continuous improvement.
The Portfolio Insights dashboard features three cards:
- Measuring your Shift from Project to Product: The insights here provide visibility into the progress of your organization's shift from project to product-based IT and identify how your organization is executing against plans.
- Improve your Product Management Discipline: The insights here identify product managers that tie roadmap, tradeoffs, and prioritization to high-level business imperatives and those that need help developing those skills.
- Improve Business Agility & Market Response: The insights here analyze the relationship between speed, throughput, and load to identify lurking problems undermining your Agile transformation.
- Improve Time-to-Market: The insights here highlight products and flow items whose Flow Times deviate from standard values, suggesting potential risks delaying time to value.
Portfolio insights are generated for each Portfolio and Sub-Portfolio, or for all Products.

To access your portfolio insights, select a Portfolio from the navigator or click All Portfolios & Products to view portfolio insights for all products.

Note: Portfolio insights will not appear if your group contains more than 200 products. To view Portfolio Insights, select a group of less than 200 products.
Click See Details to see which product teams are doing well and who could use more help.

The portfolio insights drill-in shows you the health of your product value streams — informing IT leaders who are the best performing product teams and which teams need more support.

You can always learn about an insight by clicking the help badge in Viz.

Measuring your Shift from Project to Product
The insights here provide visibility into the progress of your organization's shift from project to product-based IT and identify how your organization is executing against plans.

Generating Flow Metrics
For IT leaders overseeing the shift from project to product, it’s crucial to know which product teams are measuring business value flow; which product teams are tracking and communicating the value and impact of IT on the business; and which product teams are actually taking action to improve their flow and deliver more tangible value.

Why does this matter?
This insight informs leaders which products are measuring the flow of business value through their end-to-end value streams, and which products still haven’t taken that first step.
Which products qualify as generating Flow Metrics?
- Product has modeled at least one Flow Item
- Product has modeled at least one active or waiting Flow State
- Viz has successfully retrieved data in the last 30 days
This insight looks at all the products defined in this group or portfolio with work in progress in the last 30 days.
Tracking Business Results
While Flow Metrics measure product or service value delivery, tracking business results ensures that outcomes in terms of value, cost, quality and happiness are all being measured continuously and used as input to decision-making.
This insight informs leaders which product teams are working closely with their business partners to ensure they are delivering tangible business value, and which products still need help with that.

Why does this matter?
This data helps leaders understand which products are prioritizing the right set of features to achieve business goals.
Which products qualify as tracking business results?
Any product in this group or portfolio with at least one business result added with a date in the last 30 days qualifies as tracking business results.
Tracking Timeline Events
Product teams should be taking action to improve their flow and deliver more tangible value. Timeline events allow them to mark their improvement initiatives on their metric timelines to gauge and assess their impact.

Why does this matter?
This insight informs leaders which products are actively taking action to improve their flow and focus on high-value business initiatives, and which products still need help with that.
Which products qualify as tracking timeline events?
Any products in this group or portfolio with at least one timeline event added with a date in the last 30 days qualifies as tracking timeline events.
Improve your Product Management Discipline
These insights draw attention to products that may be struggling to achieve healthy Flow Distribution® and alert you to potentially inadequate investment in features, defects, debts and risks.
A product’s individual Flow Distribution® is naturally impacted by its lifecycle stage and should be considered in context (click See Details for individual product data). As a general rule, product teams should maximize the delivery of features, while maintaining a necessary and healthy mix of other flow items. Product Managers should be able to tie Flow Distribution® — with its tradeoffs and prioritization decisions — to high level business imperatives regardless of lifecycle stage.
These insights point to products where Flow Distribution® is beneath some minimal thresholds and worthy of further investigation, while also highlighting products doing well. Insights allow leadership to focus on the areas which require a deeper look because they fall outside of expected norms for products to remain healthy and competitive in the marketplace.

Low Feature Delivery
This insight sheds light on products that are below the 30% minimum threshold of feature distribution. Generally speaking, because new product capabilities drive business growth, feature distribution should far exceed this threshold, especially for innovation engines, but can be lower for products in the saturation or decline stage.

Why does this matter?
This insight helps leaders understand which products are struggling to prioritize features over other flow items for an extended period of time, indicating a slow-down in the new product capabilities necessary to drive business growth.
Which products qualify as low feature delivery?
Any product in this group or portfolio with less than 30% feature distribution in the last 30 days qualifies as low feature delivery and should be addressed. This indicates that less than one third of their investment is in providing new capabilities to their customers.
Any product with more than 30% feature distribution in the last 30 days is above the minimal threshold to trigger this alert, but should continue to aspire to a much higher feature distribution, while devoting sufficient attention to defect, debt and risk.
High Defect Delivery
This insight brings IT leaders’ attention to product value streams whose defect distribution is above 30%, indicating a significant amount of their delivery is focused on addressing product quality issues. Dealing with too many defects usually comes at the expense of Feature work, and in some cases may stem from too much accumulated debt.

Why does this matter?
This data helps leaders understand which products are choked by product quality issues, resulting in defects and production incidents dominating delivery.
Which products qualify as high defect delivery?
Any product in this group or portfolio with more than 30% defect distribution in the last 30 days qualifies as high defect delivery. Spending almost one third of product capacity on defects for a long period of time merits a closer look and discussion into the contributing factors.
Any product with less than 30% defect distribution in the last 30 days does not require immediate attention.
Neglecting Risk
This insight draws attention to products whose risk distribution is below the minimum threshold of 5%. Risk flow items include security and compliance-related work that protects the business from fines and breaches. Products neglecting risk are devoting less than 5% of their delivery to this important work.
Note that 5% is a minimal investment in risk, given the increased usage of open-source and the increased sophistication of security attacks. As you invest more in technologies that perform security scans (both static and dynamic), you need to be able to quickly resolve the vulnerabilities they identify.

Why does this matter?
This data helps leaders understand which products are not prioritizing security and compliance work over other demands, increasing the business's exposure to fines and breaches and increasing the risk of losing customers.
Which products qualify as neglecting risk?
Any product in this group or portfolio with less than 5% Flow Distribution® for risk in the last 30 days qualifies as neglecting risk and should be addressed.
Any product in this group or portfolio with more than 5% Flow Distribution® for risk in the last 30 days does not require immediate attention.
Neglecting Debt
This insight highlights products whose debt distribution is below a minimum threshold of 5%. Debt flow items include work that helps maintain the current flow of value or improve it, like code refactoring, upgrading libraries, re-skilling or experimentation with new technology.
Debt work is an investment in improving the future flow of business value. To remain competitive, this area requires sufficient investment, even beyond this minimal threshold, as required by the market conditions, product positioning and lifecycle stage.

Why does this matter?
This data helps leaders understand which products are not devoting any time to decreasing technical debt or investing in improving tooling and processes, thus handicapping their ability to accelerate innovation in the long-run.
Which products qualify as neglecting debt?
Any product in this group or portfolio with less than 5% Flow Distribution® for debt in the last 30 days qualifies as neglecting debt and should be addressed.
Any product with more than 5% Flow Distribution® for debt in the last 30 days does not require immediate attention.
Improve Business Agility & Market Response
Agile transformations are a given at this point. But performing the ceremonies doesn’t guarantee faster value delivery or shorter feedback loops. These metrics help identify where product teams are doing Agile but not being Agile and where the ability to respond faster to the market is at risk.
These insights analyze the relationship between speed, throughput, and load to identify lurking problems currently undermining your Agile transformation.

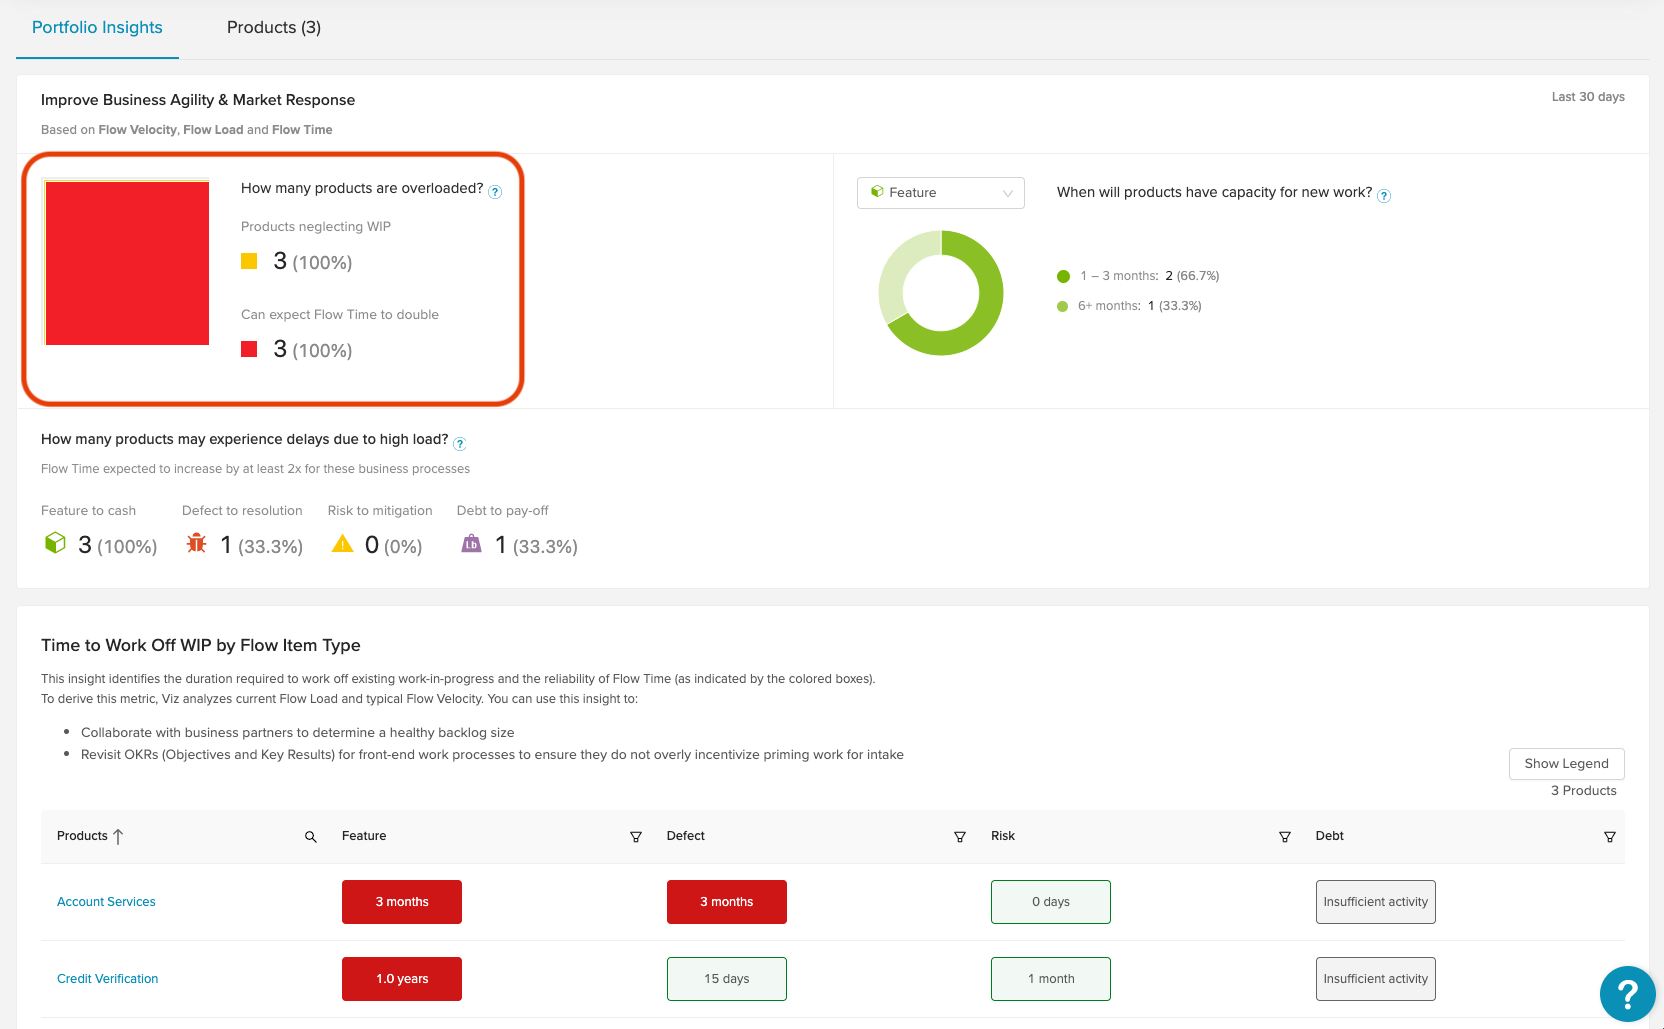
How many products are overloaded?
The higher the load on a value stream, the less it delivers — and the less Agile it becomes. When spread too thin over too much work in progress (WIP), the flow of value slows to a trickle.
This insight identifies which products are taking on more work than they can complete, causing work in progress to grow stale (Neglected WIP). For some products, WIP is aging so severely that Flow Times are predicted to at least double if all the WIP were completed.
Why does this matter?
This insight identifies when load has become so high that work in progress is aging. Only a small current of work is making it through the pipeline. Much of the work is growing stale and it’s likely commitments are being missed.
The best technology leaders help product teams balance demand vs. capacity by measuring actual resource capacity. Here are some things you can do to help:
- Confirm that your direct reports are implementing a pull mechanism for work intake and prevent the slip back to waterfall behaviors.
- Review OKRs and other incentives that may reward specific roles for overproducing to the detriment of overall flow.
- Coach product teams to focus on delivering complete units of value before taking on something new.
Which products qualify under this insight?
Based on data in the neglected WIP drawer, Viz analyzes average Flow Time and Flow Velocity® within the last 30 days alongside your current Flow Load® to produce these insights.
- Neglecting WIP: Any product in this group or portfolio with 25% or more neglected WIP for at least one flow item (feature, defect, debt or risk) qualifies as neglecting WIP.
- Flow Times expected to double: These are products whose neglected WIP is so severe (50% or higher), that if they were to complete all their WIP for a flow item, they could expect Flow Time to at least double.
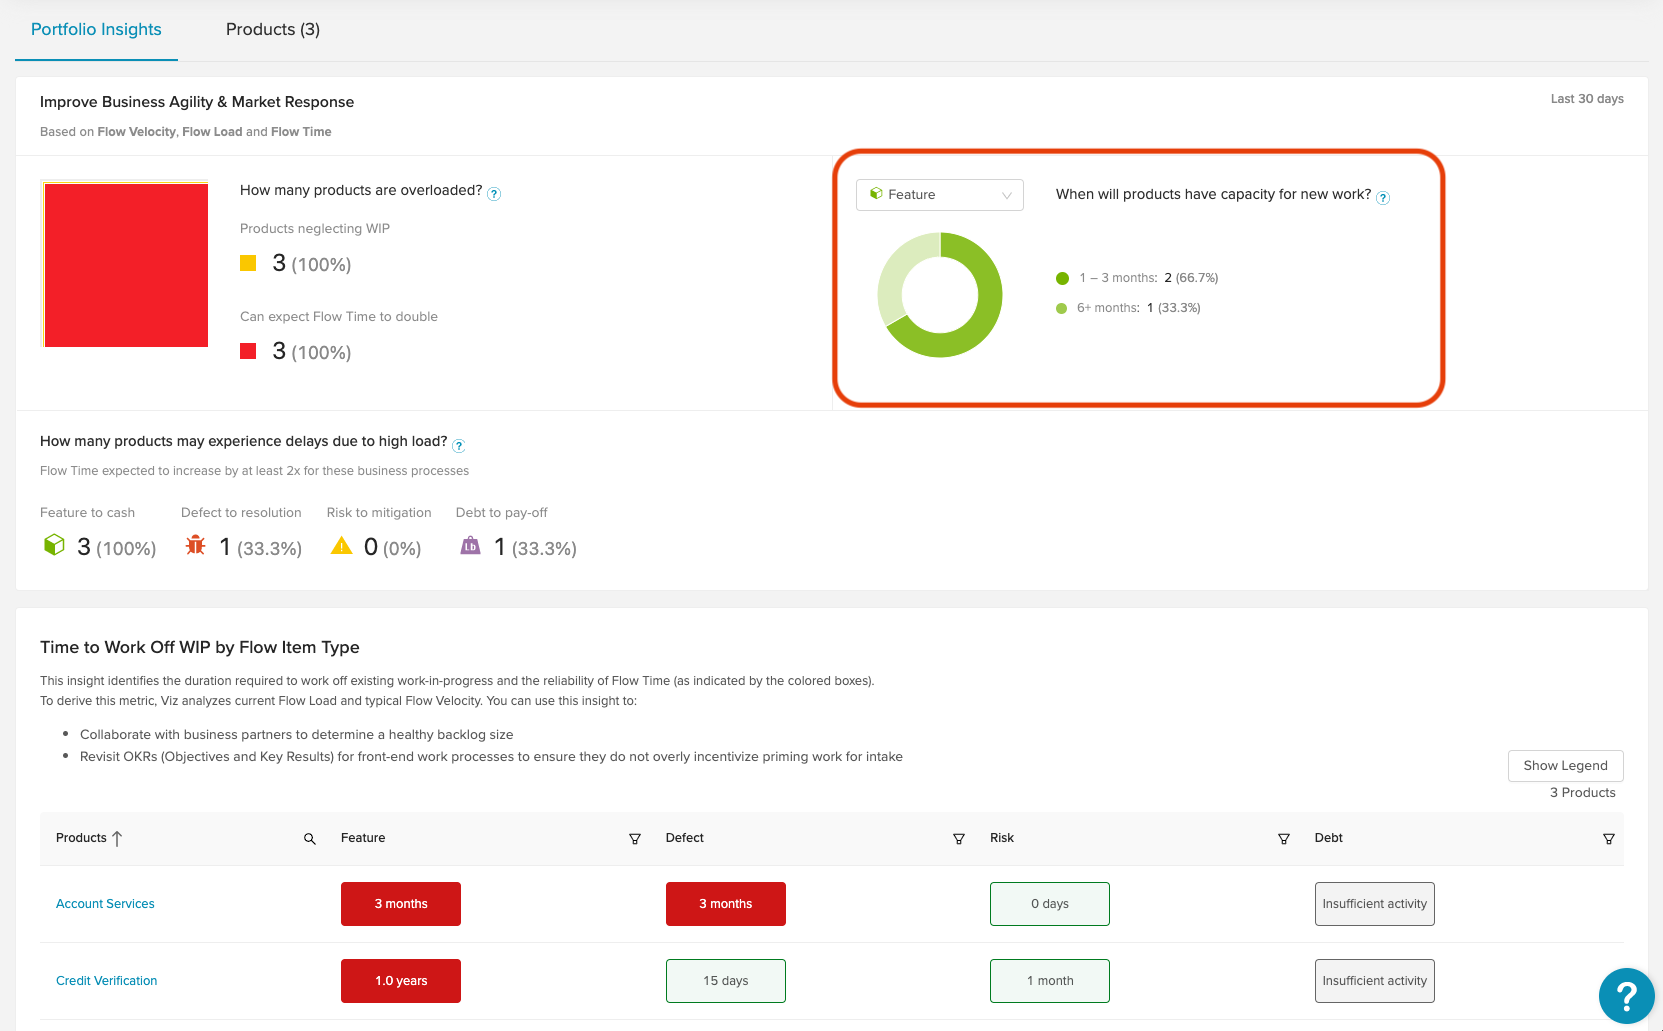
When will products have capacity for new work?
This insight identifies when products will realistically have capacity for new work, based on their current workloads. It is presented so you can prevent cases of untenable workloads and unrealistic commitments.
This insight can also be found at the individual product level in the neglected WIP drawer (i.e., How long to work off Flow Item type WIP?).
Why does this matter?
This insight calculates how long it will take until a value stream has capacity for new work and is a measure of how quickly a value stream can respond to the market. Ideally, the teams should have the ability to pivot quickly and not be burdened by many months’ worth of started work.
The best technology leaders help product teams balance demand vs. capacity by measuring actual resource capacity. Here are some things you can do to help:
- Encourage product value streams to review all the work in progress and understand why so much has been started but not finished.
- Review the processes for updating artifacts once value has been delivered (i.e., make sure people are stopping the clock).
- Coach product teams to focus on delivering complete units of value before taking on something new.
Which products qualify under this insight?
The categories here are generated dynamically based on the data available. For example, if one group of products has a range of 0-12 years, the categories shown will be illustrative of 0-12 years.
The Unknown category represents products that:
- Have not modeled the selected flow item type
- Have insufficient Flow Load®/Flow Velocity® data from the last 30 days
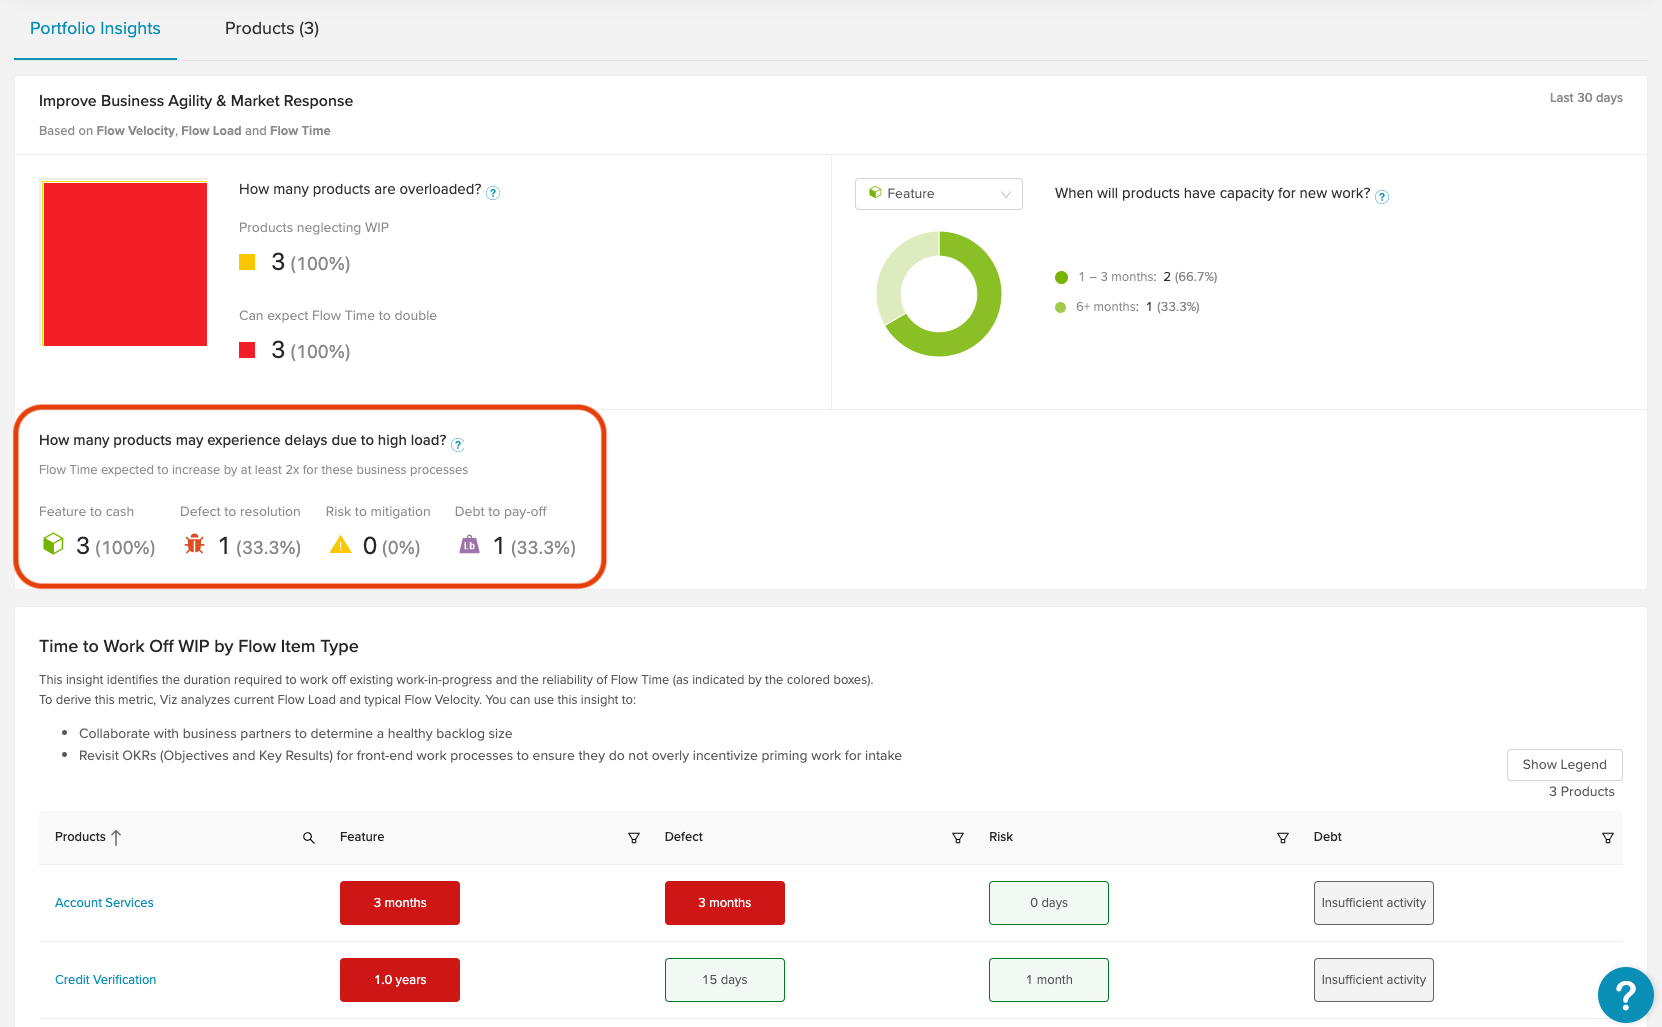
How many products may experience delays due to high load?
This insight highlights which value delivery processes are being impacted by neglected WIP and can anticipate longer Flow Times as a result: feature to cash, defect to resolution, risk to mitigation, or debt to pay-off.
Why does this matter?
This insight helps leaders better understand where agility is lacking and what type of future commitments will be impacted by overloaded teams.
Leaders should be concerned about all of these processes but may be particularly concerned about specific processes based on the organization’s focus. For example, in an organization highly concerned with cybersecurity at the moment, the risk to mitigation process may be of particular interest.
Which products qualify under this insight?
- Feature to cash: A product will appear here if Flow Time is expected to at least double for features.
- Defect to resolution: A product will appear here if Flow Time is expected to at least double for defects.
- Risk to mitigation: A product will appear here if Flow Time is expected to at least double for risks.
- Debt to pay-off: A product will appear here if Flow Time is expected to at least double for debt.
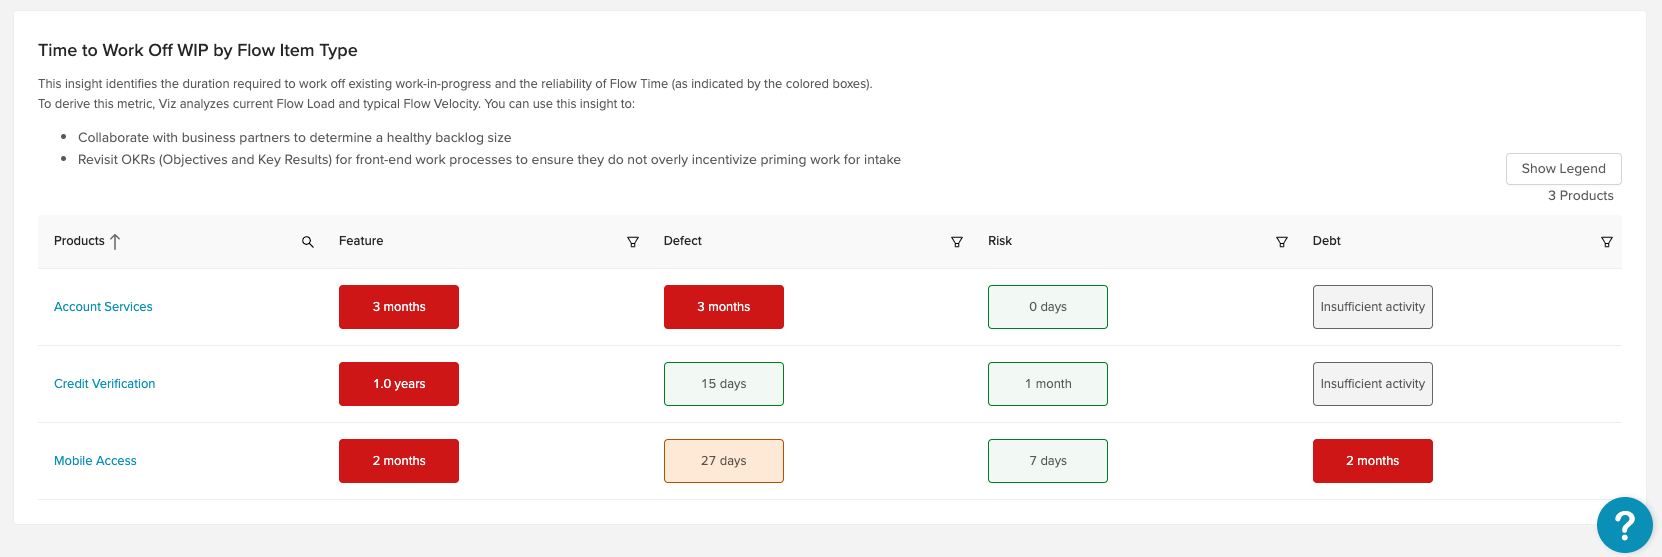
Time to Work Off WIP by Flow Item Type
This insight identifies the time required to work off existing work-in-progress and the reliability of Flow Time (as indicated by the colored boxes) by flow item types.
Why does this matter?
You can use this insight to:
- Collaborate with business partners to determine a healthy backlog size
- Revisit OKRs (Objectives and Key Results) for front-end work processes to ensure they do not overly incentivize priming work for intake
Which products qualify under this insight?
To derive this metric, Viz analyzes current Flow Load® and average Flow Velocity® for the last 30 days for the flow items in this portfolio.
Improve Time-to-Market
Every second matters in software delivery. One of the most challenging issues facing IT and business leaders is structuring teams and technology to maximize flow and minimize delays due to dependencies. That's why Flow Time is so important.
These insights highlight products and flow items whose Flow Times deviate from standard values, suggesting potential risks delaying time-to-value.
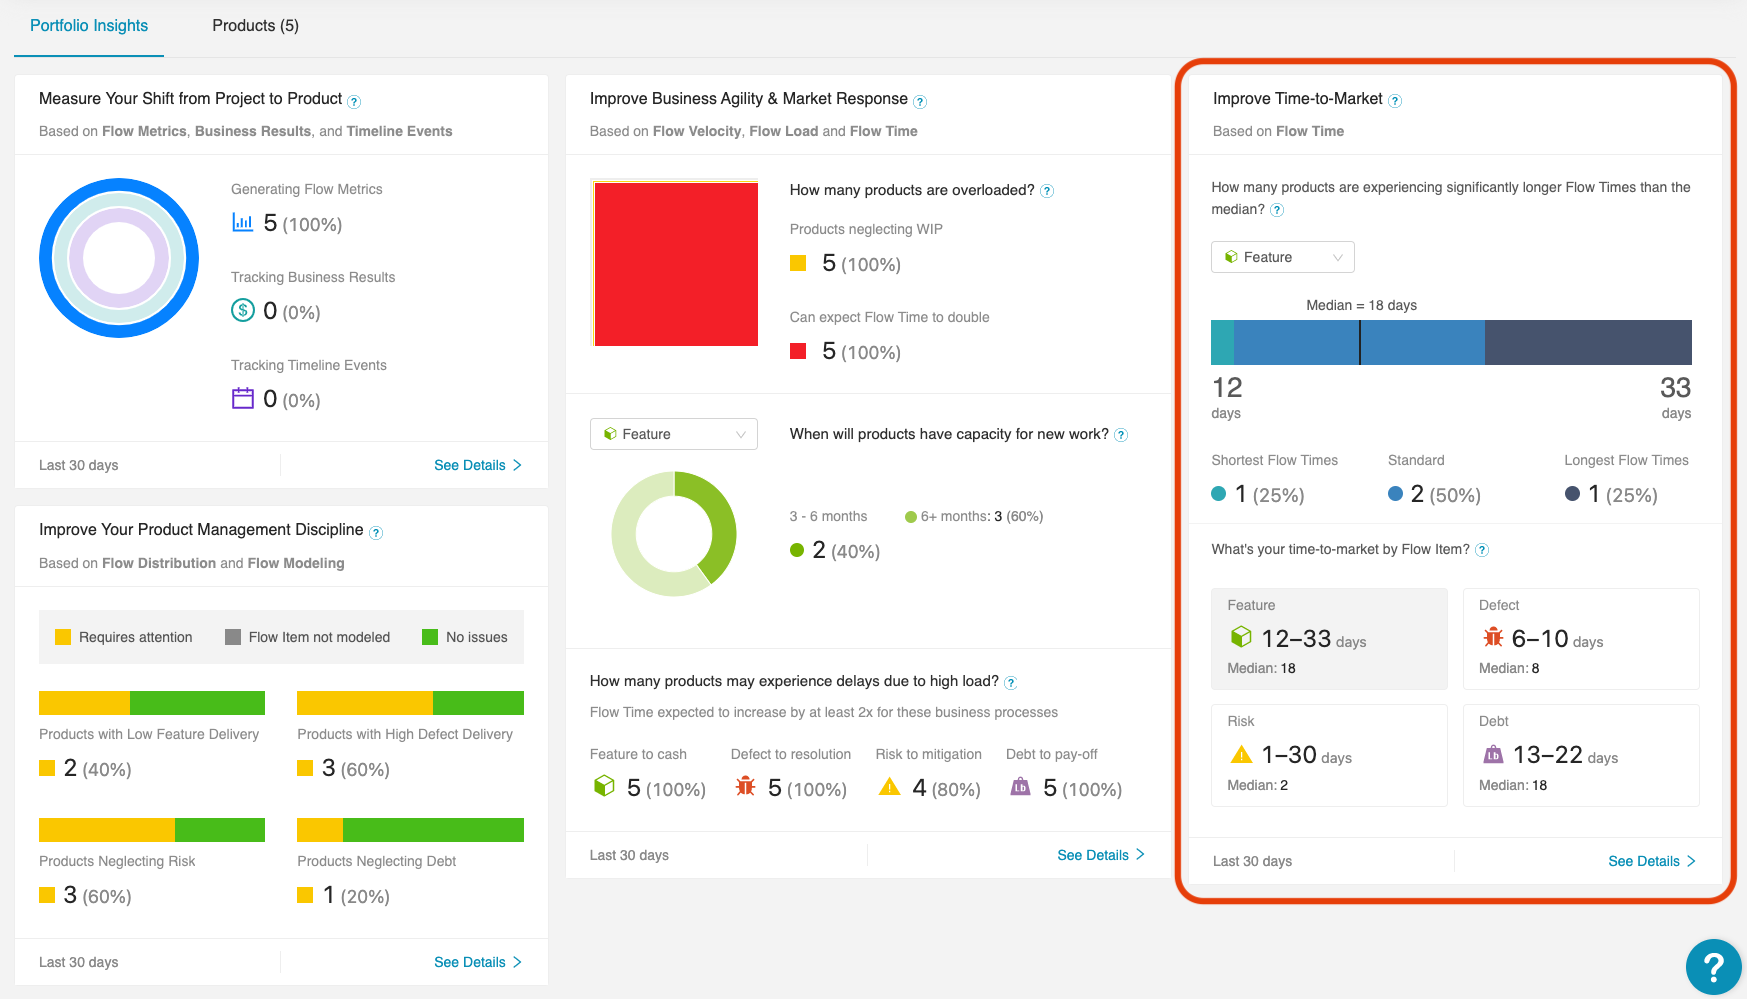
How many products are experiencing significantly longer Flow Times than the median?
This insight highlights products whose Flow Times deviate from the normal range, which can indicate potential delay in your time to value.
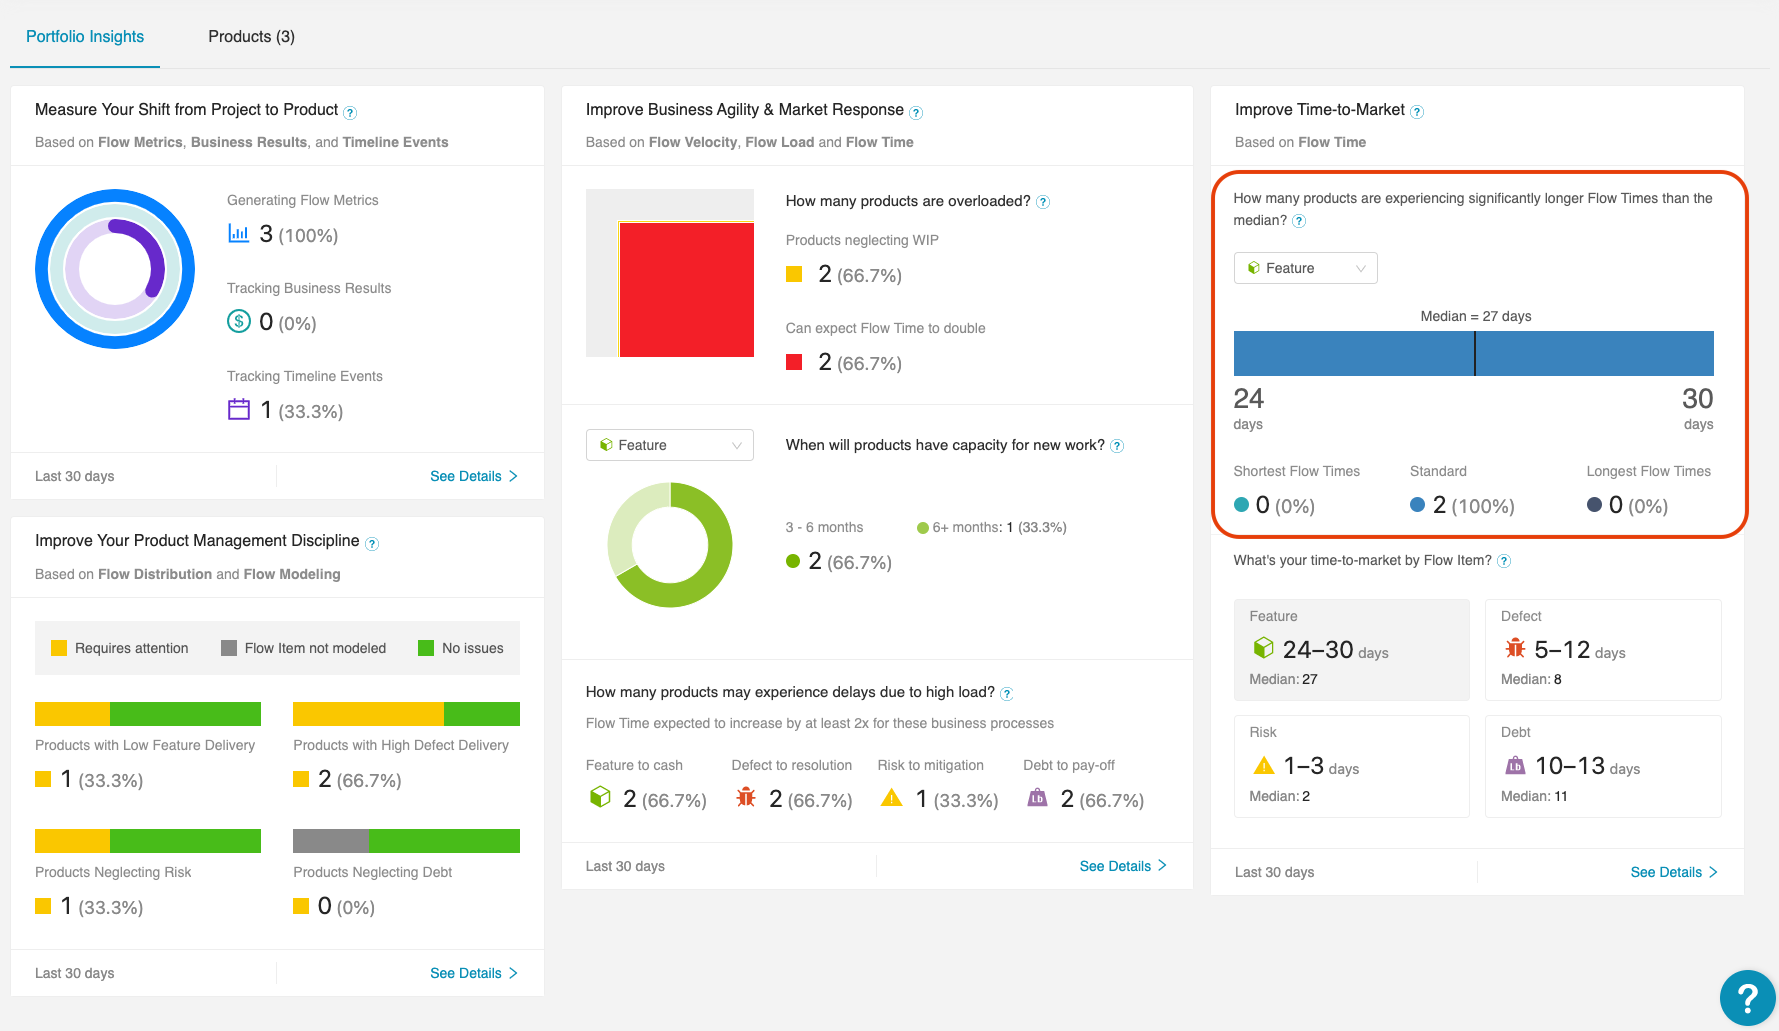
Why does this matter?
This data helps leaders understand which products are experiencing unusually long Flow Times so they can quickly determine areas for improvement. It pinpoints the fastest and slowest moving products within a portfolio, so you can address dependencies, for example, by shifting resources strategically to products with the longest Flow Times. And you can learn what is going right (and why) for products with the shortest Flow Times.
Which products qualify under this insight?
To derive this metric, Viz collects Flow Times from the products in this portfolio for the last 30 days and uses median absolute deviation (MAD) to determine which products deviate from standard values.
Because MAD is not skewed by outliers, it provides a more accurate representation of typical Flow Times.
What's your time-to-market by Flow Item?
This insight highlights the median Flow Time for each flow item—features, defects, risk and debt—as well as the range observed in the products in this portfolio. This helps you identify outliers that may impact the performance of the portfolio as a whole, given there are often dependencies within a portfolio or simply best practices you want to adhere to throughout the portfolio.
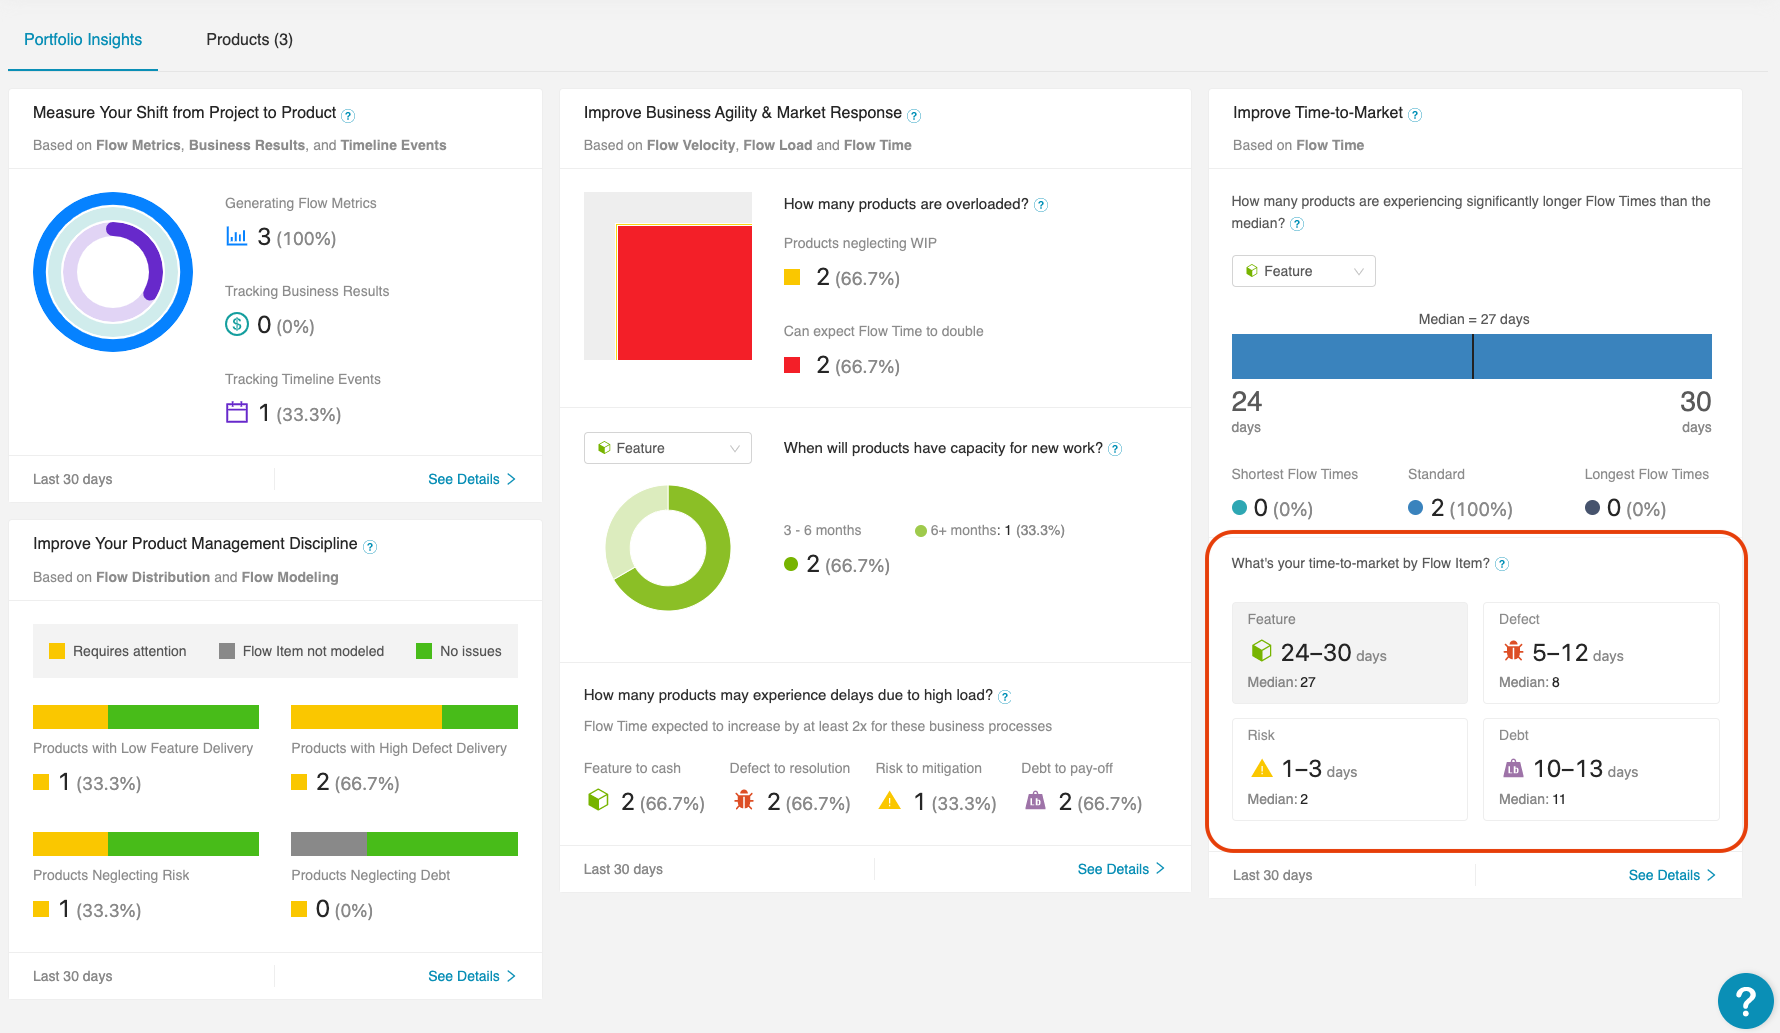
Why does this matter?
Having granular data lets you surface and investigate the constraints that may be impacting your time-to-market for individual flow items.
Some examples of data-led actions you could take might include:
- Creating Flow Time goals for each Flow Item to ensure all four types of flow items are completed within a defined time frame. This helps ensure that production incidents (i.e., defects) are not the only flow item handled expeditiously.
- Encouraging teams responsible for the product value streams to review all the work in progress to understand why Flow Times might fall outside of the normal range.
- Identifying where you can make tradeoffs or shift resources to improve Flow Times for specific flow items.
How is this metric generated?
To derive this metric, Viz collects Flow Times from the flow items in this portfolio for the last 30 days and uses median absolute deviation (MAD) to determine which flow items deviate from standard values.
Because MAD is not skewed by outliers, it provides a more accurate representation of typical Flow Times.