
Business Results
Introduction
Flow Metrics alone do not help an organization accelerate value delivery. Flow Metrics must be evaluated against business results, the desired outcomes of all of the investment. Each value stream is likely to have different desired business outcomes.
There are four categories of business results:
- Value
- Cost
- Quality
- Happiness
Based on the combined view of Flow Metrics and business results, you can calibrate your value stream accordingly — for example, allocate more resources, set priorities, change workflows or modify tooling, until you achieve the desired correlation between Flow Metrics and Business Results.
Getting Started with Business Results
To add a business result to your value stream, click Manage in the Business Results section of your Flow Metrics dashboard.

Select a category, value, and date for your business result.

To customize your business results, click Set up Categories to create custom categories for your business results. A custom category can be used to track metrics not covered by one of our pre-configured categories, like monthly infrastructure cost or monthly policies sold.

Click Save to save your changes.

After saving your business results, they will appear on your Flow Metrics dashboard.
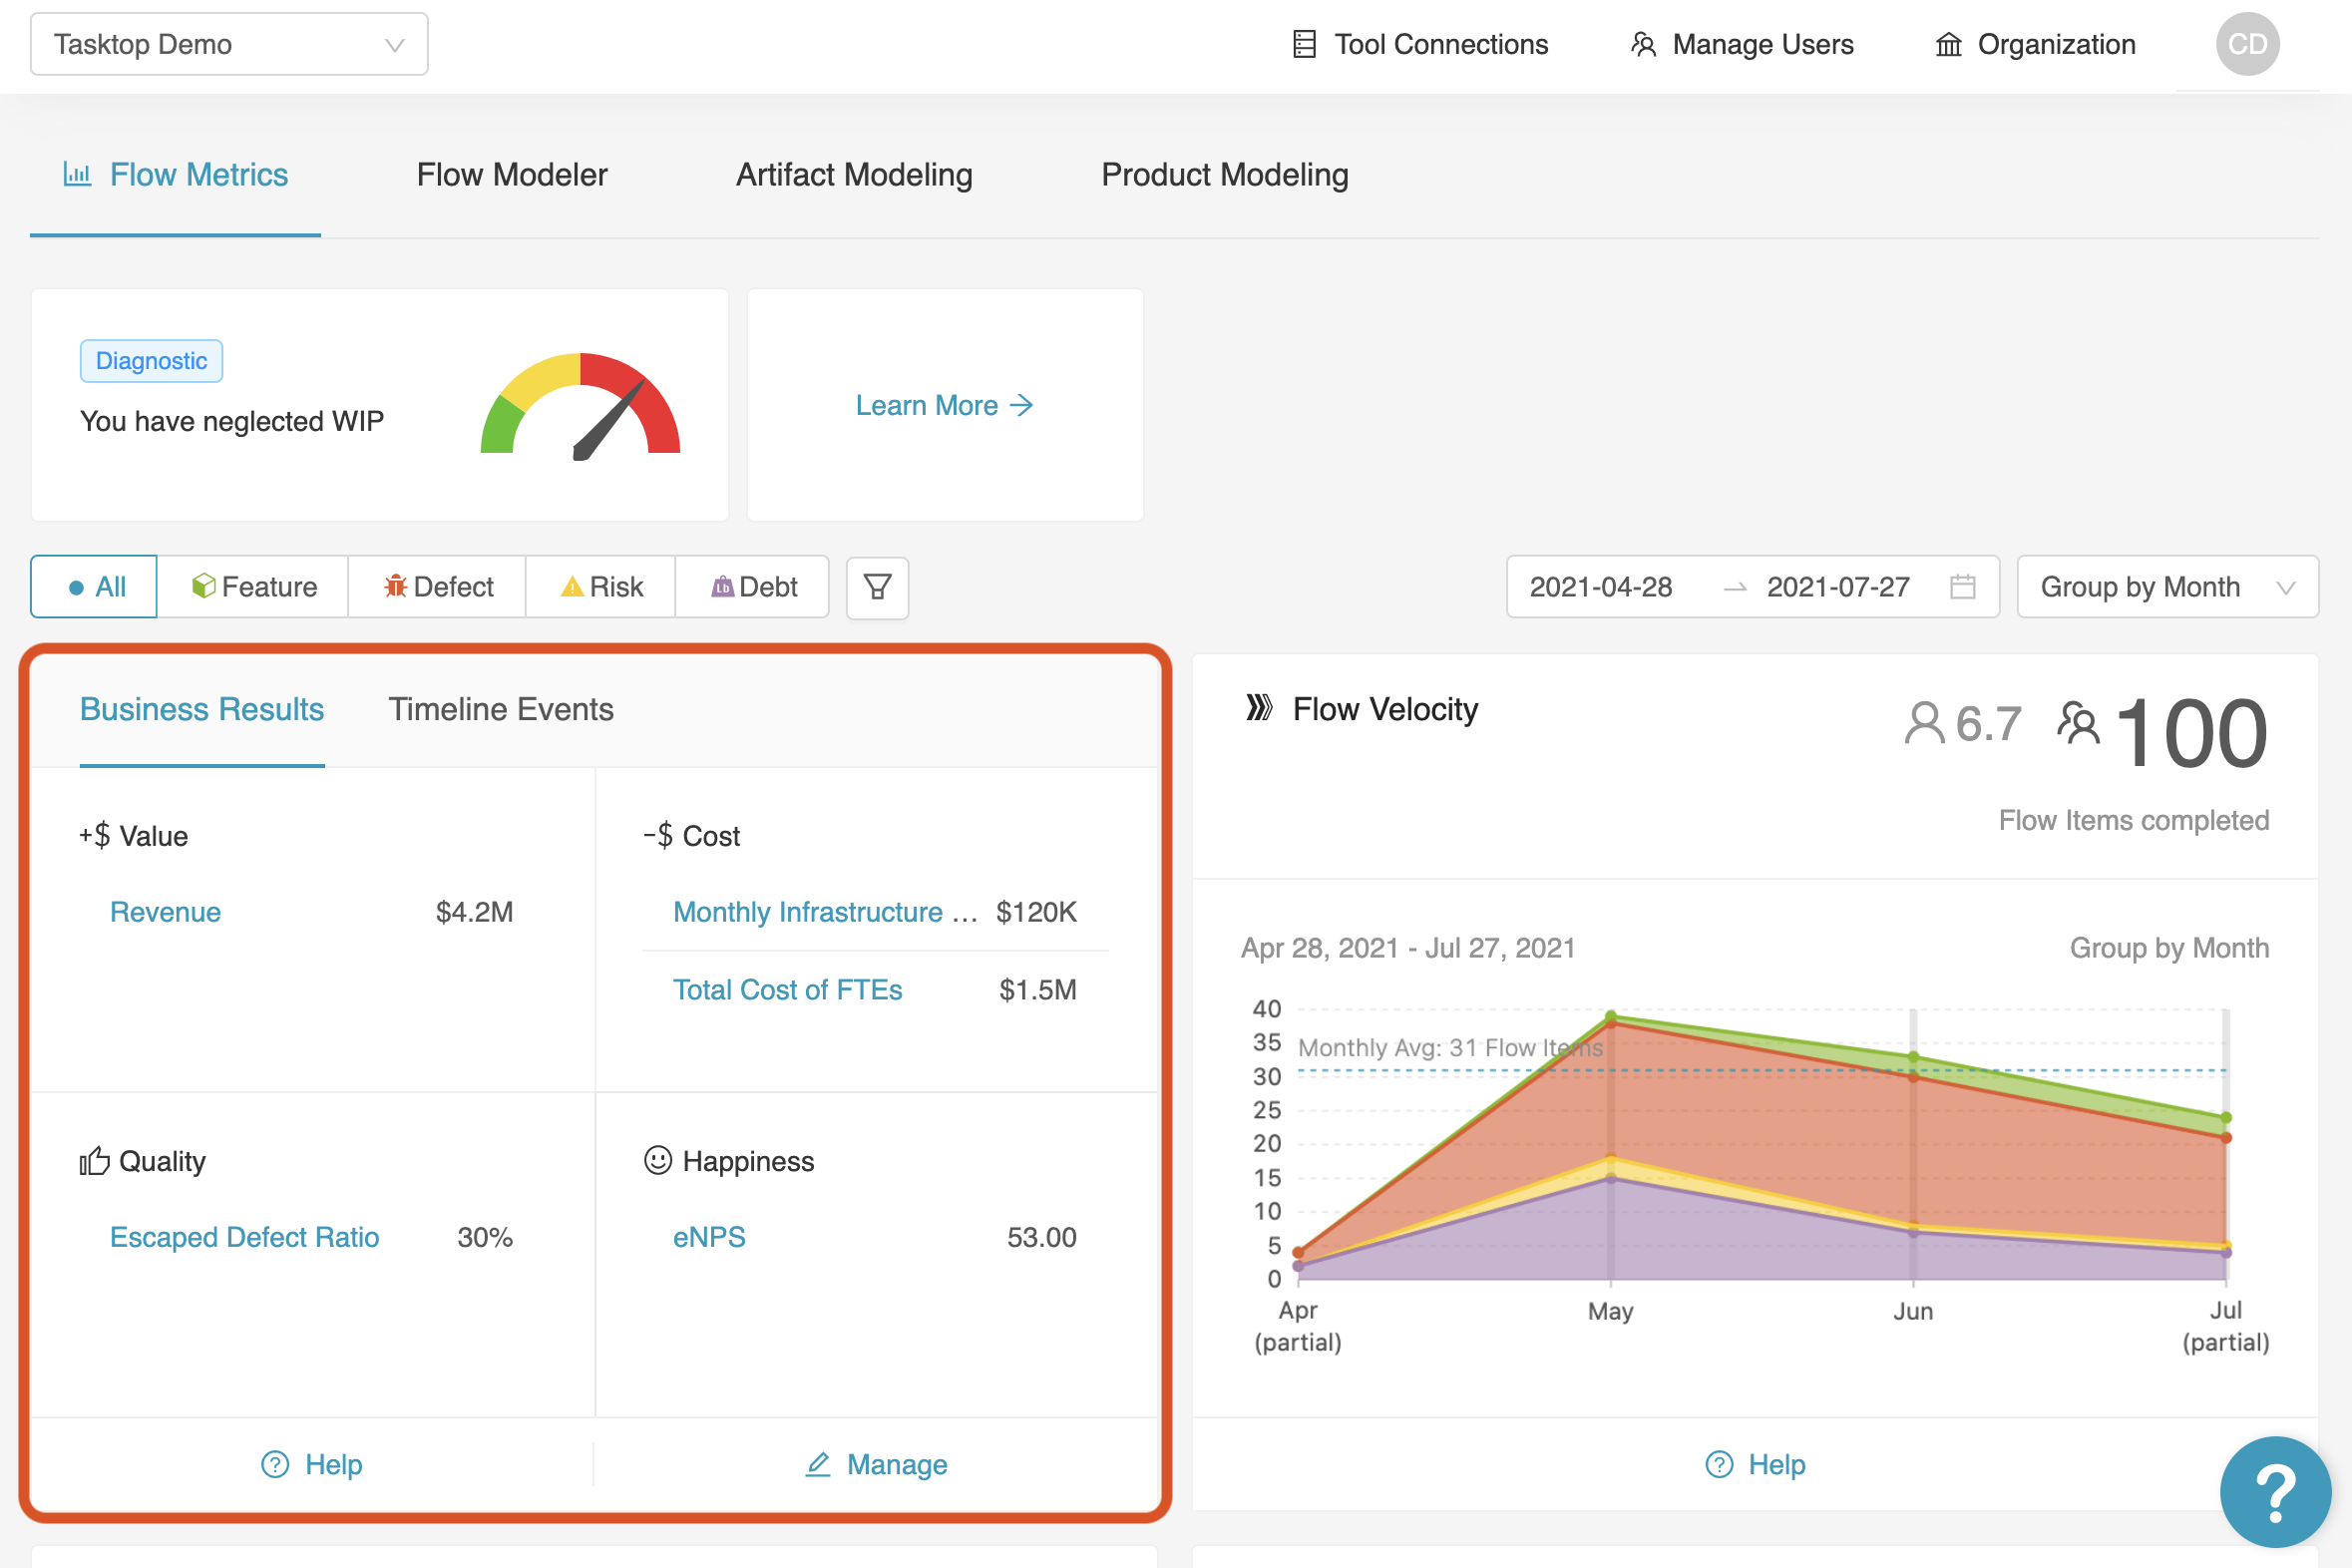
When you click on a business result, the business result’s data points will be plotted on a graph. This helps you correlate progress on a business result with your Flow Metrics, so you can draw conclusions like:
- Sales increased in line with Flow Velocity®
- Usage declined in Q2 as Flow Time got longer
- When Flow Load® per employee went down, employee NPS scores went up
- When debt distribution increased, the number of production incidents decreased the following quarter


Also, if you have already added a timeline event (and enabled the Show events on Flow Metrics toggle), it will appear as a dotted line on the business results graph.

Below, you will find basic information about each type of business result and examples of how they relate to your Flow Metrics.
Value
Value determines the health and well-being of a company, and may be measured by the amount of total revenue or customer renewals.
Example:
- New Sales
- Monthly Visitors
- Website Conversions
How do Flow Metrics relate to this business result?
Flow Velocity® and Flow Time directly impact business value. Delivering more business requests sooner (rather than later) boosts potential revenue increase and growth.
Example: Are shorter Flow Times in Q1 correlated with increased revenue in Q2?
Cost
Cost is the amount spent to run a business, for example, for employee salaries and benefits, materials and supplies, or travel.
Example:
- Customer Acquisition Cost
- Total Cost of FTEs
How do Flow Metrics relate to this business result?
Flow Efficiency® helps acknowledge and address waste in a value stream, resulting in necessary actions that decrease future costs.
Example: Does an improvement in Flow Efficiency® in Q3 result in reduced costs in Q4?
Quality
Quality is the degree to which a product or service meets the customer's expectations.
Example:
- Average Defects Per Release
- Escaped Defect Ratio
How do Flow Metrics relate to this business result?
Flow Distribution® helps ensure that quality and productivity stay high by addressing defects and debts, which in turn improves customer retention.
Example: Does an investment in debt in Q1 (Flow Distribution®) result in improved quality (e.g., less escaped defects) in subsequent releases?
Happiness
Happiness, in relation to business, is defined as an employee's overall sense of enjoyment with their work or a customer's satisfaction with a company's products or services.
Example:
- eNPS Scores
- Low Turnover Rates
How do Flow Metrics relate to this business result?
Flow Load® impacts happiness – when employees have reasonable workloads and can focus with fewer interruptions, morale typically increases. Work can be completed with higher quality and employees can take pride in their work.
Example: Does a reduction in Flow Load® in Q2 correlate with an improvement in employee NPS scores in Q2?
Coaching Tutorial
Learn more about aligning value streams with business results in this short coaching tutorial:
Note: This tutorial can also be accessed from the Business Results drawer.