
Flow Metrics
Introduction
Flow Metrics, as described by the Flow Framework®, provide a clear indication of whether your value streams and your flow are sufficient to support targeted business outcomes (like improved adoption, revenue and quality, reduced costs, and employee turnover).
The Flow Metrics dashboard features four Flow Metrics and Flow Distribution® for each product value stream.
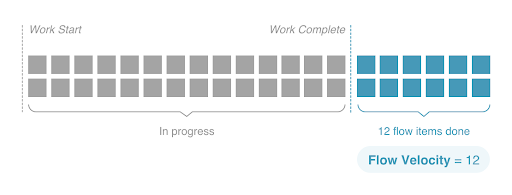
- Flow Velocity® gauges whether value delivery is accelerating. Flow Velocity® is the number of flow items of each type completed over a particular period of time. This is also referred to as throughput.
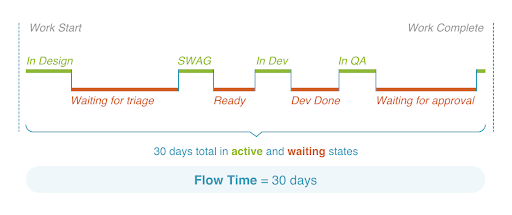
- Flow Time can identify when time to value is getting longer. Flow Time measures the average time it takes for flow items to go from ‘work start’ to ‘work complete,’ including both active and wait times.
- Flow Efficiency® can identify when waste is increasing or decreasing in your processes. Flow Efficiency® is the ratio of active time vs. wait time out of the total Flow Time.
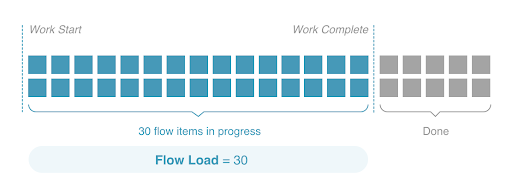
- Flow Load® monitors over and under-utilization of value streams, which can lead to reduced productivity. Flow Load® measures the number of flow items currently in progress (active or waiting) within a particular value stream.
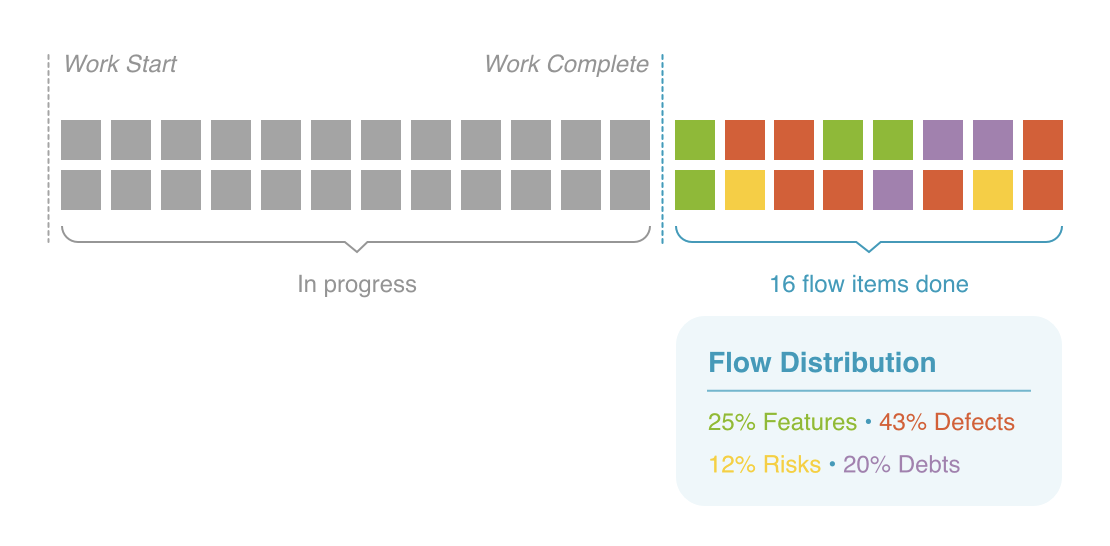
In addition to the four Flow Metrics, Flow Distribution® helps prioritize various types of work during specific time frames in order to meet a desired business outcome. Flow Distribution® measures the ratio of the four flow items completed over a particular window of time.
Getting Started with Flow Metrics
To access your Flow Metrics dashboard, click the Flow Metrics tab.

Note: You can always click the Help icon to find more information about a topic.
Customizing your Dashboard
For a personalized view of your Flow Metrics dashboard, Viz offers customization options such as custom date range, advanced filters, and more.
You can set the date range for your metrics and the desired grouping by day, week, or month.

Or, set a custom date range to view your metrics for a specific time period (e.g., sprint, quarter, etc.).

You can also filter the artifacts in your dashboard using the advanced filter — which filters your metrics by artifact type.

Note: When setting a filter, be conscious of relationships between different artifact types to prevent double counting — for example, selecting both stories and their parent epics could result in misleading velocity numbers as a result of double counting.

If using smart filters, Flow Distribution® will show the Flow Distribution® breakdown of the four flow items in their totality.

If you want to understand distribution at a more granular level, the advanced filter will allow you to compare velocity breakdown of the specific artifact types selected.

Exporting Flow Metrics
Seamlessly incorporate your metrics into internal reporting by downloading a snapshot of your Flow Metrics as a CSV or PDF file.
To export your Flow Metrics, simply click the Export Product button and select the Export PDF or Export CSV option.
Note: The exported files will mirror the filters and data that appear on your screen.

And that's it! In a single click, your snapshot will be downloaded directly from the Flow Metrics dashboard.
Here are some examples of how the snapshots will appear:


Flow Velocity®
Flow Velocity® measures productivity by showing how many flow items of each type were completed over a particular period.
You can use this metric to:
- Identify whether value delivery is accelerating, decelerating, or staying constant.
- Prompt investigation into how to increase Flow Velocity® when it’s too low, for example, by investing in talent, architecture, or infrastructure. Since wait time is the largest factor that stalls flow, efforts to increase Flow Efficiency® can also dramatically improve Flow Velocity®.
- Prompt research into the root cause of a noticeable change in velocity, for example, a new process, change in workflow, or staffing change.
How is it calculated?
Flow Velocity® is defined as the number of completed flow items minus the number of re-opened flow items per time interval.
Note: High Flow Velocity® translates into more value delivered.
How do I interpret this metric?
|
Flow Velocity® is... |
This may indicate... |
|
|---|---|---|
 |
High |
Value delivery is accelerating. |
 |
Low and Flow Time is high |
Interruptions from context switching are present |
Flow Load®
Flow Load® measures work in progress (WIP) by showing the number of flow items being actively worked on in a value stream. It includes all flow items in either an active or waiting state.
Utilize Flow Load® to discover the impact too much WIP has on your speed metrics and your team’s happiness.
You can use this metric to:
- Discover the product value stream’s optimal Flow Load®, when Flow Velocity® is high and Flow Time is low.
- Work with business stakeholders to balance demand vs. capacity correctly.
- Understand how WIP impacts business outcomes, like employee happiness and engagement.
How is it calculated?
Flow Load® is represented as the total number of flow items in active or wait states recorded at the end of each day.
Note: High Flow Load® will negatively impact velocity.
How do I interpret this metric?
|
Flow Load® is... |
This may indicate... |
|
|---|---|---|
 |
Stable |
Only a small amount of WIP is being completed. |
|
High and Flow Time is low |
A percentage of work is being neglected. |
 |
High |
Too much work in progress (WIP). Too much WIP results in delayed delivery of value, increased costs, decreased quality, and unhappy employees. When demand is higher than the team’s ability to consume it, which often leads to burnout. |
|
High and Flow Time is high |
Recommended Flow Load
Note: The Recommended Flow Load feature is only available for users who have migrated to Flow Metrics version 1.1.
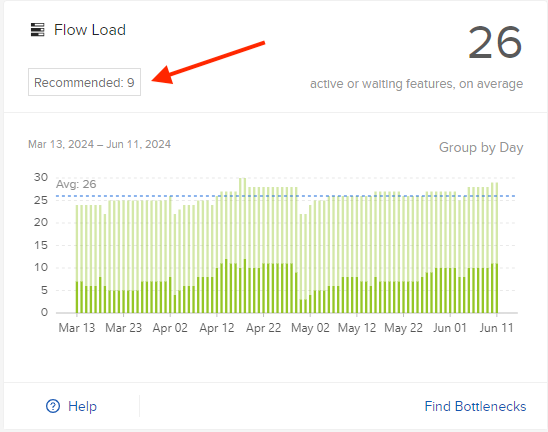
Recommended Flow Load is a target value for the Flow Load® metric, derived from Flow Velocity® and Flow Time. It represents the point where your arrival rate is balanced out by your departure rate (i.e., Flow Velocity®). If your Flow Load® exceeds this balance point, neglected WIP will begin to accumulate.
By monitoring this value, you can quickly assess if your team is overloaded and at risk of generating Neglected WIP.
Flow Time
Flow Time measures time to delivery by tracking the average time from work start to work complete, including both active and wait states.
Track Flow Time to help your team become more predictable and answer the question, “When will the work be done?”
You can use this metric to:
- Identify when time to value is increasing or decreasing, so you can investigate the contributing factors.
- Predict time-to-market based on previous performance.
- Assign Flow Time goals for each flow item to ensure that all flow items are completed within an adequate timeframe. This helps to ensure that production incidents (defect flow items) are not the only flow item handled expeditiously.
How is it calculated?
Flow Time is calculated by averaging the total days work remains in both active and waiting states from work start to work complete.
Note: Shorter Flow Time means faster time-to-market.
How do I interpret this metric?
|
Flow Time is... |
This may indicate... |
|
|---|---|---|
|
Too low |
Work is not being tracked accurately (e.g., moving directly from 'New' to 'Done'). |
|
High and Flow Velocity® is low |
Too much work in progress (WIP). Too much WIP increases context switching and wait times and drives down efficiency and velocity. |
85th percentile
Note: The 85th percentile feature is only available for users who have migrated to Flow Metrics version 1.1.

The Flow Time graph includes a line that indicates the 85th percentile, with a label above it displaying "85th percentile:" followed by a numerical value. The 85th percentile feature improves the precision of predicting work completion and offers a deeper understanding of delivery variability.
What does it mean?
The 85th percentile of X means that 85% of all Flow Times in the period fall below X. This value is derived from the same data series as the current average.
Learn more about how to use the 85th percentile.
Flow Efficiency®
Flow Efficiency® is a measure of waste in a value stream, where work is waiting. It tracks the ratio of active time vs. wait time out of the total Flow Time.
Measure Flow Efficiency® to help you visualize wait time from bottlenecks so that your team can figure out how to reduce problems from wait time constraints.
You can use this metric to:
- Measure wasted time and delays. The lower the Flow Efficiency®, the longer work is stagnating in a waiting state. This points to the existence of bottlenecks, inefficient processes, dependencies, or lack of resources.
- Track reduced wait times. This metric can be used in conjunction with the other Flow Metrics to focus on reducing wait times. For example, improving automation can reduce the active time component of Flow Time and decrease Flow Efficiency®.
How is it calculated?
Flow Efficiency® is calculated by dividing the number of days a flow item stays in an active state by the number of days a flow item stays in active and waiting states combined.
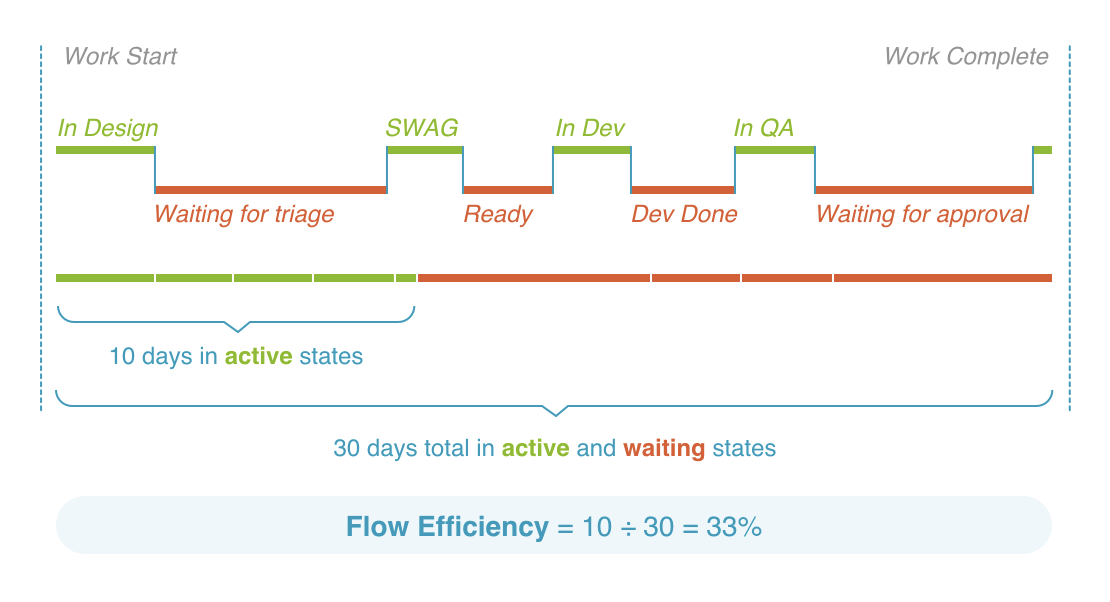
Note: Ideal Flow Efficiency® is around 30-40%.
How do I interpret this metric?
|
Flow Efficiency® is... |
This may indicate... |
|
|---|---|---|
|
Very high (e.g., 40%+) |
Your state mappings are inaccurate. For example, if your 'New' state identifies work that is past the line of commitment, that state should be re-mapped as either 'Waiting' or 'Active' |
|
Low |
Work spends a lot of time in a waiting state, which points to bottlenecks, inefficient processes, dependencies, and a lack of resources. You can create a business case for investing in the bottleneck based on the expected improvement to Flow Time and Flow Velocity®. |
|
Low | An increase in your Flow Load® and larger queues in the value stream. |
Flow Distribution®
Flow Distribution® measures de-facto investment in different value creation by showing the ratio of flow items (features, defects, risks, and debt) completed over a particular period.
You can use this metric to:
- Understand whether resource allocation is in-line with business priorities and if not, make adjustments.
- Drive prioritization discussions with business stakeholders by making work distribution visible.
- Assess how the distribution of work on technical debt impacts future Flow Velocity® — does tackling 20% debt each release ensure that feature work does not slow over time?
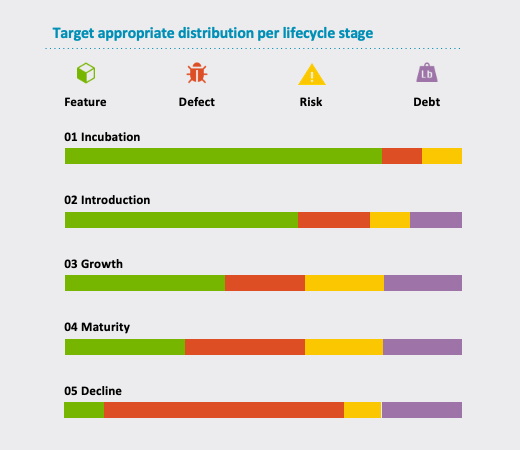
- Proactively plan Flow Distribution® such that it matches current business priorities. For example, in the Incubation phase, the distribution should have a higher feature distribution as you're pushing to have a decent MVP for launch. However, once you've launched, you can expect defect and debt distribution to increase. Refer to the illustration below to get an idea of what an appropriate distribution is per product lifecycle stage.
How is it calculated?
Flow Distribution® is the relative distribution of Flow Velocity® across the four flow item types (feature, defect, risk, debt).
Note: Healthy Flow Distribution® includes appropriate levels of risk and debt.
How do I interpret Flow Distribution®?
|
Flow Distribution® is... |
This may indicate... |
|
|---|---|---|
|
High for defects | Feature capacity is diminished by unplanned work or poor testing. Possibly too little work is being invested in debt. |
|
Lacking debt and risk |
Work is neglected, hidden or done by a centralized team. In a product-oriented value stream, ideally the product value stream would also be doing its own debt and risk work. |