
Connecting to Tools
Getting Started
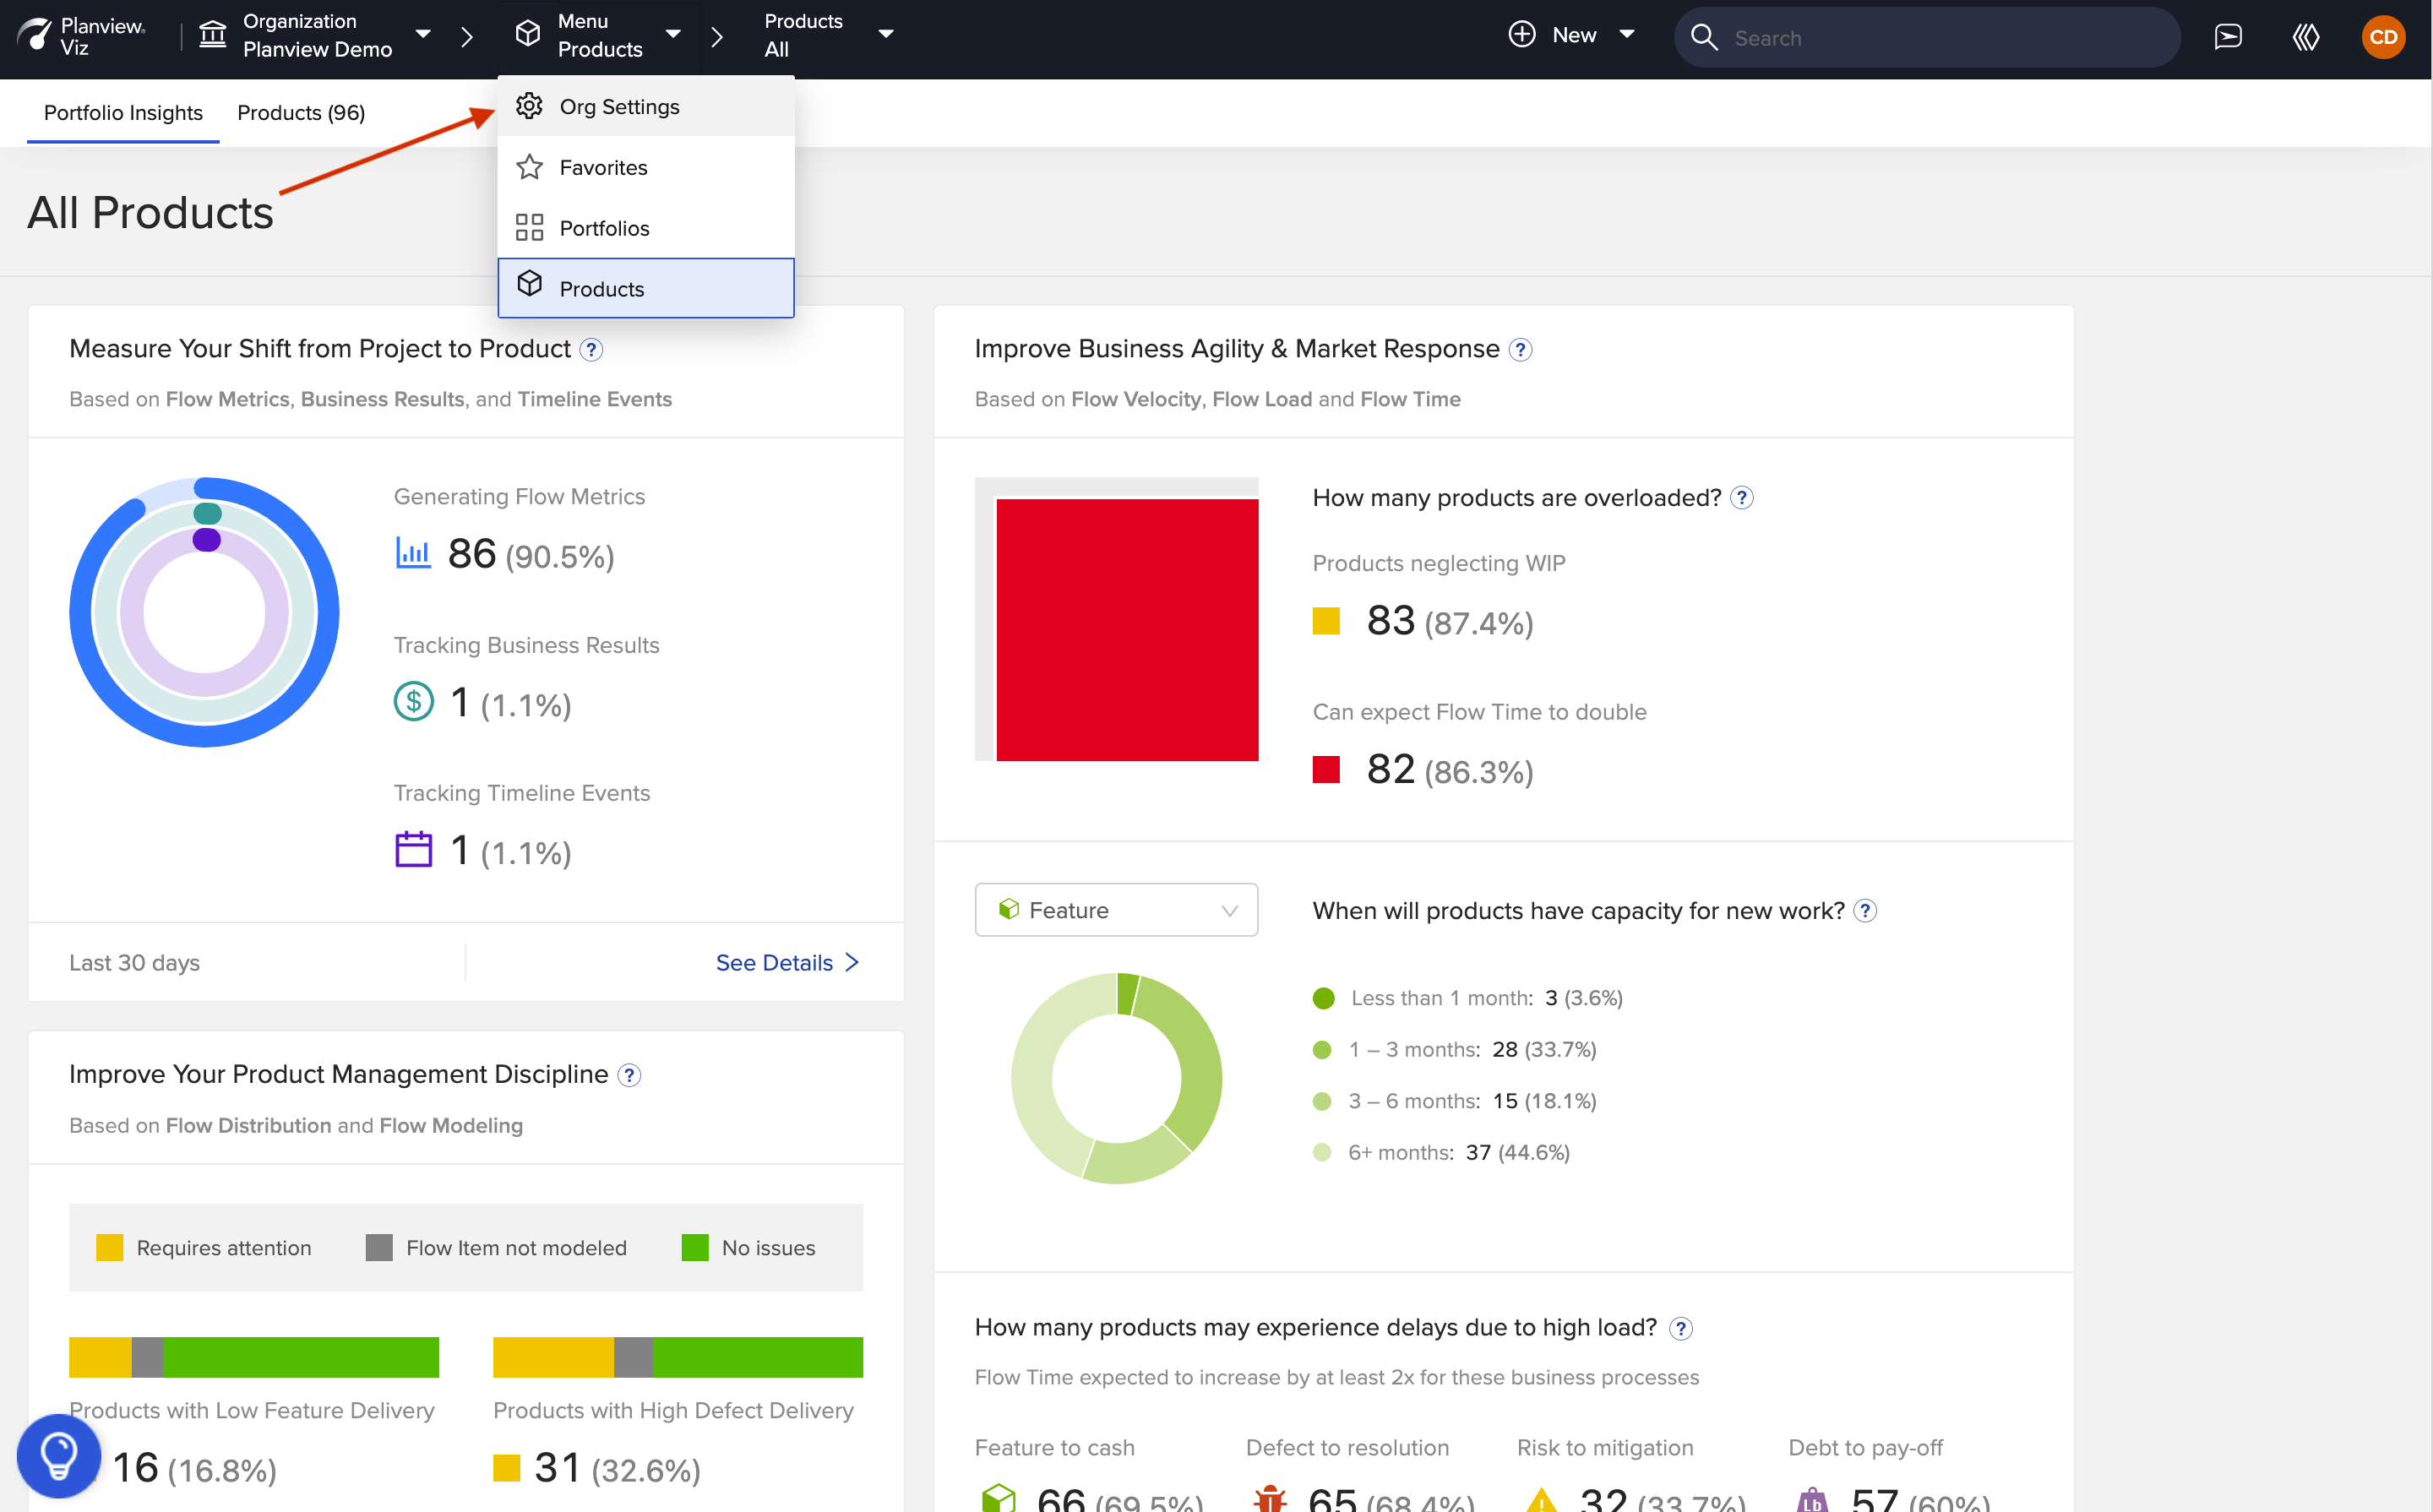
Click 'Org Settings'
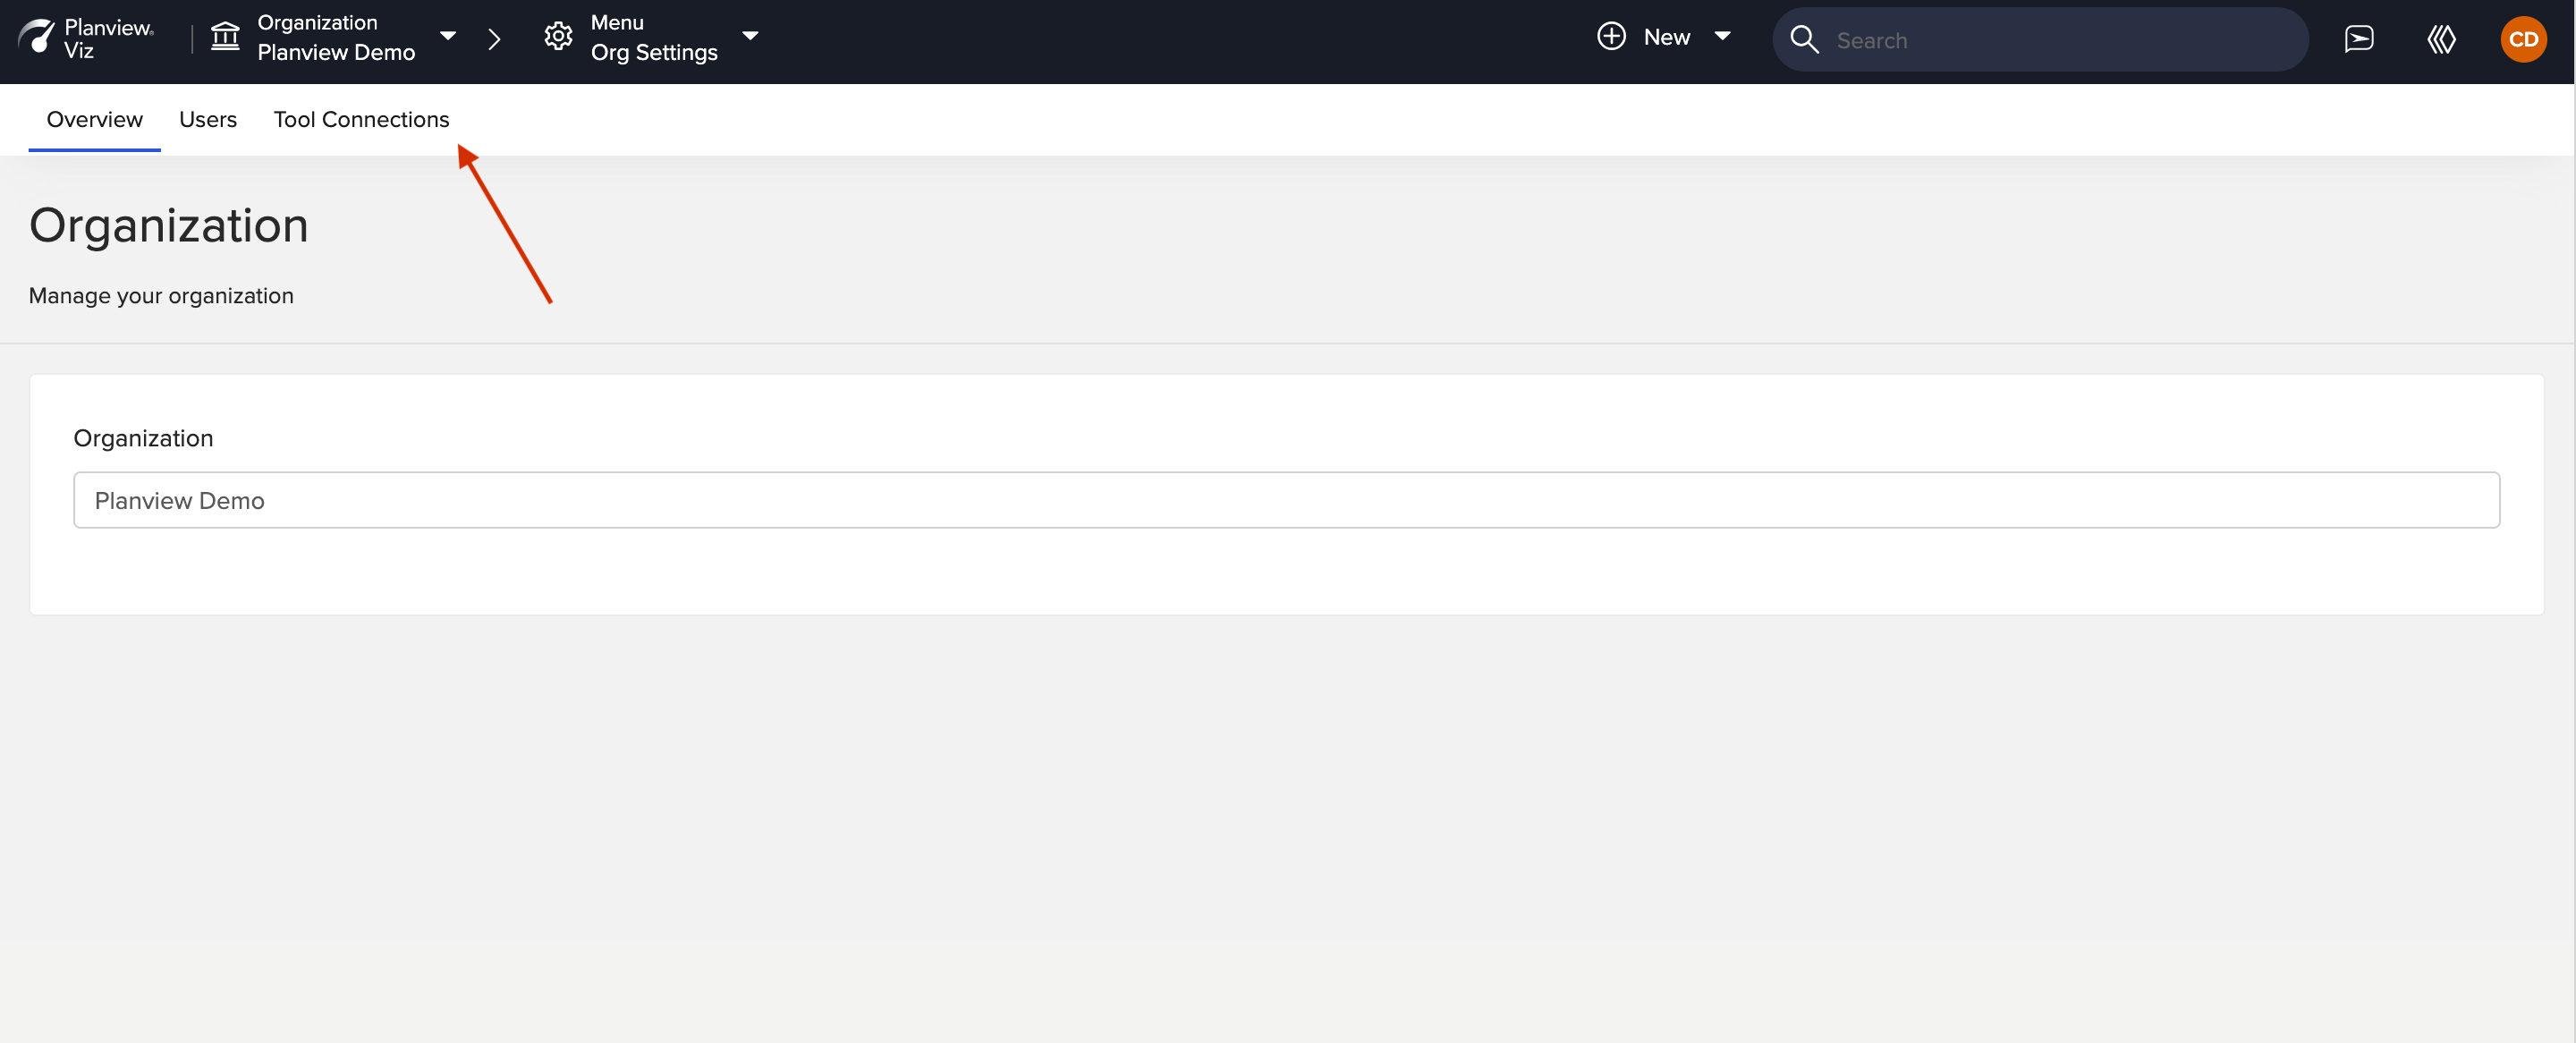
Click the Tool Connections tab
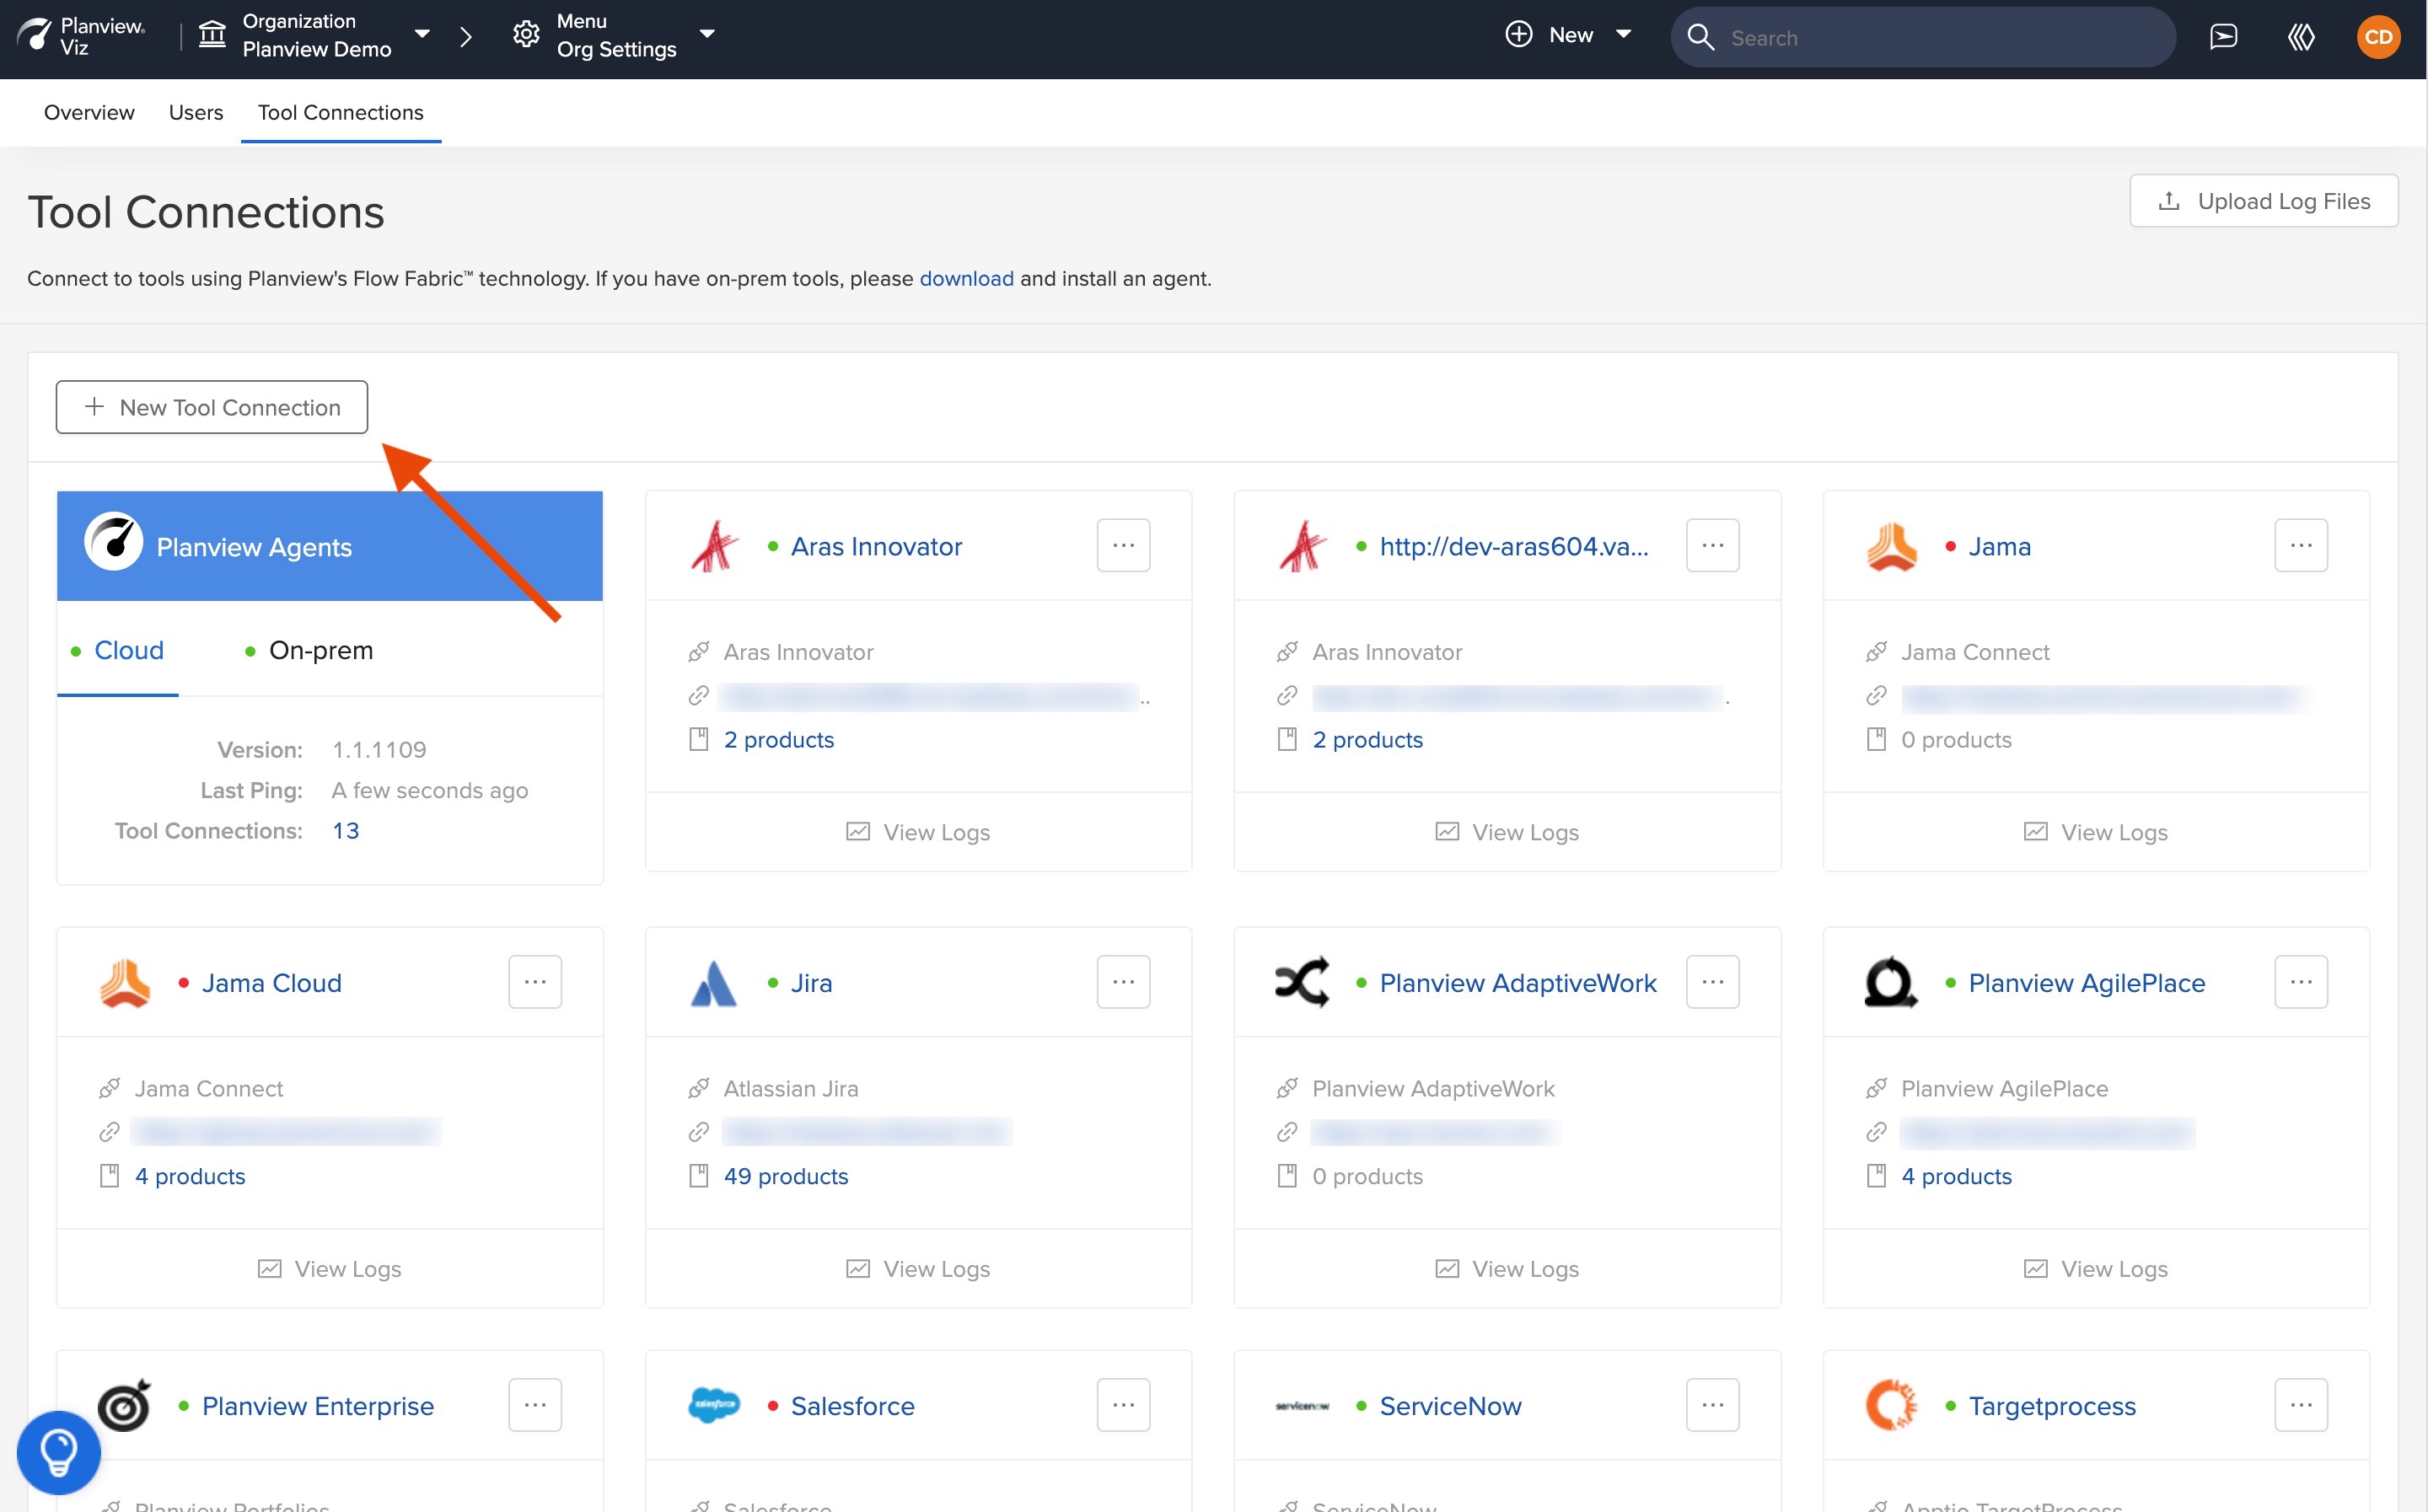
Click '+ New Tool Connection'
Note: We recommend that you create a new user within your external tool, to be used only for Viz.

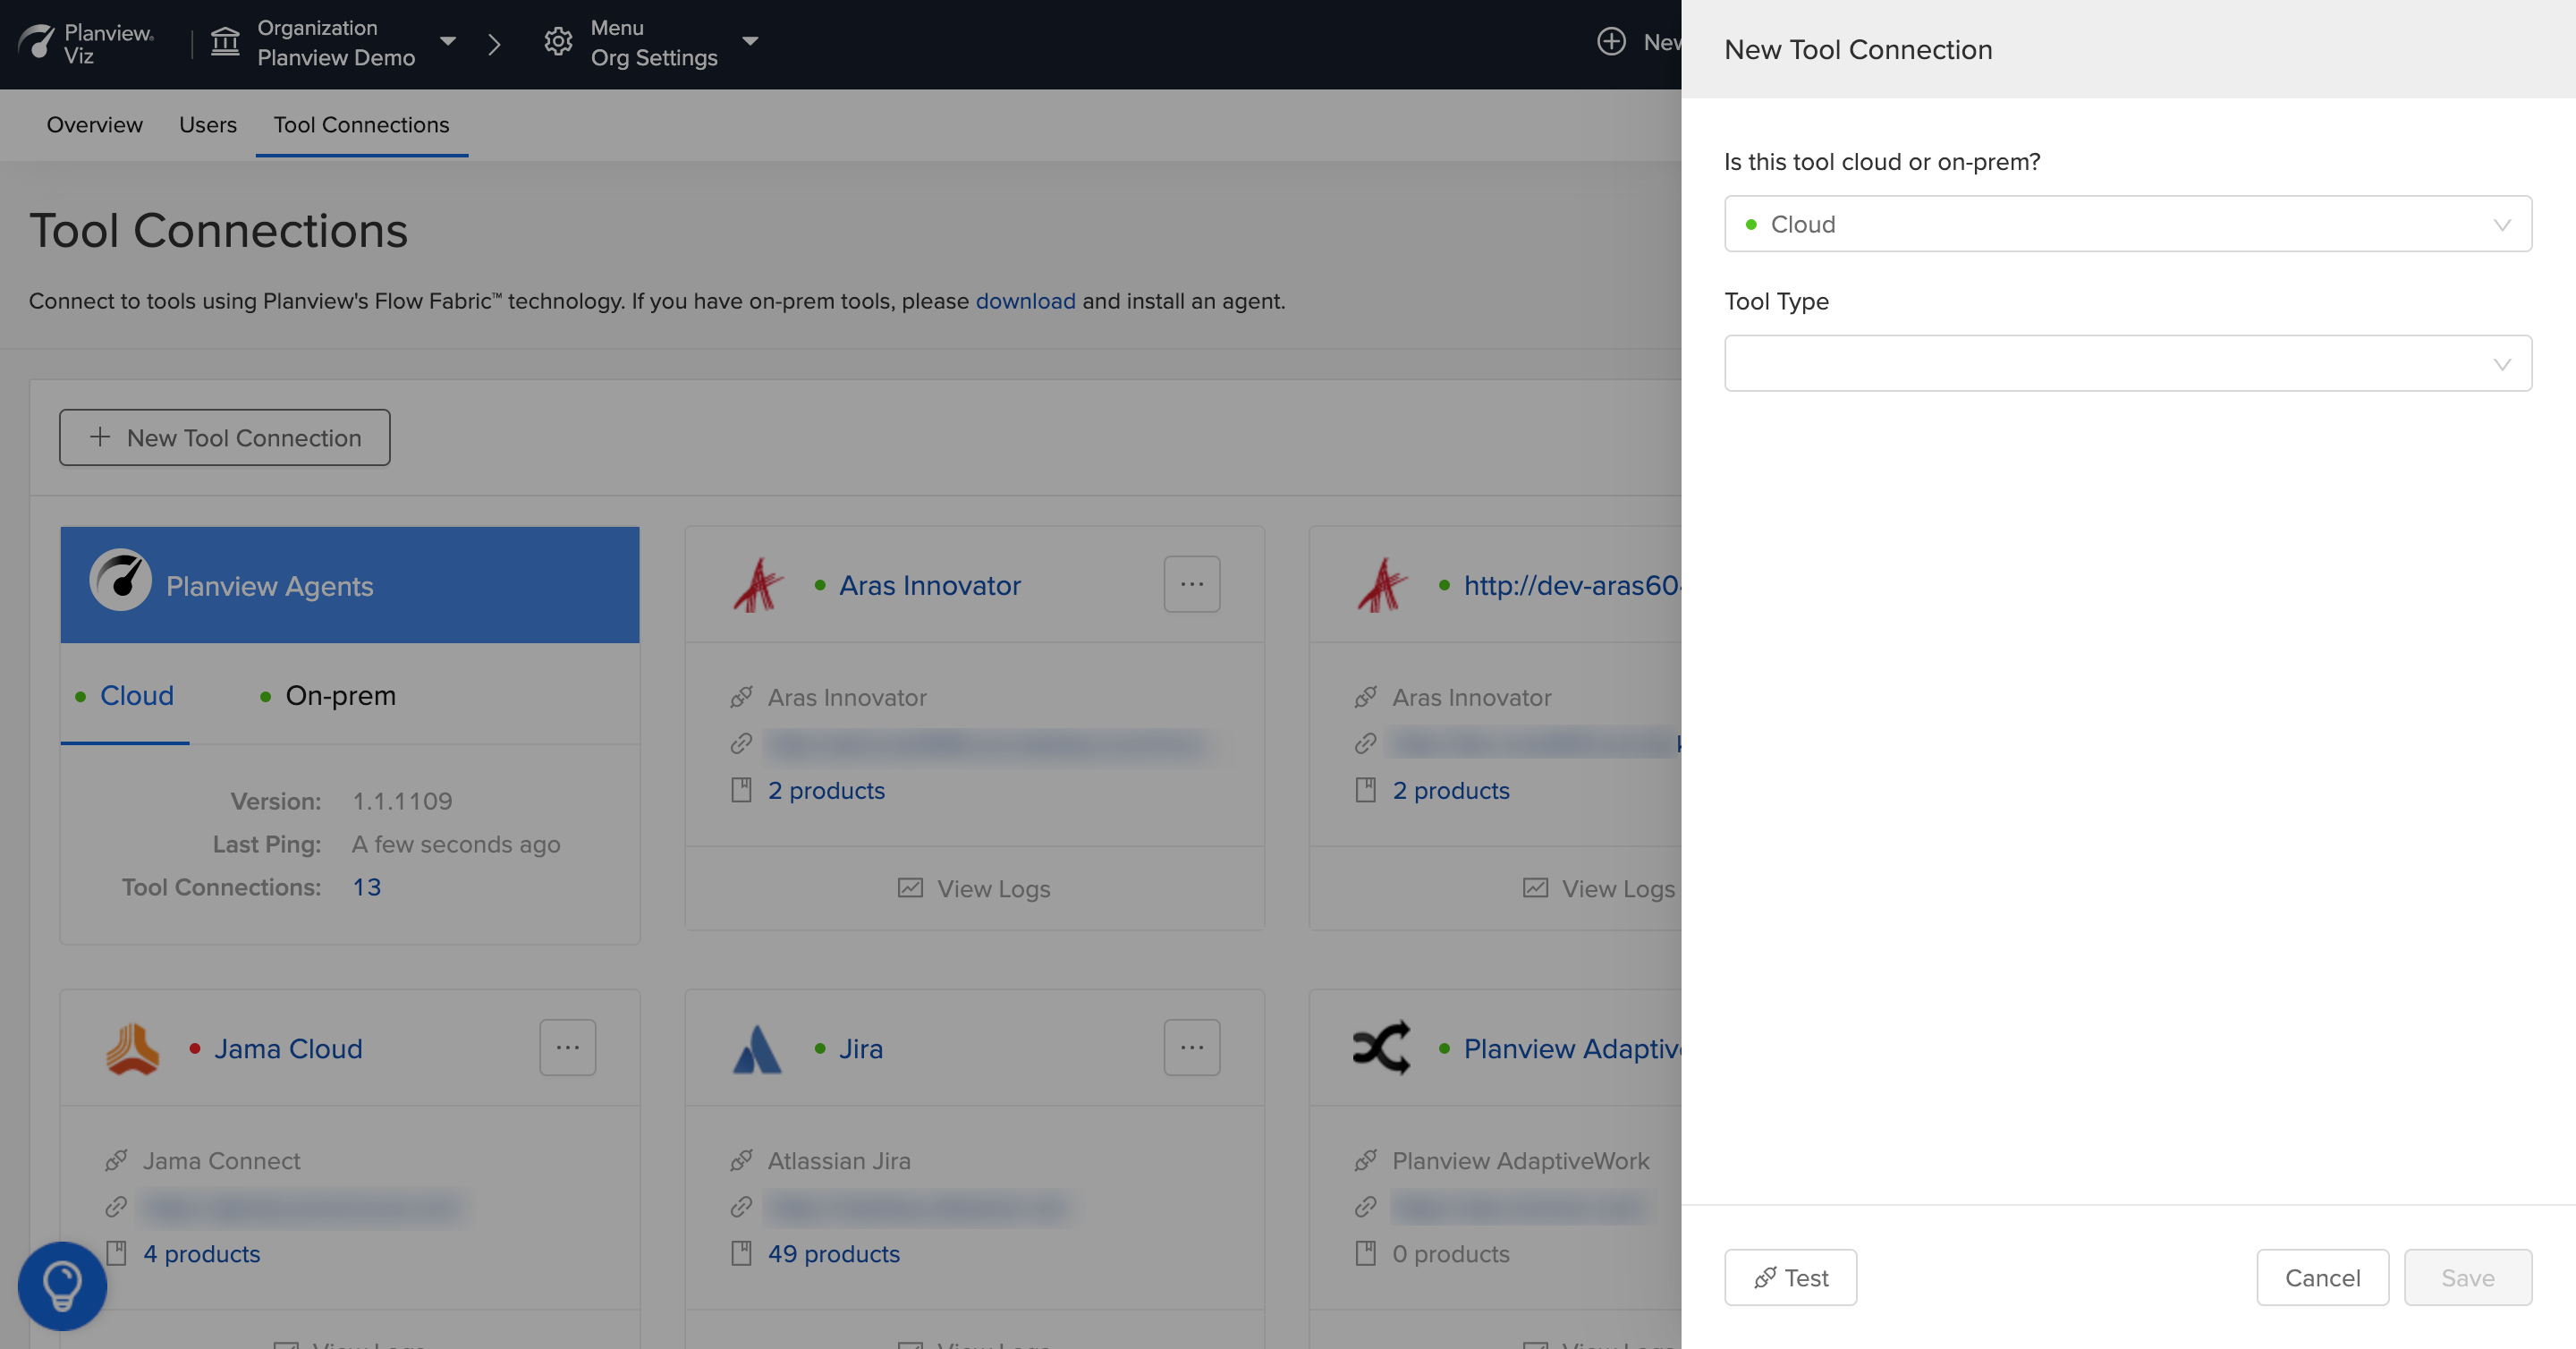
Add a new tool connection
You can find configuration details in our Connector Documentation.
Since our connectors are used in several products, you can focus on the following relevant sections:
- Connector Setup Details
- Note that any required permissions related to writing data will not be required, since Viz solely reads data from the external tools.
- Supported Artifact Types
- These are the artifact types (requirements, defects, etc) that Viz can gather flow data from.
- Supported Field Types and Functional Limitations
- These sections will give you information on available fields that can be used for creating filters within Viz. These are only relevant for advanced configuration.
Proxy Connections
To connect to tools via a proxy, check the Enable Proxy Settings box and fill in the appropriate address and credentials.
Testing your Tool Connection
You can test your tool connection to ensure your credentials are correct by clicking Test at the bottom of the Tool Connection panel. You'll see a success or failure message at the top of the panel.
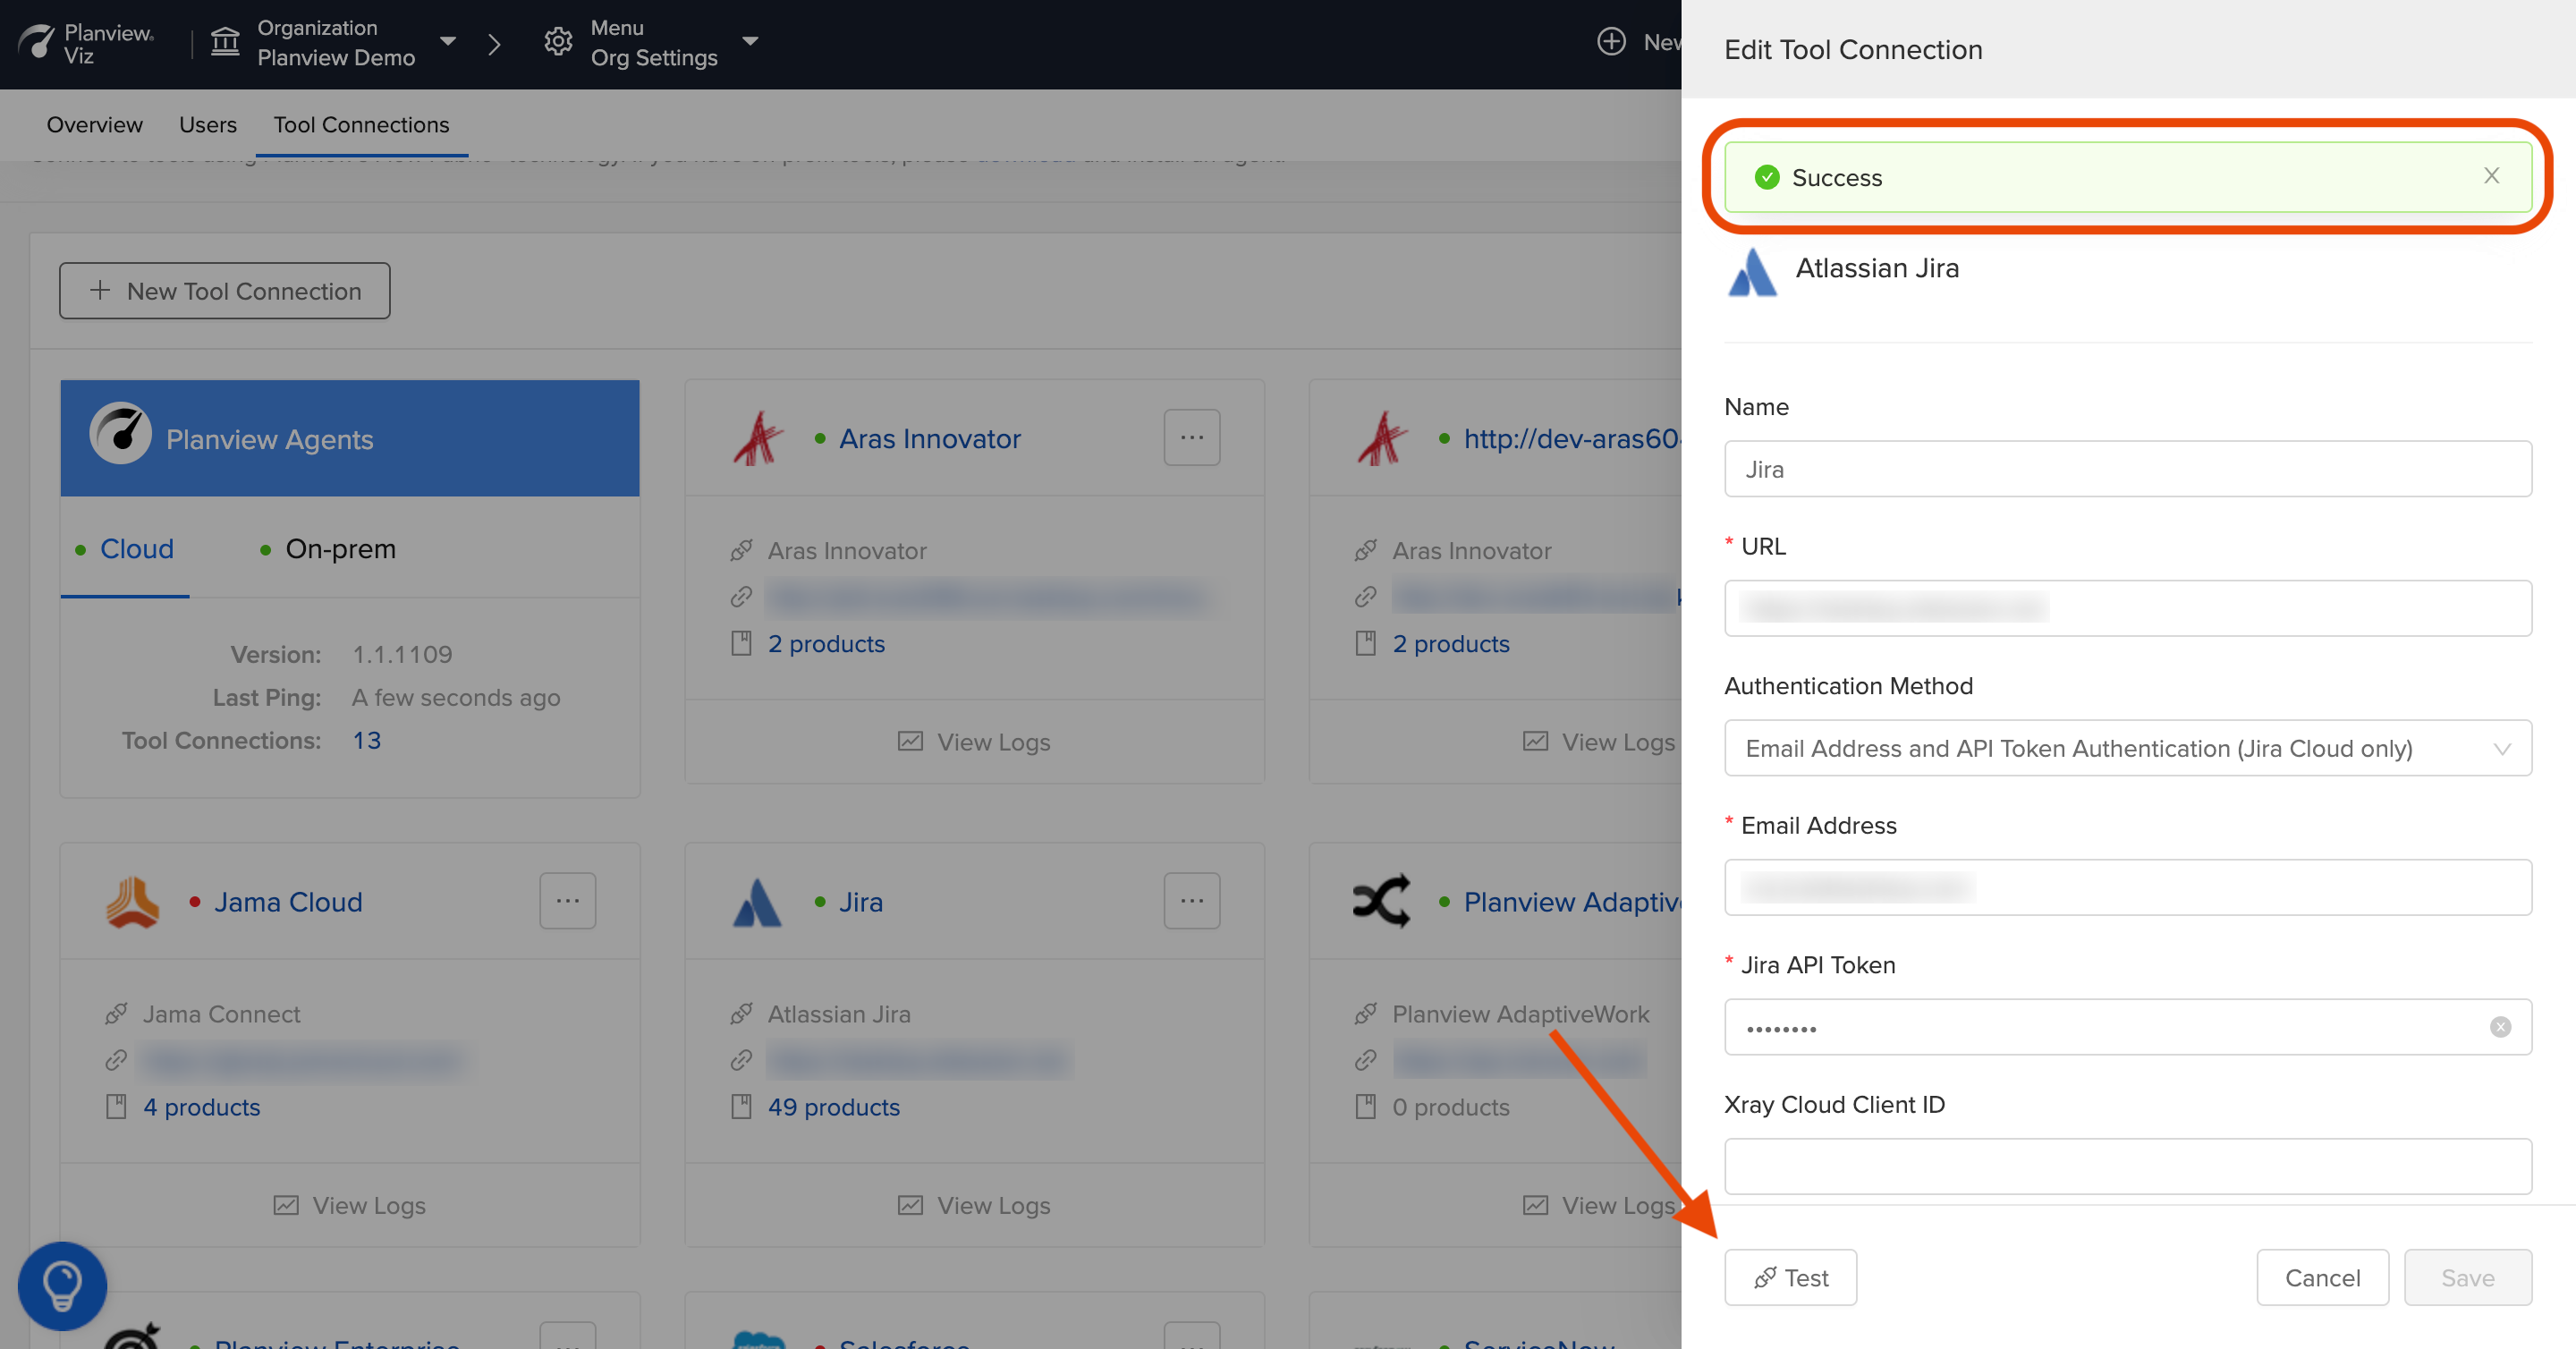
Test tool connection
Troubleshooting
If Viz is unable to connect to an external tool, data could be missing for select time periods. If that is the case, you will see a grey vertical line in the Flow Metrics visualizations.
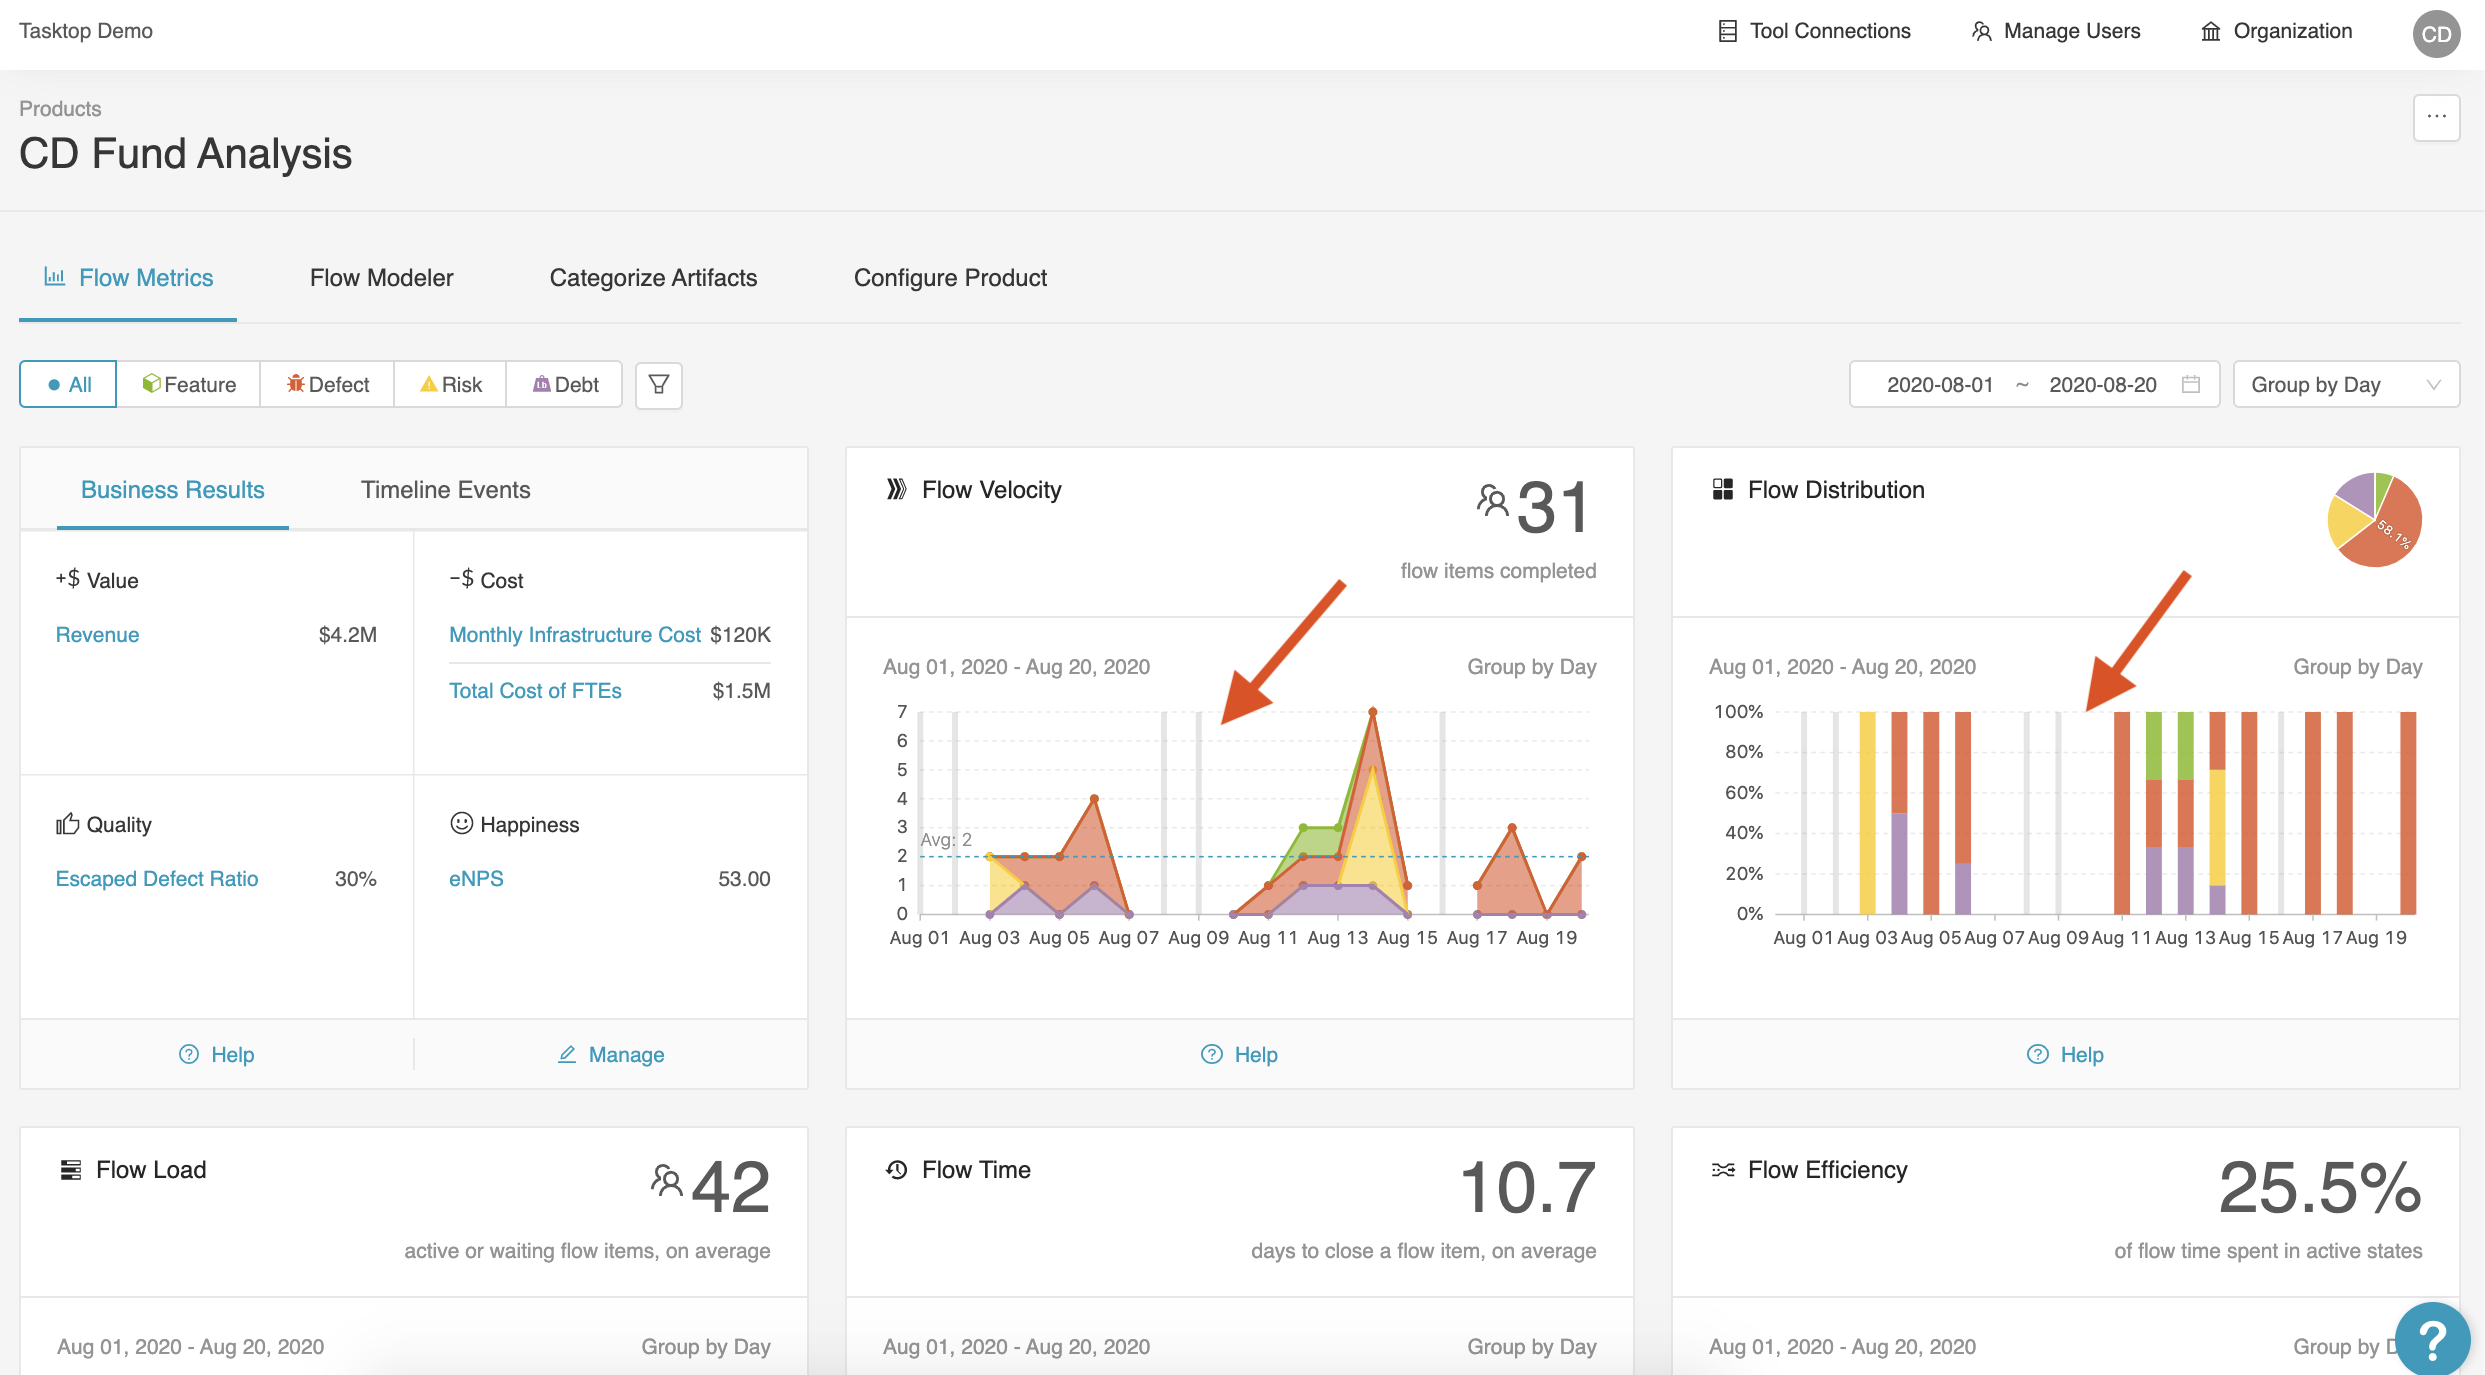
Grey vertical lines indicate missing data
Cases of missing data will be represented by a '-' in the tooltip, in contrast to 0 which represents cases where the value for the metric truly is 0 and no data is missing.
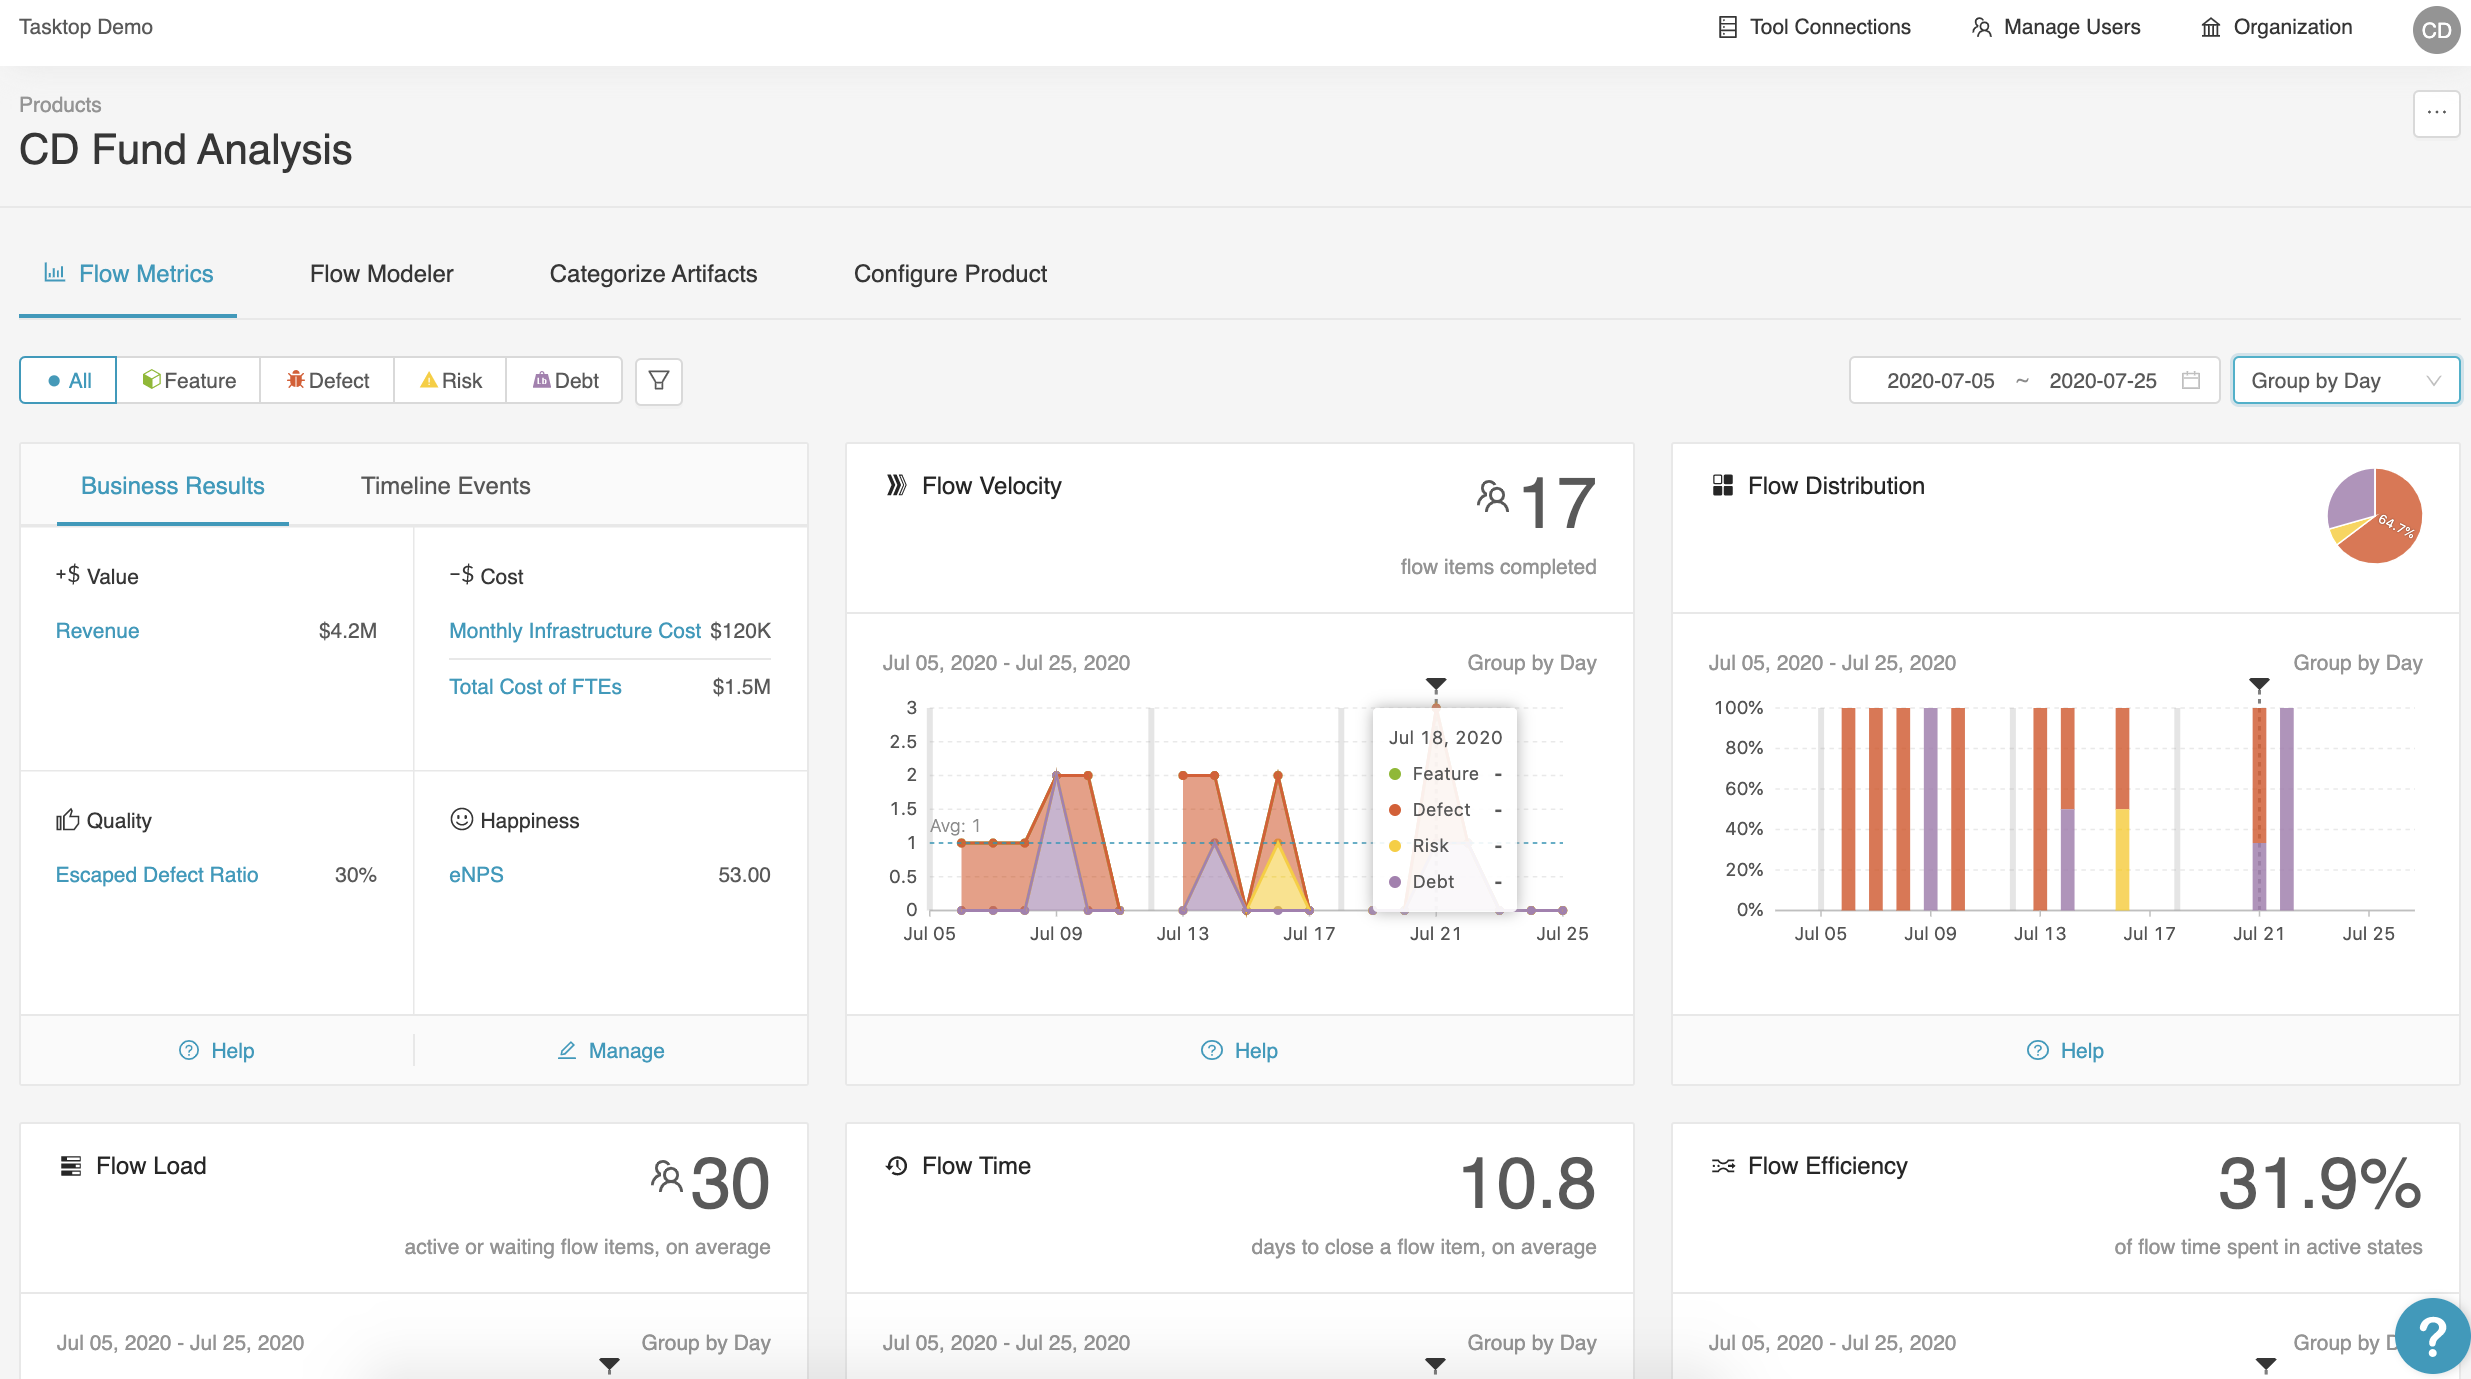
Missing data is represented by a '-'
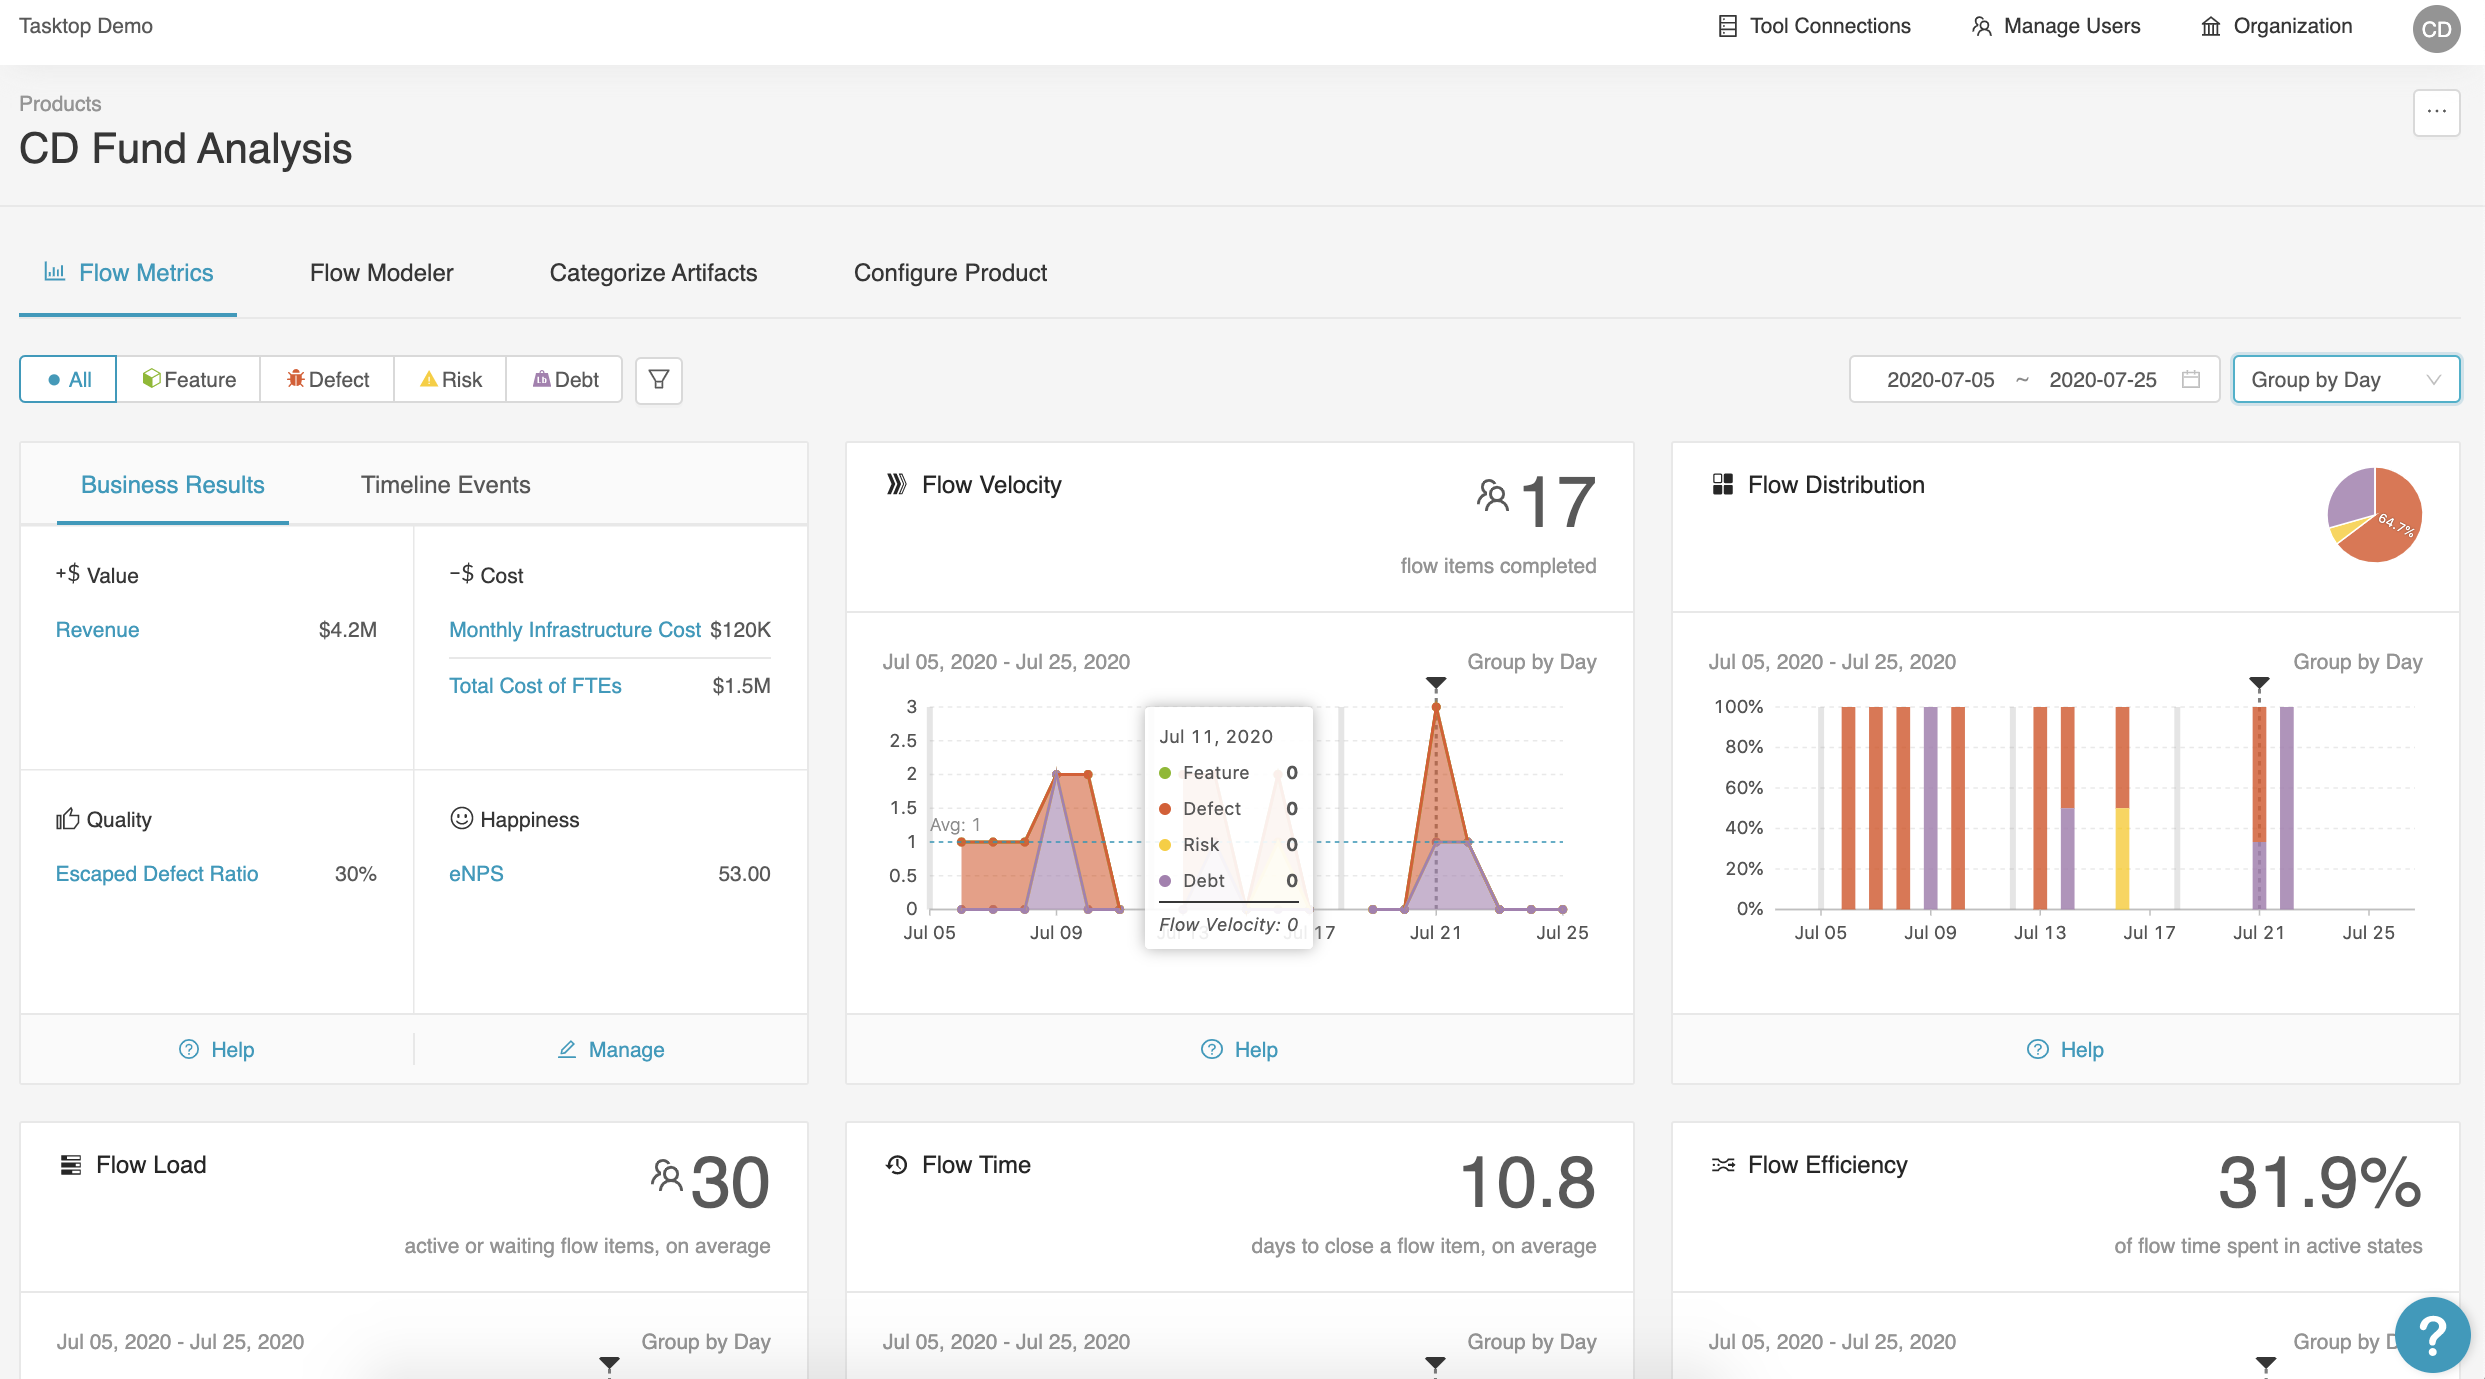
In contrast, '0' does not indicate missing data
Note that you may see cases where data is visualized, and a grey line still occurs. For example, if you have grouped by week, and data is only missing for one day in that week:

Some (but not all) data is missing in the grouping
To determine which days had connectivity issues, we recommend grouping by day.
In cases of missing data, you can investigate the source of the issue by reading the tool connection logs.
Each tool connection provides logs that can be used to monitor and troubleshoot change detection performance.
To view tool connection logs, navigate to the Tool Connections tab.
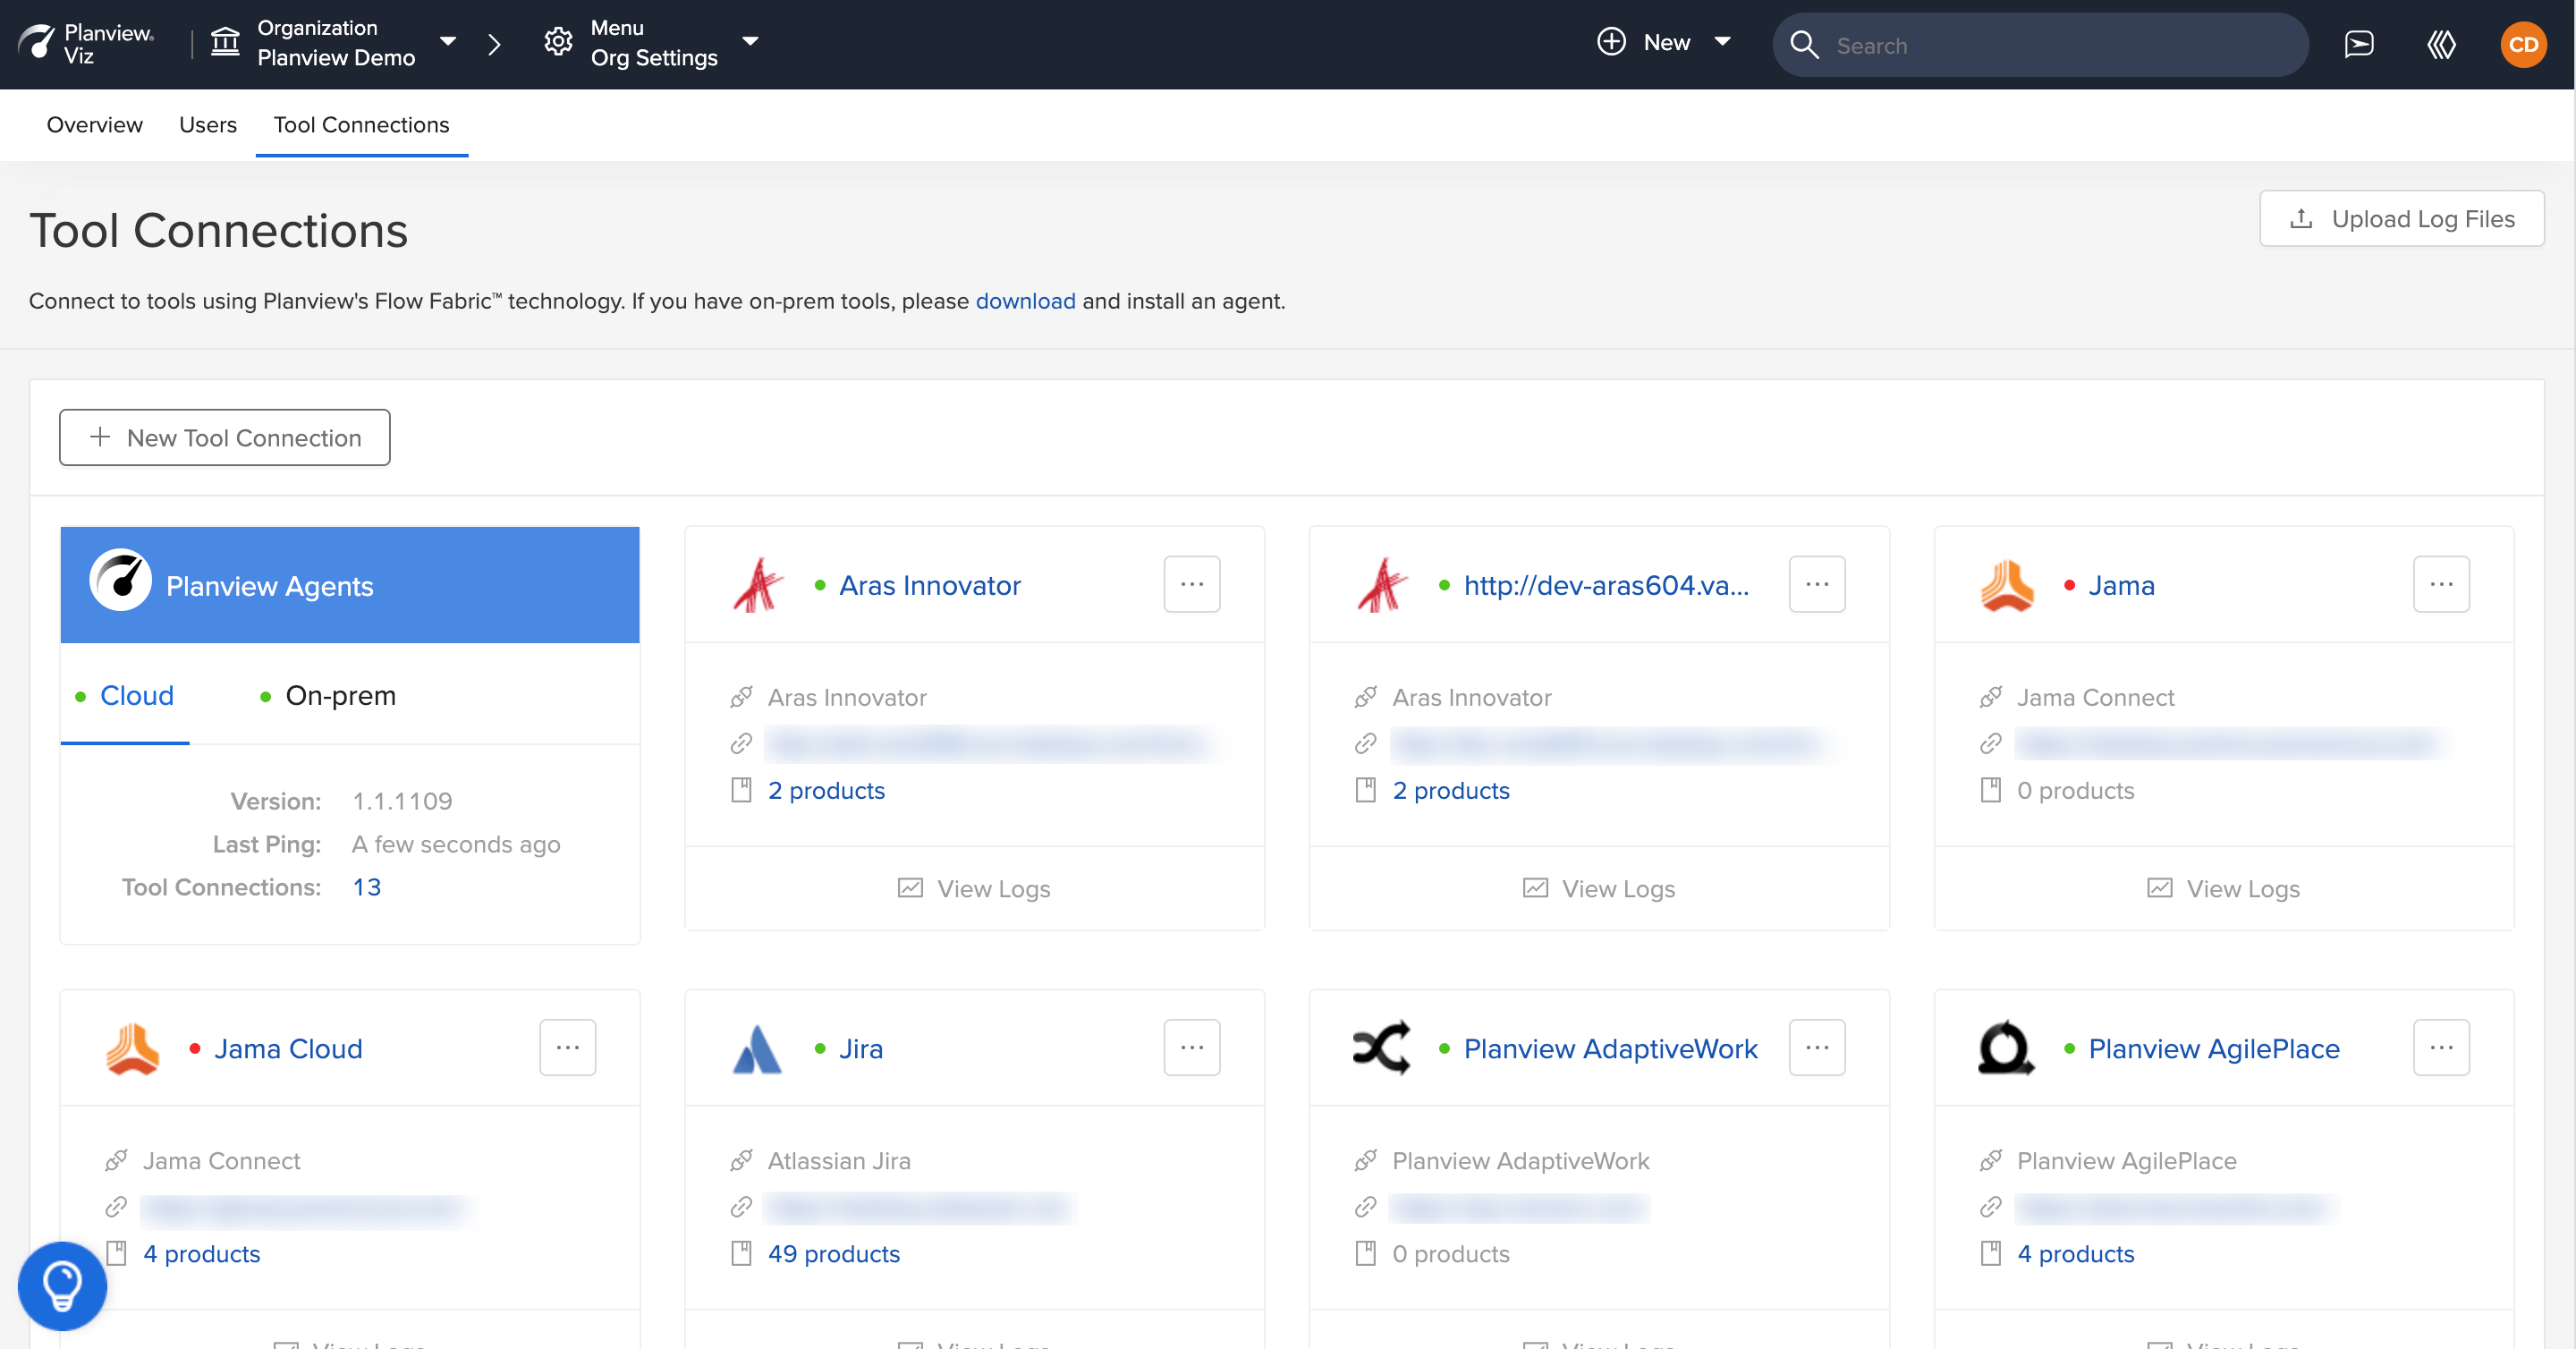
Tool Connections tab
Click View Logs on the desired tool connection.

Click 'View Logs'
The logs will provide information on change detection, including errors in cases of change detection failure.
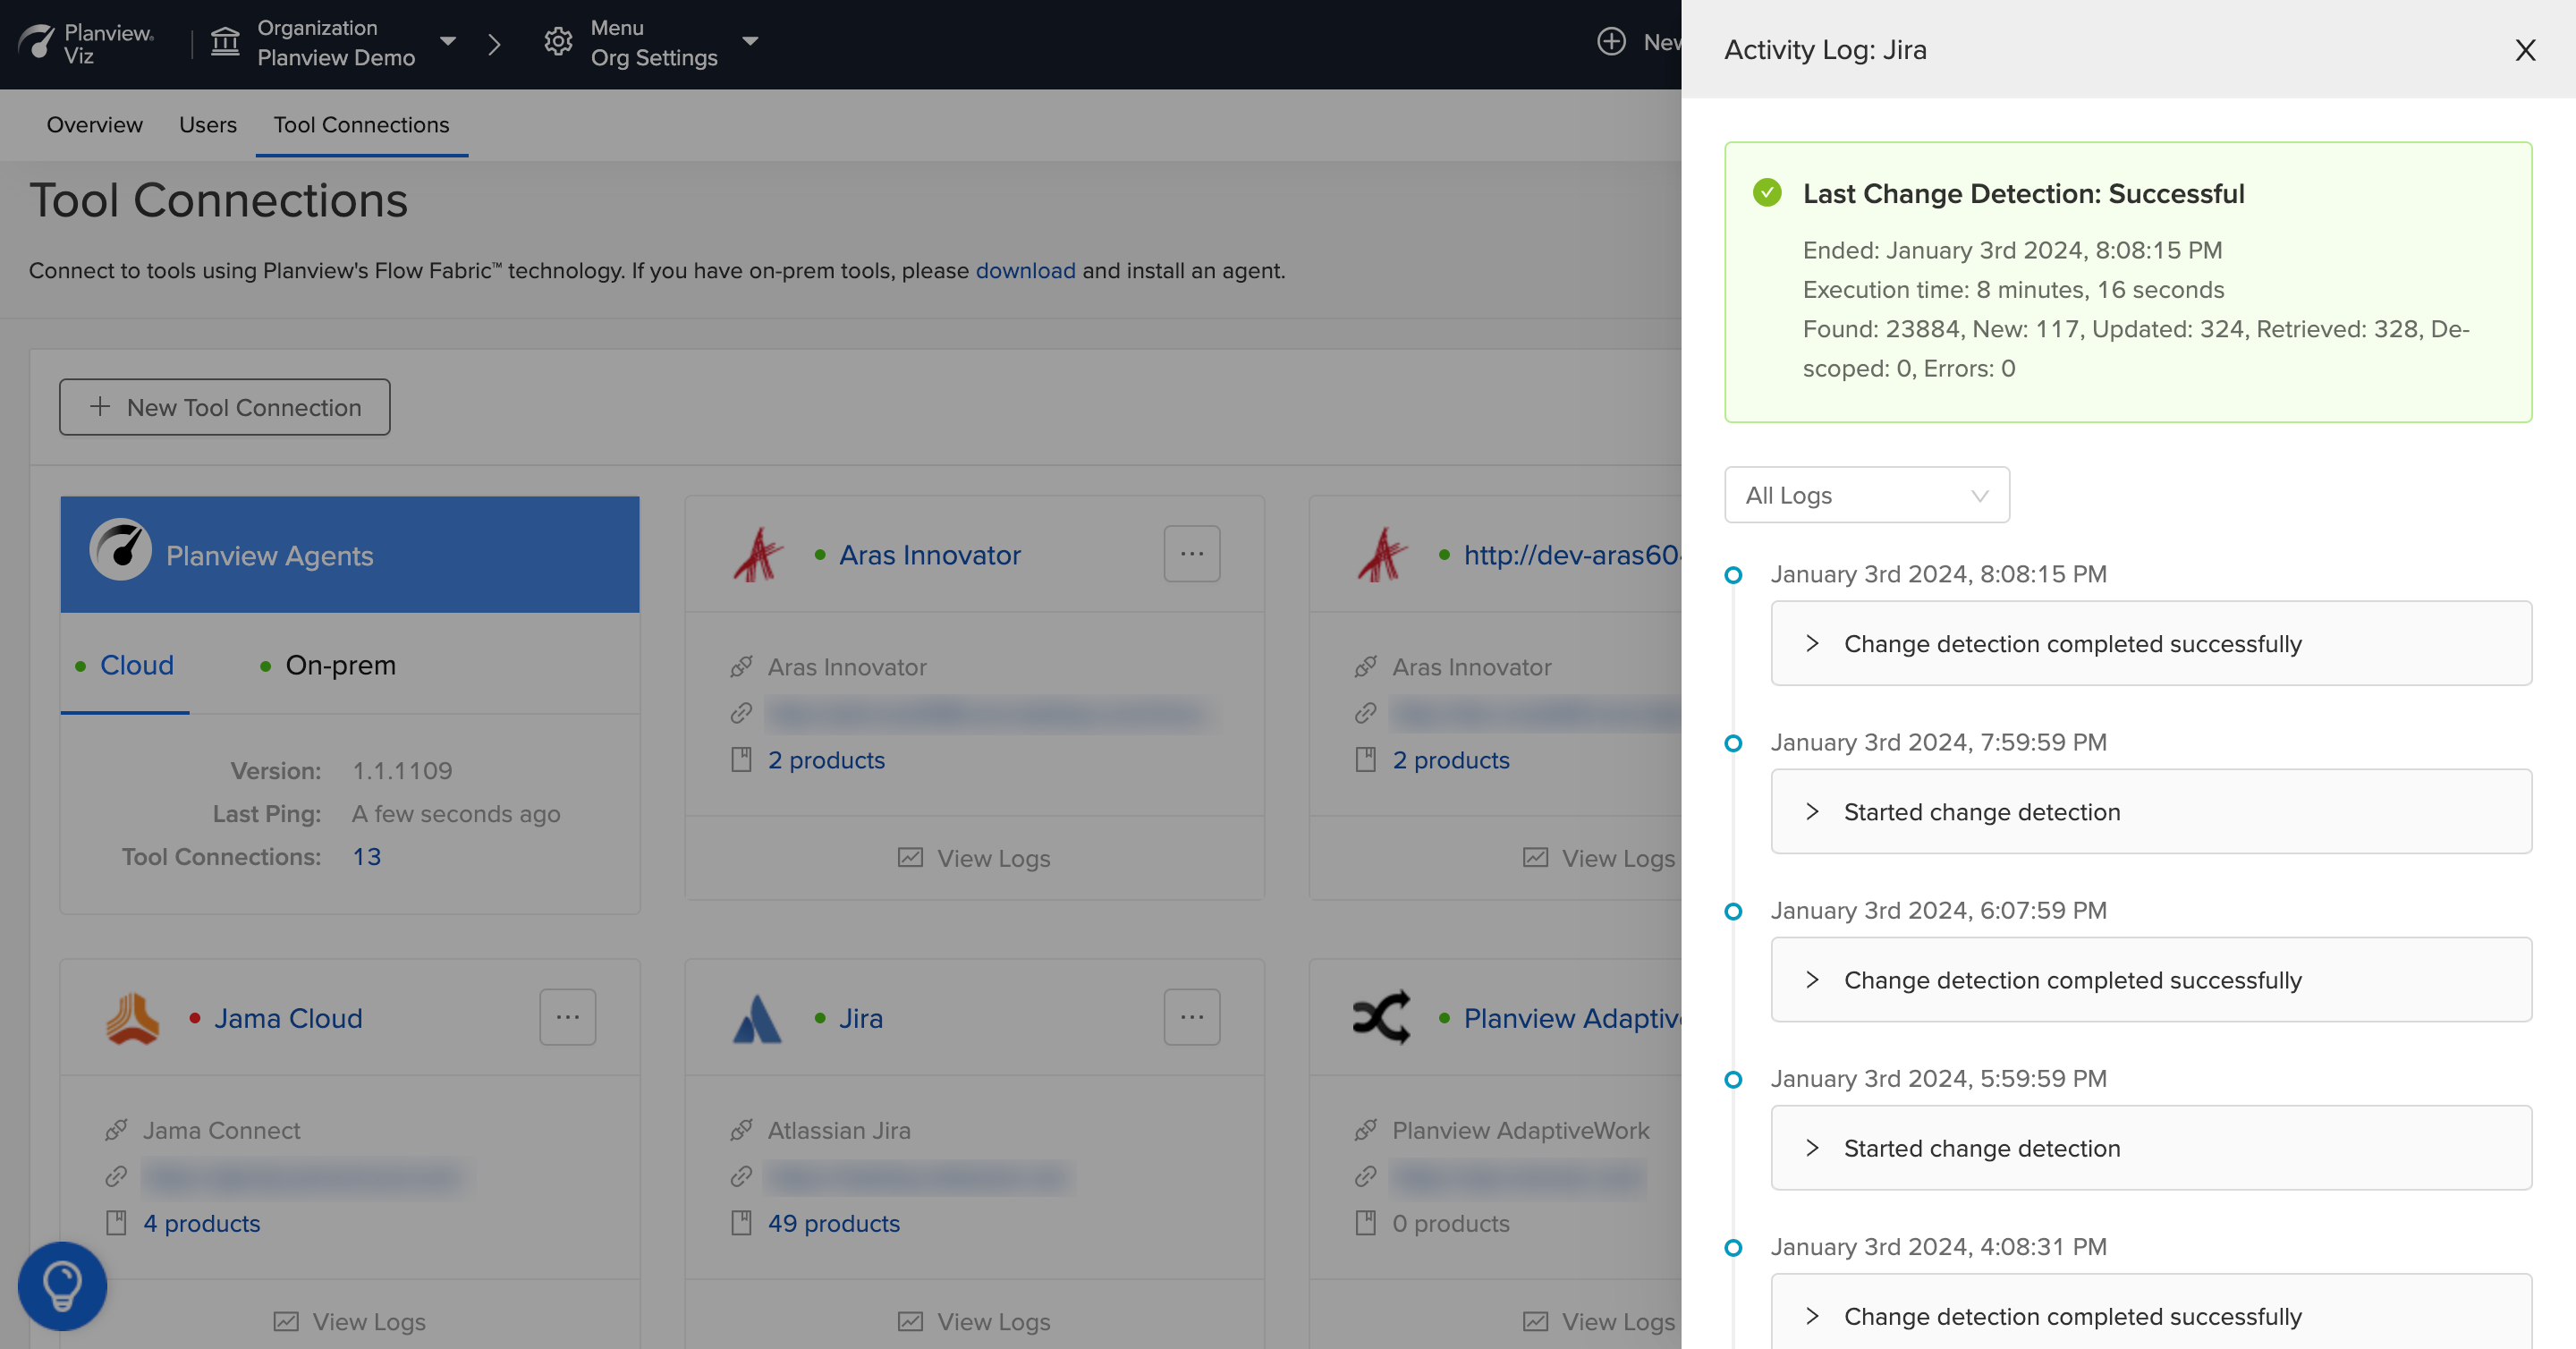
Successful Change Detection

Unsuccessful Change Detection
You can also quickly check tool connectivity by finding the agent's connection status on each tool connection card — indicated by a green or red dot.
- Green: Indicates that the agent is up and Viz can connect to the tool (i.e., authentication credentials are correct)
- Red: Indicates that the agent is down and/or Viz cannot connect to the tool (e.g., authentication credentials are not working)
Note: It is possible for change detection to fail even if the agent appears to be up (e.g., the Viz user does not have access to projects contained in the artifact set or temporary agent errors). To be confident that change detection is running as expected, you should check the tool connection logs.
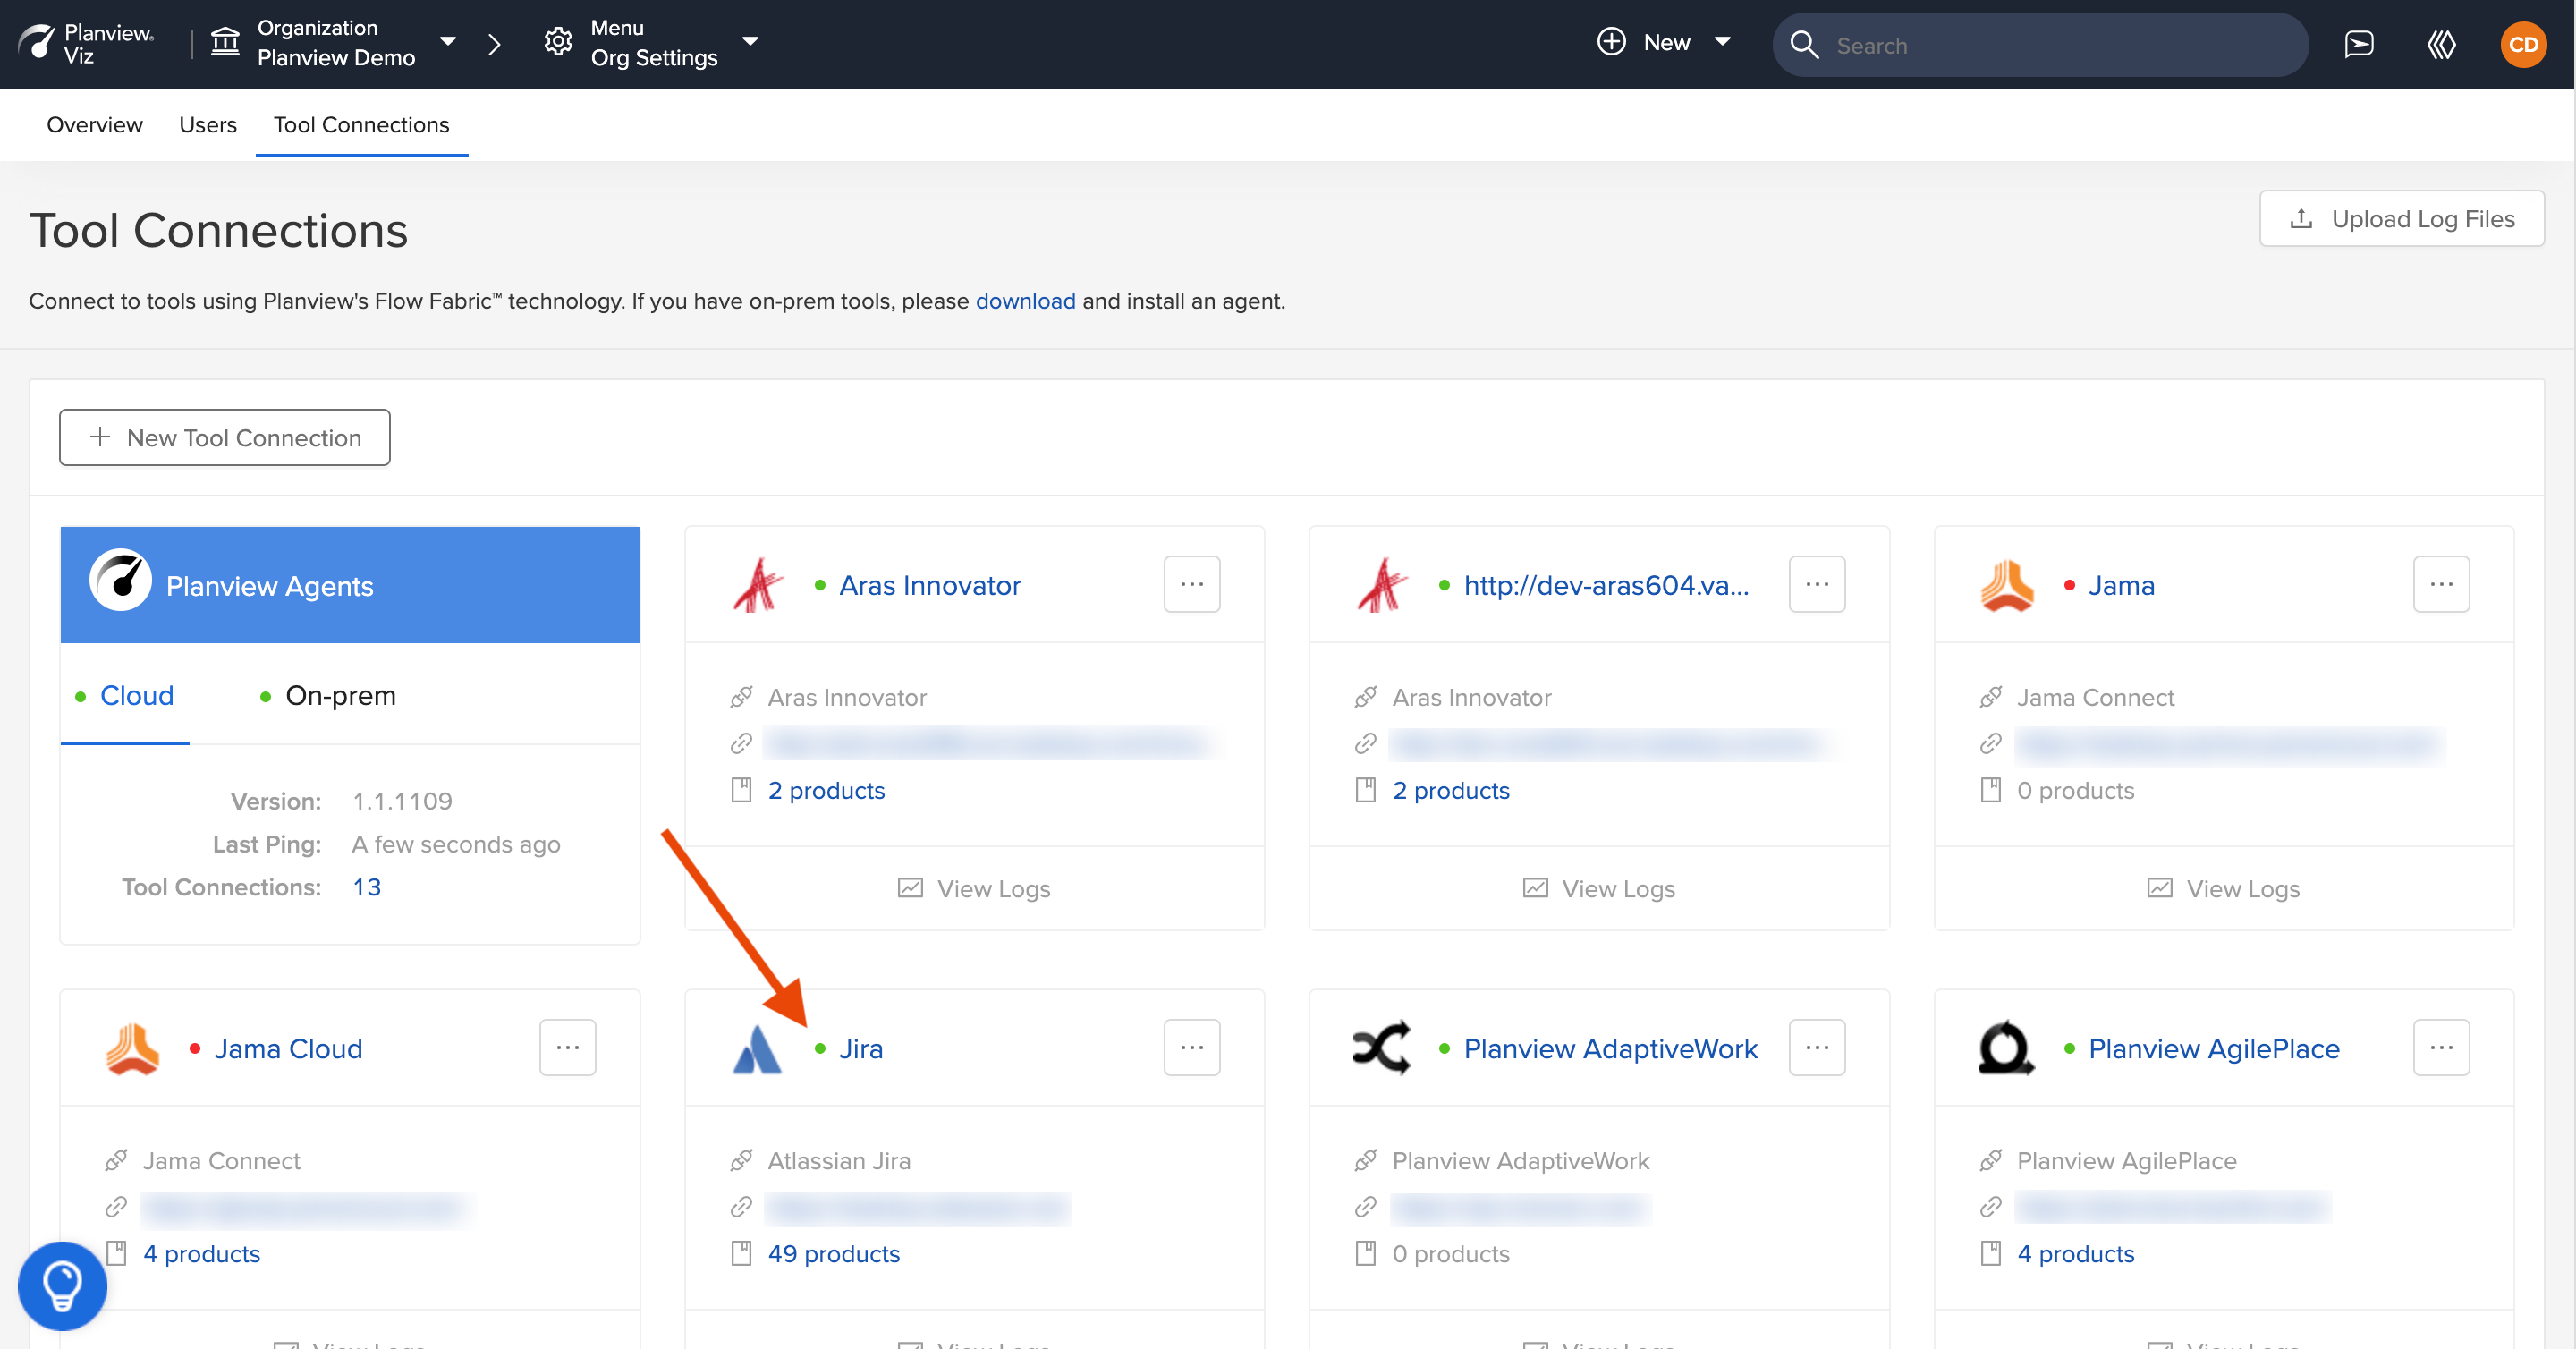
Agent is up
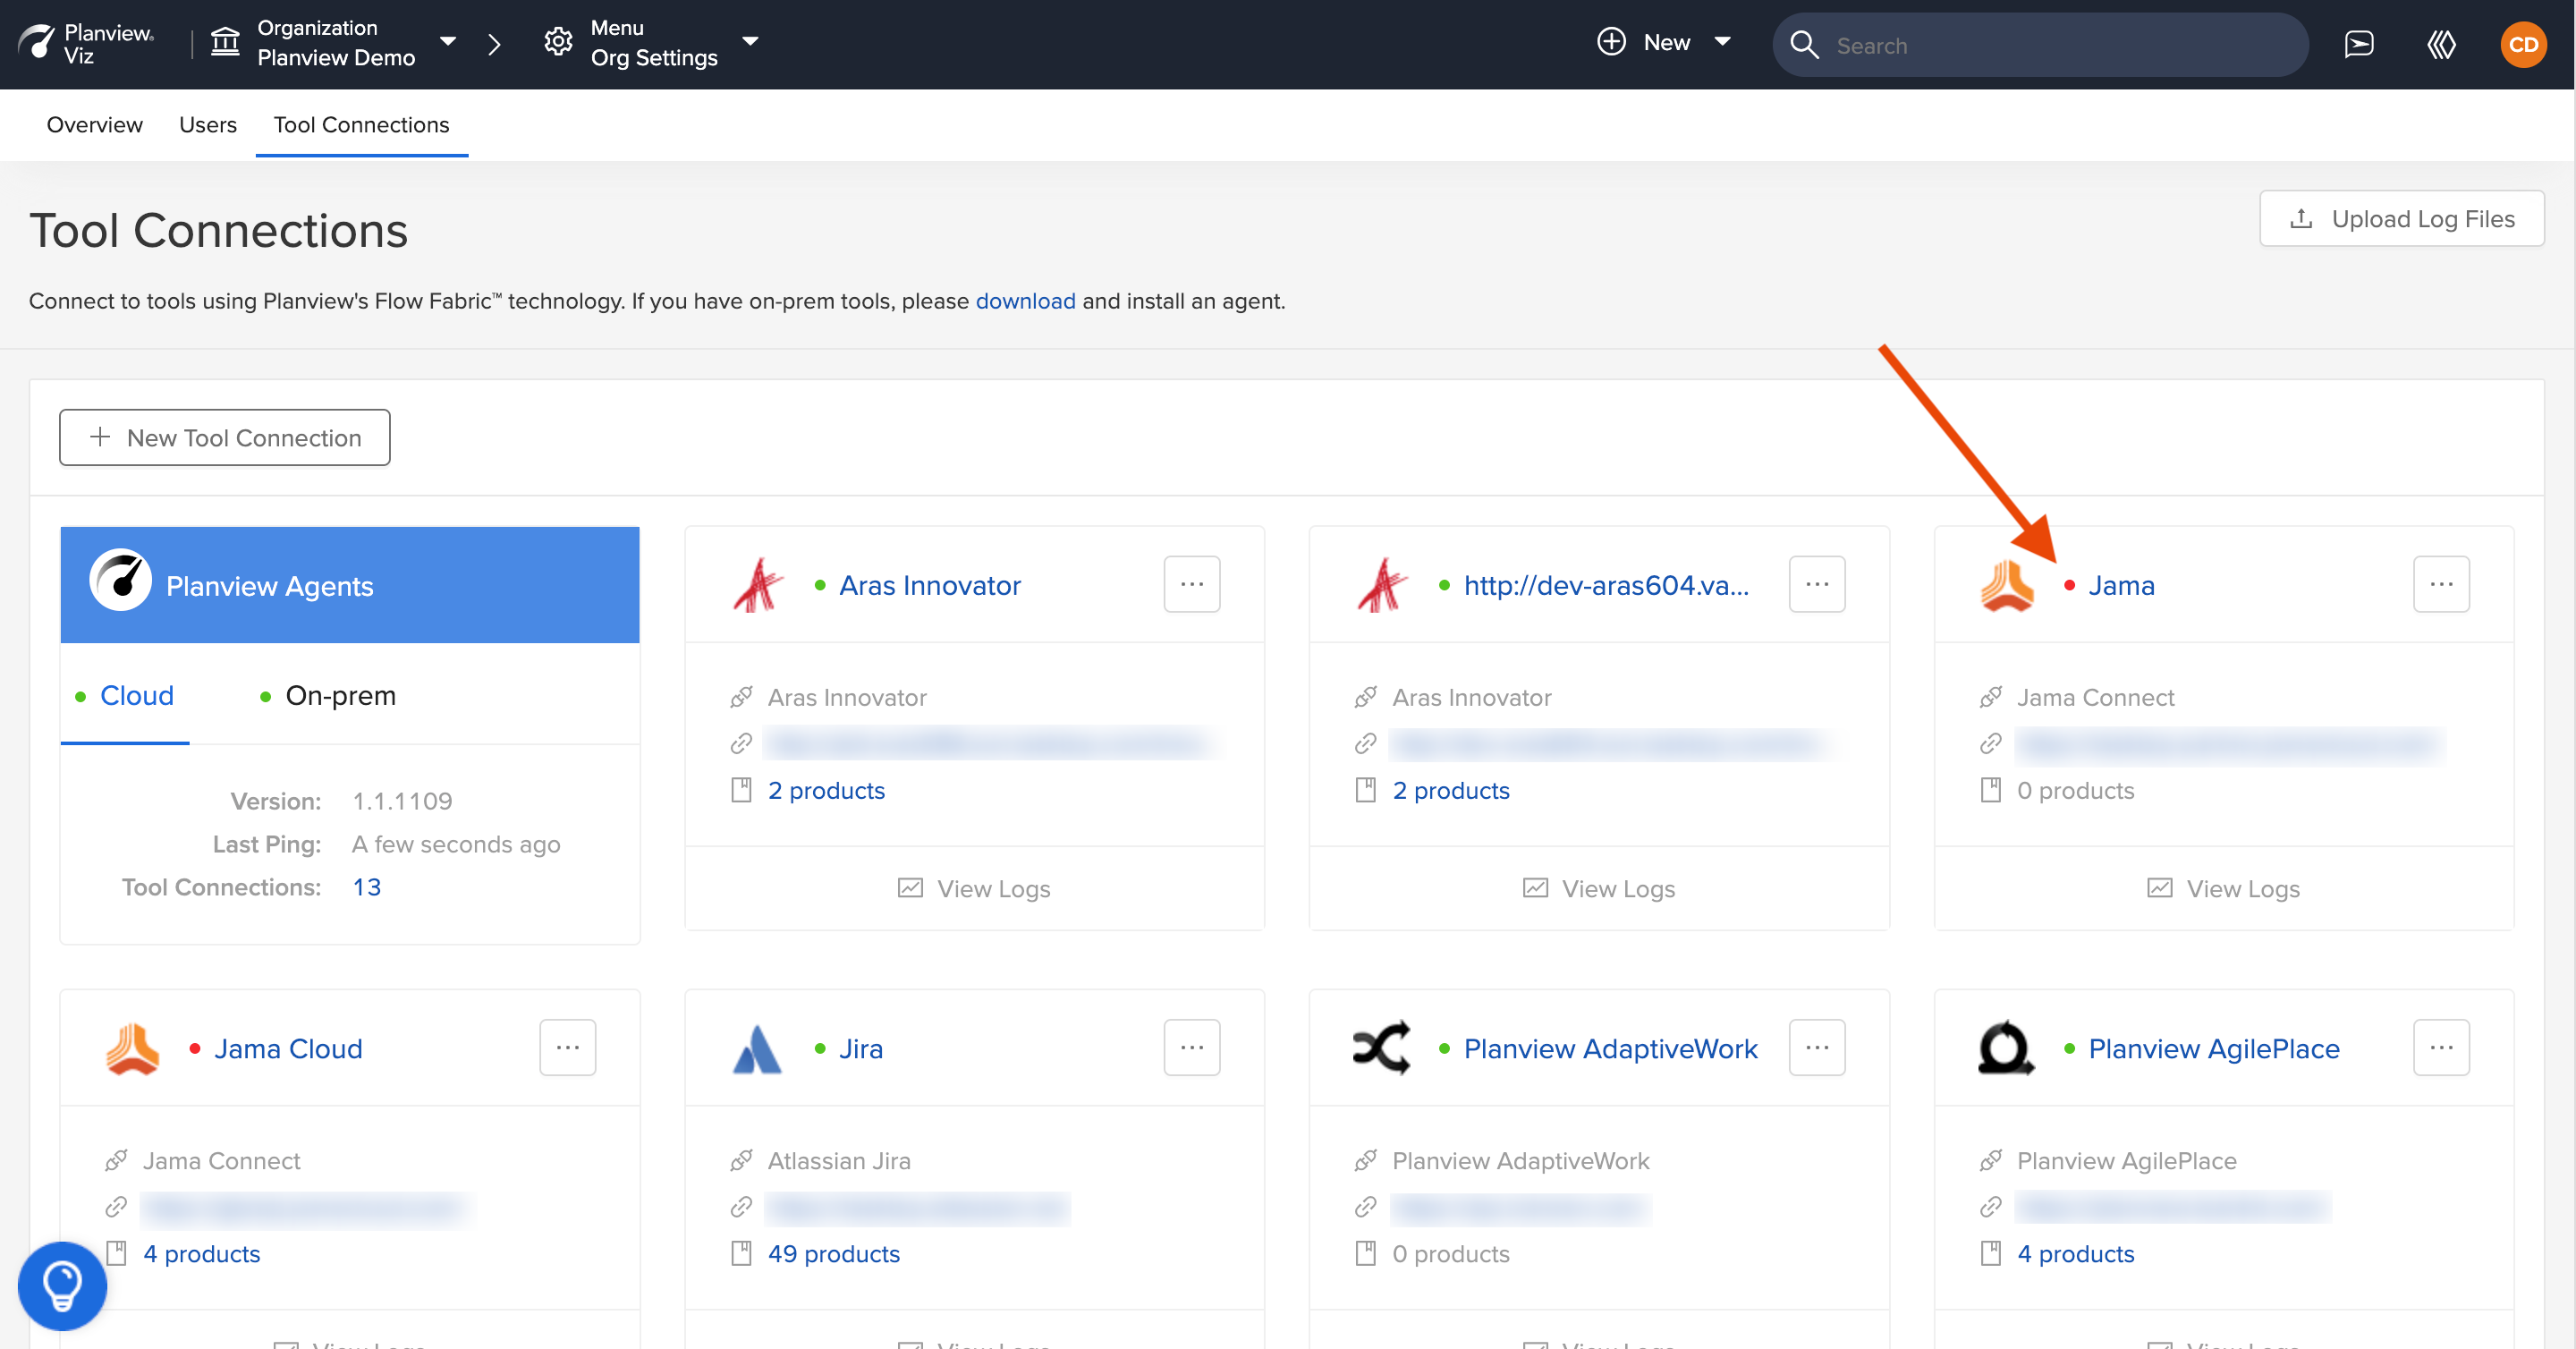
Agent is down
That's it! You've completed the final step of provisioning.
Next Steps
Now that you've completed provisioning, you can begin modeling your product value streams.