
Understanding Value Stream Management
What is Value Stream Management?
Value stream management (VSM) is the practice of observing, adjusting, and improving how organizations work, to drive the right ideas to impact as efficiently as possible.
Benefits of VSM:
- Ensures that teams are working on the right things
- Uses standard practices and metrics to improve productivity
- Finds and reduces waste, risk, and idle time due to dependencies
- Quickly incorporates feedback to adjust plans
Learn more about VSM in the video below.
Why are organizations adopting Value Stream Management?
Value stream management addresses business transformation by:
- Improving customer satisfaction and returning more value to the business
- Reducing lead time and waiting time
- Reducing spend and eliminating waste
- Increasing throughput and improving efficiency
- Increasing predictability
- Managing using data and measuring consistently
- Reducing risk and defects
Learn more about why organizations are adopting VSM in the video below.
How does Value Stream Management work?
Everything of value starts with ideas, whether those ideas are for a new product or feature, an improvement to a service, or simply fixing something that isn't working correctly. The world is full of good ideas, but what really matters is making a positive customer impact. That happens when a customer purchases or consumes your product or uses your service.
The goal of value stream management is to drive the right ideas to impact as efficiently as possible. The more quickly an organization can get its ideas to impact, the faster it can take advantage of the most important element of this process, customer feedback.
Organizations have no shortage of ideas, but most ideas never have an impact. This happens all the time. A requested product or feature gets old before being developed, a competitor gets to an idea first, or a technology change leaves a company behind. Companies know that driving ideas to impact is a challenge. And what are they doing? For many, implementing Agile is one answer, but challenges remain.
So how do we solve this problem?
First, let's introduce a concept you may already be familiar with, flow.
Flow is the movement of connected work from one step to another. For example, passing a requirements specification from a product manager to an engineer. Or, handing a sales document from a contract specialist to a sales rep.
Understanding flow is essential to achieving business transformation. The more an organization can optimize its flow, the better it will be at delivering value and gaining customer feedback, leading to a more effective transformation. Organizations get to optimal flow gradually by starting at a basic Flow Maturity level and then improving.
Learn more about how VSM works in the video below.

You can learn more about flow in the next section, Flow and the Value of Visibility.
Flow and the Value of Visibility
In the section above, we've explored key concepts of value stream management. Now, let's look at a real-life example to better understand flow and the value of visibility.
Learn more in the video or sections below.
Value Stream Management in Practice
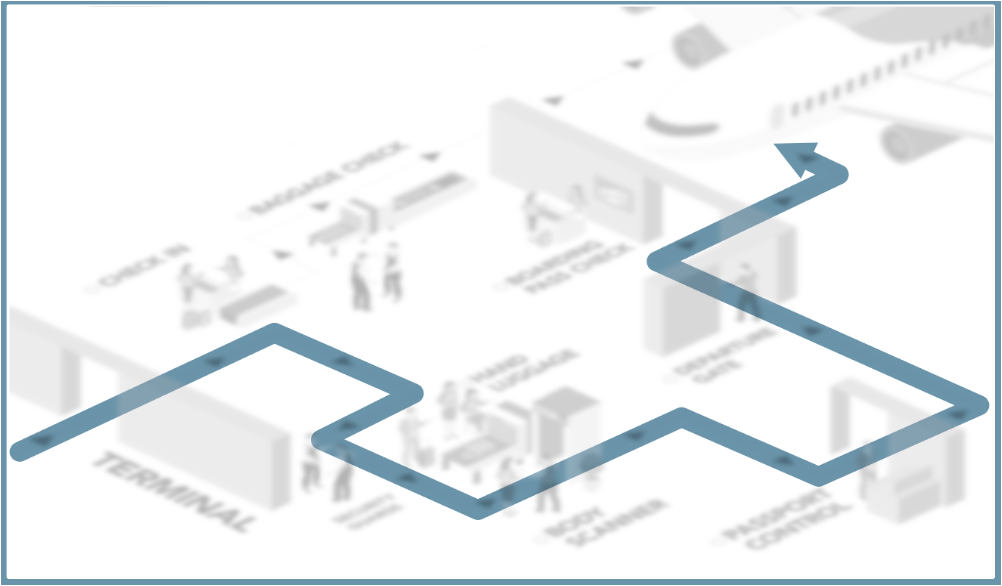
Imagine that you're managing the check-in and security processes at a busy airport and your challenge is to reduce the time from entering the terminal to boarding the plane.
Let's see how we address this situation using value stream management.
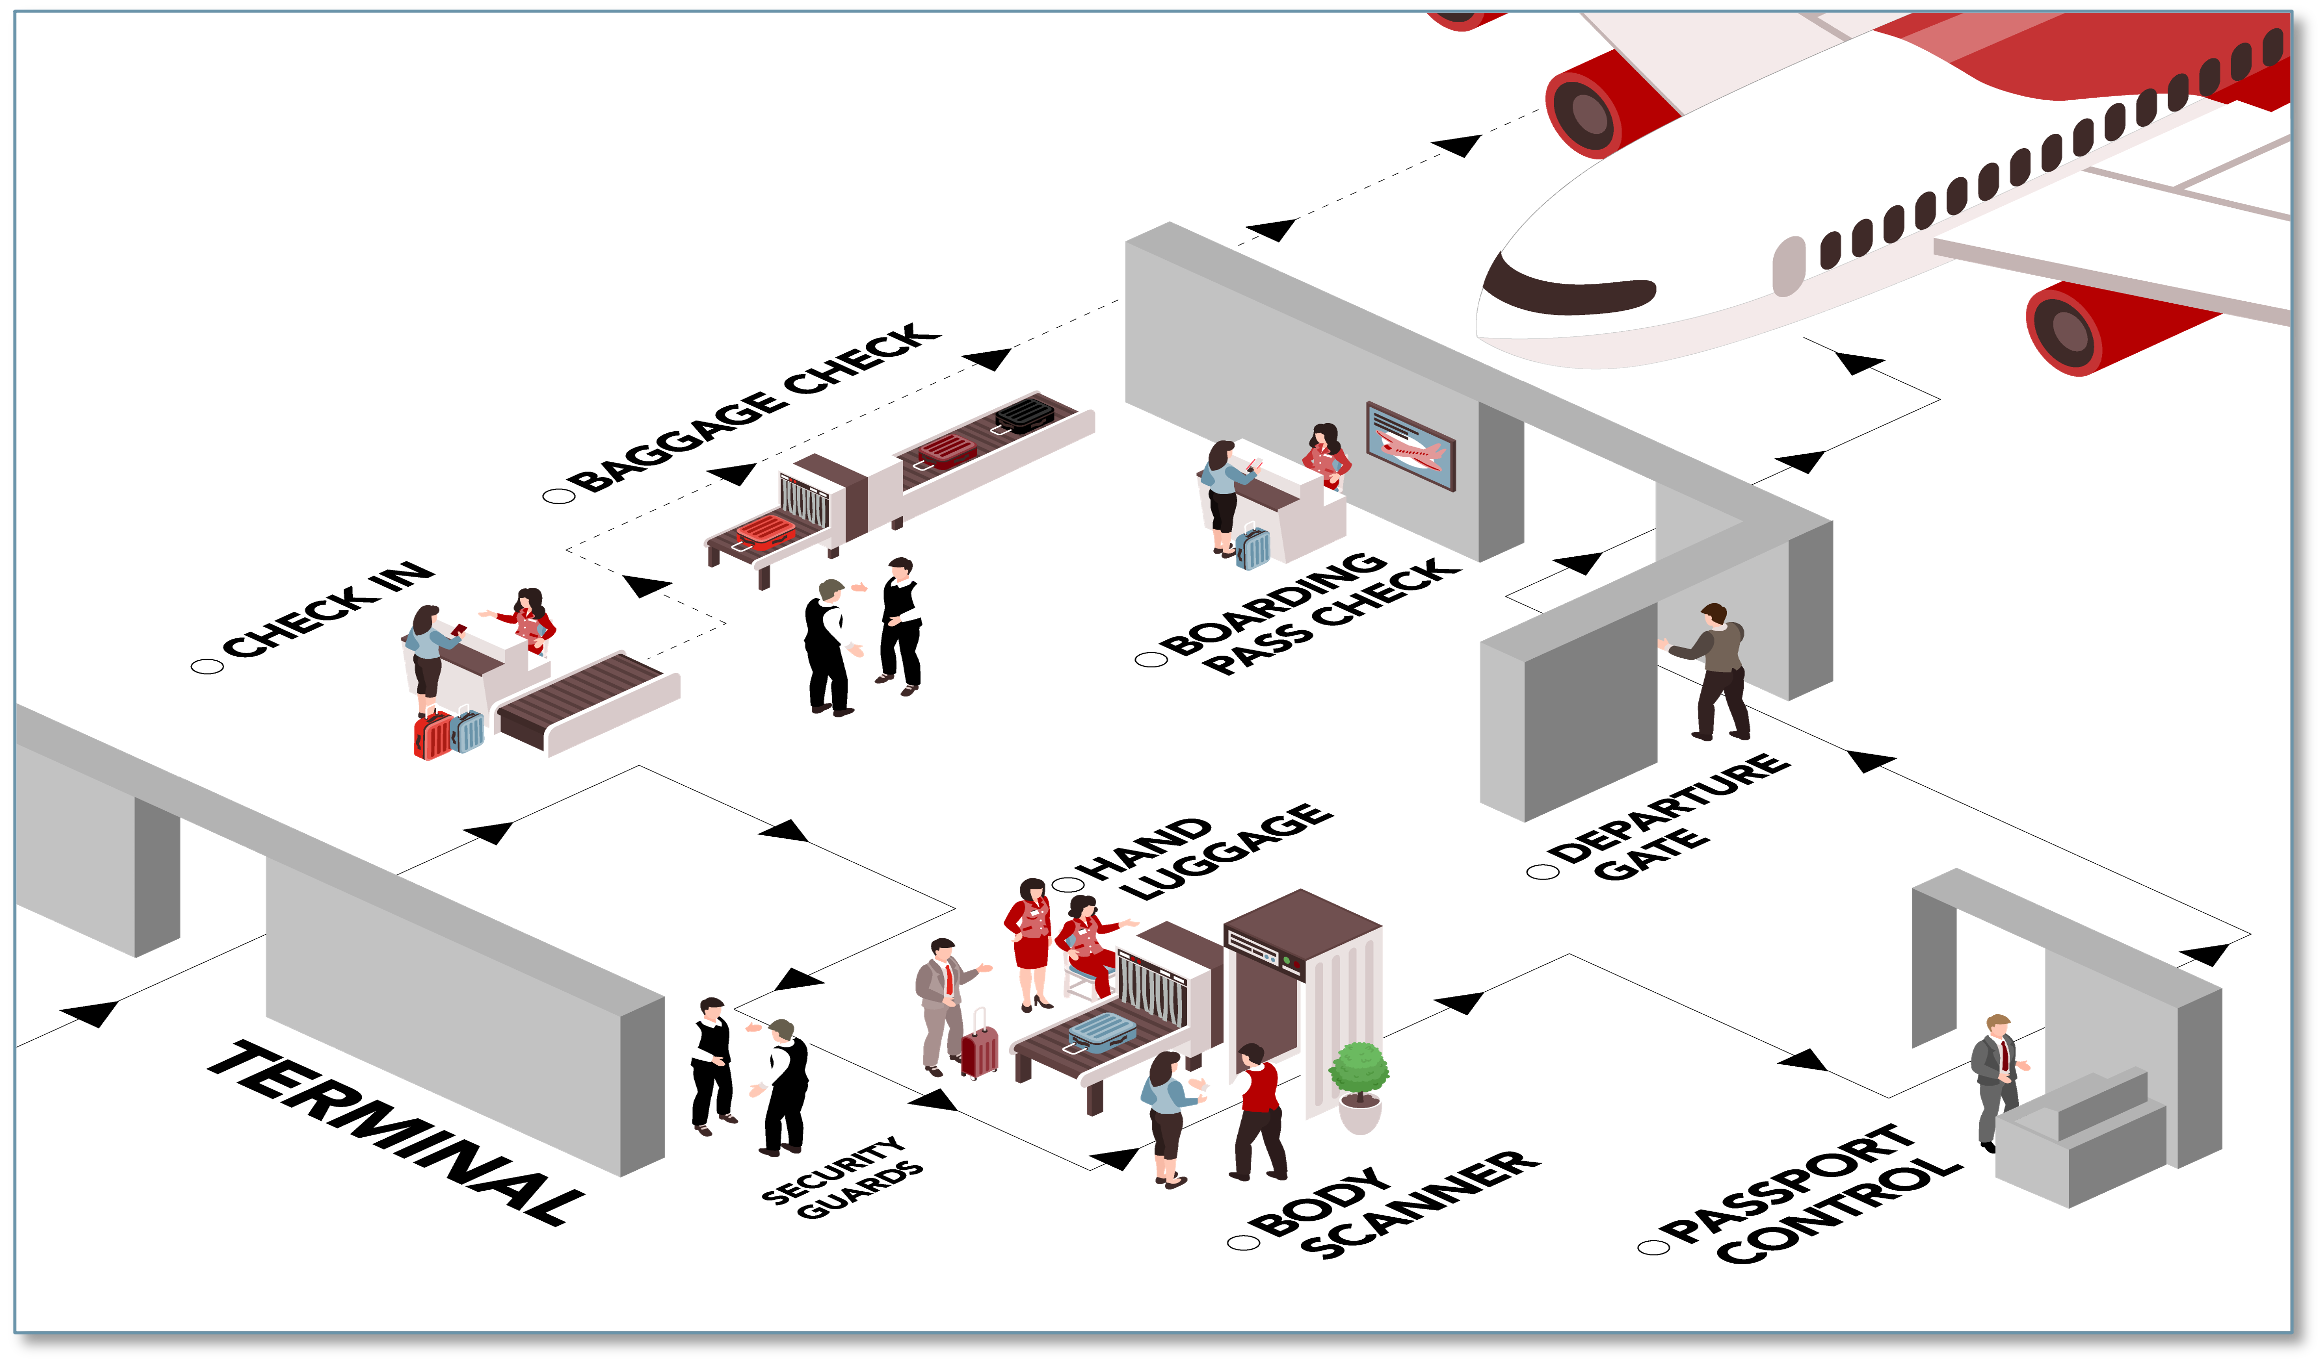
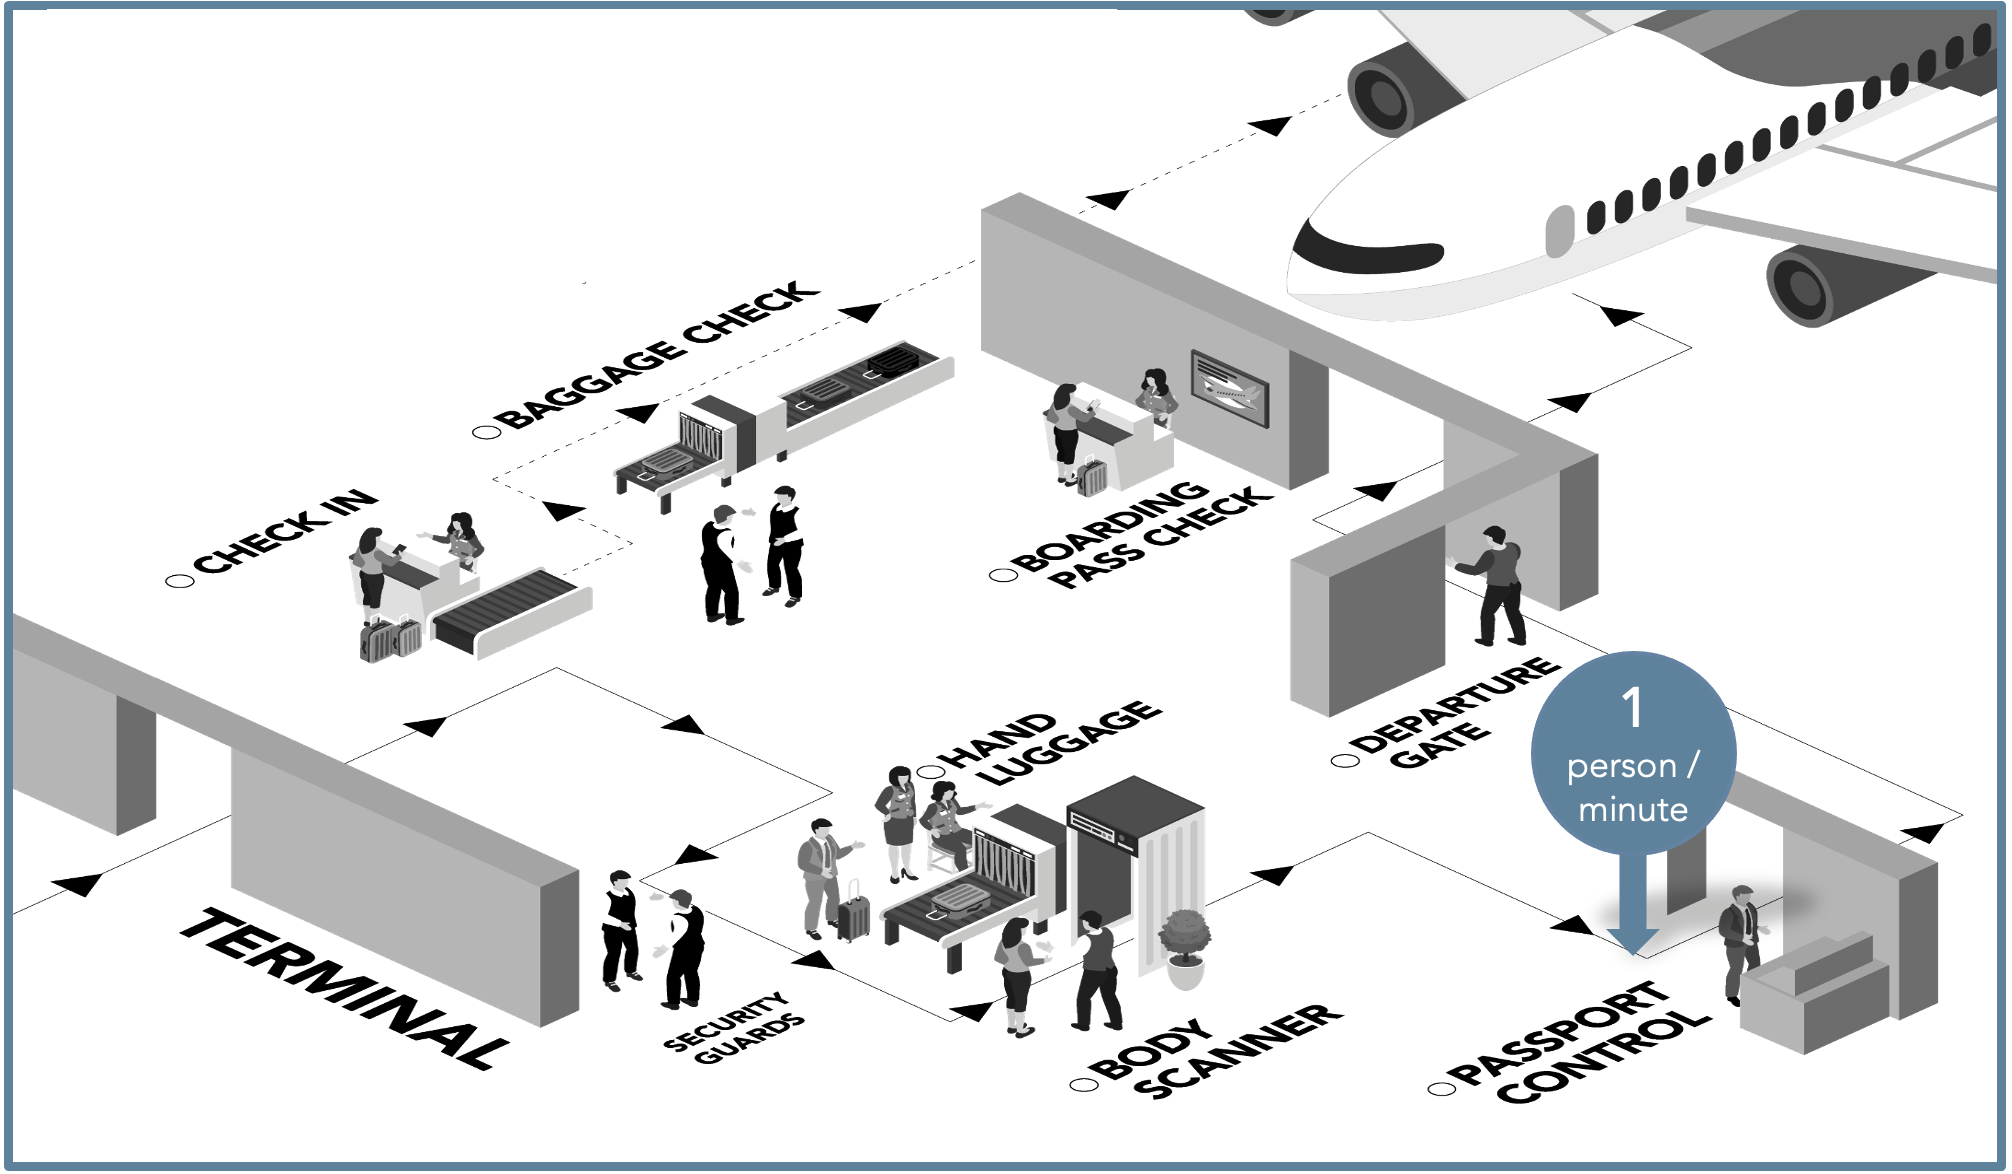
The first thing we need to do is scope out what we are optimizing. In this case, it's all the connected steps one must take — from entering the terminal going through security and passport control to be at the gate and ready to board. We call that set of work a value stream.
A value stream is the end-to-end movement of connected work (flow) to deliver value to a customer through a product or service. In this example, the value being delivered is an identified, ticketed, and screened passenger ready for boarding — and the product or service is all the steps that have been performed.
Now, let's figure out how to measure this process so we can optimize it.
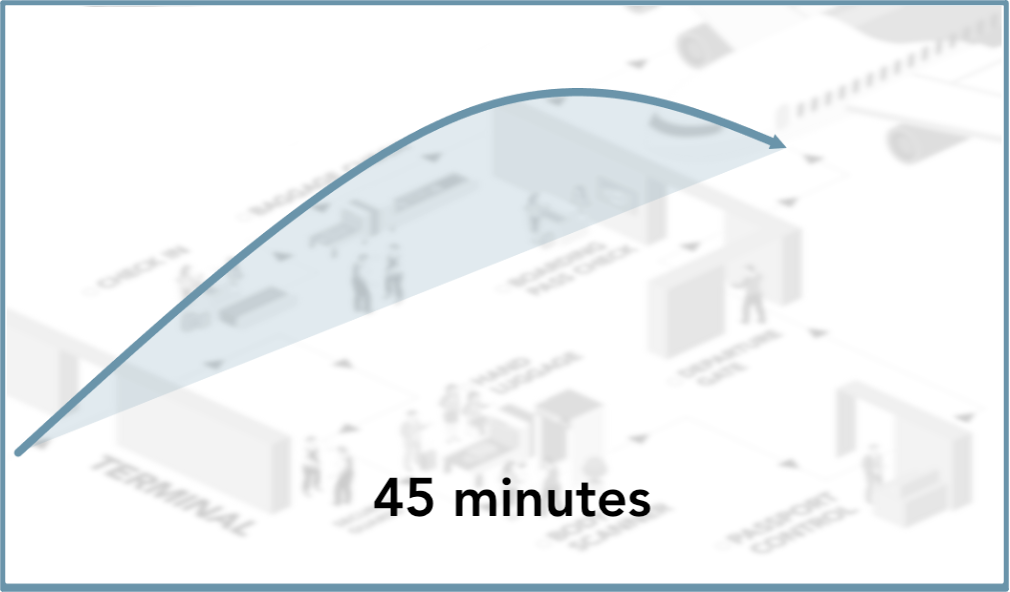
We'll start with the time it takes for one person to complete the check-in, security, and passport processes and be ready for boarding. In our example, it's 45 minutes. We call this metric, Flow Time.
Flow Time is how long it takes to achieve value, from start to finish.
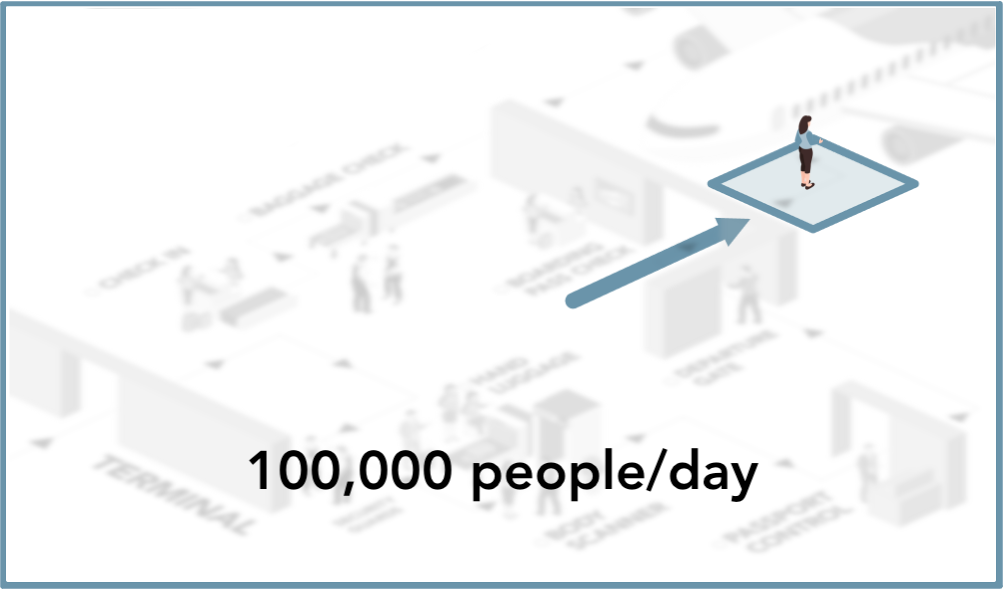
The next thing we'll want to measure is the rate of people making it through all the process steps. In our example, our busy airport processes 100,000 people per day. This metric is called, Flow Velocity®.
Flow Velocity® is how much value is being delivered over a period of time.
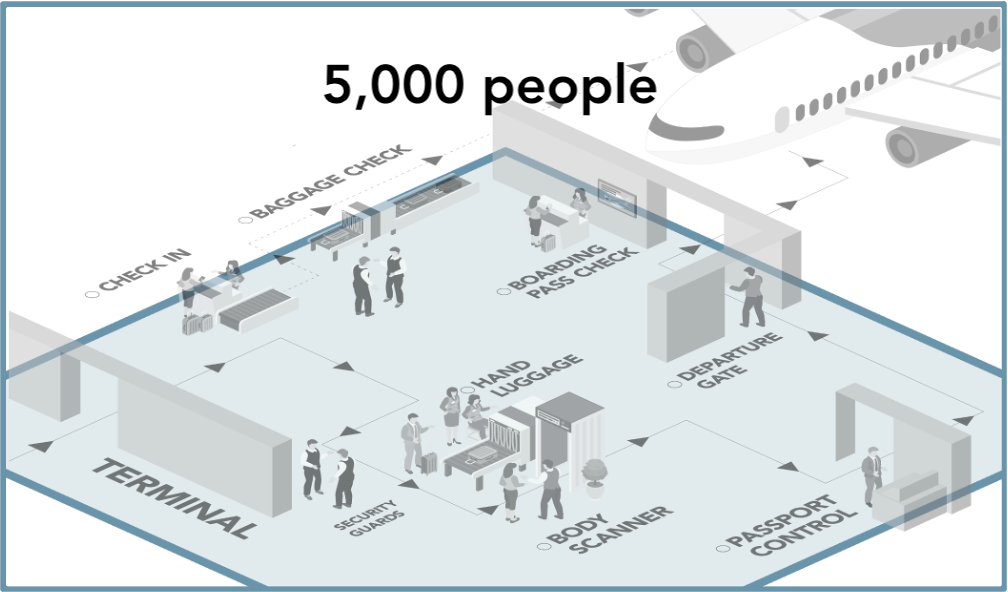
The third thing we want to know is the total number of people at any step, waiting to check-in, going through security, at passport control, or anywhere in between. It's a measure of how much work is planned. In this example, we expect that eventually 5,000 people will make it through to the gate. This metric is called, Flow Load®.
Flow Load® is a measure of how much value is in process of being delivered at a point in time. At this point, you should be able to see where we're going with this example. Every system has an optimal Flow Load®. If there are too many people, it gets too crowded and the process slows down. If there are too few people, then we are wasting resources that could be better spent elsewhere.
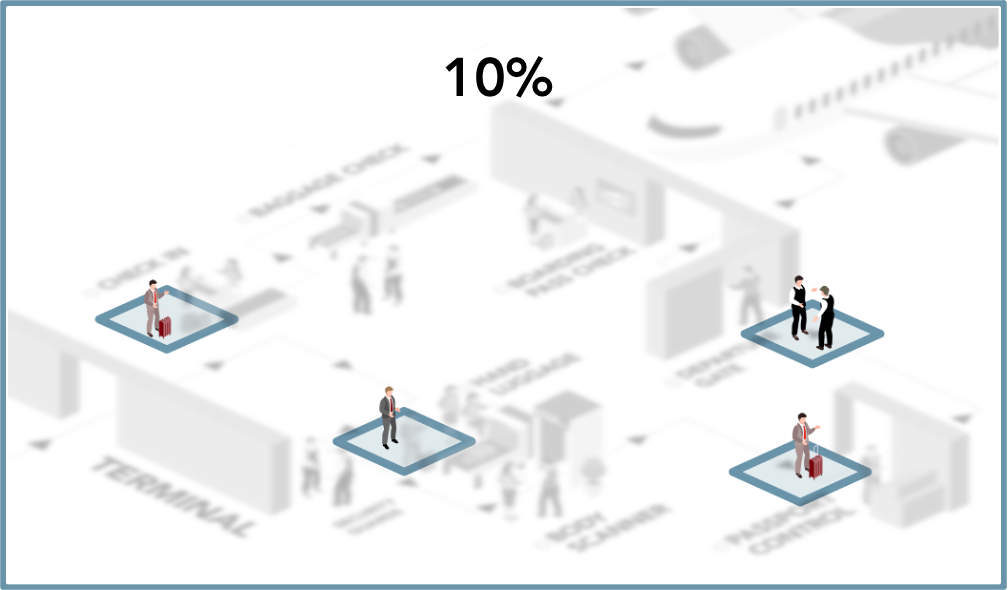
The fourth metric that we want to measure is how much of the time a person is actively checking in, passing through security, or going through passport control versus just standing around or waiting in line. In our example, that data is 10%. Meaning, 10% of each persons time is spent actively being processed and 90% of the time that same person is waiting. We call this metric, Flow Efficiency®.
Flow Efficiency® is a measure of how much of the total Flow Time is spent creating value. Obviously, the most efficient flows are the ones with the highest Flow Efficiency®, or the least amount of waiting. Another way to think about it is this, if each passenger didn't have to wait in line the whole process would take only 4.5 minutes not 45.
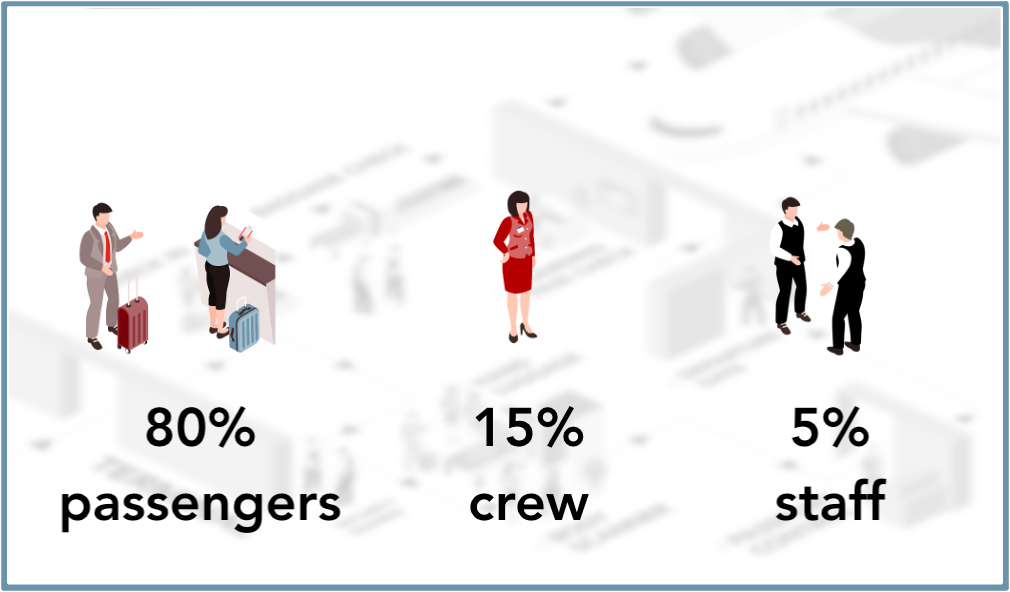
Finally, it's important to understand that the process requirements are slightly different depending on what kinds of people are being processed. For example, passengers, flight crew, and ground staff. In our example, we're processing mostly passengers, with some crew members, and even fewer ground staff. And so, our process is going to be set up to optimize for passengers. This final characteristic isn't technically a Flow Metric, it's called Flow Distribution®.
Flow Distribution® indicates what kind of value have been delivered. As we go into real life situations, managing Flow Distribution® becomes very important as different kinds of value streams will have different ideal Flow Distribution® and will need to be designed accordingly.
Flow Time, Flow Velocity®, Flow Load®, and Flow Efficiency® are the Flow Metrics and understanding them allows us to make informed decisions, rather than guesses on how to manage value streams.
See a quick summary of what we've learned so far in the table below.
|
Key Term |
Definition |
In this Example |
Metric |
|---|---|---|---|
|
Value Stream |
The end-to-end movement of connected work (flow) to deliver value to a customer through a product or service |
All the connected steps anyone must take, from entering the terminal, through check-in, security, and passport control, to be at the gate and ready to board. |
- |
|
Flow Time |
How long it takes to achieve value, from start to finish |
The time for one person to complete the check in, security, and passport processes. |
45 minutes |
|
Flow Velocity® |
How much value is being delivered over a time period |
The rate of people making it through all the process steps. |
100,000 people/day |
|
Flow Load® |
How much value is in process of being delivered |
The total number of people at any step at a point in time. |
5,000 people |
|
Flow Efficiency® |
How much of the total Flow Time is spent creating value |
The amount of time a person spends actively processing check in, security or passport control, versus waiting. |
10% |
|
Flow Distribution® |
What kinds of value have been delivered |
The different categories of people currently in process. |
80% passengers 15% crew 5% staff |
Let's get back to our challenge, how to reduce the time to boarding.
Let's say we have enough resource now to invest in optimizing just one step. Where should we invest?
Without data to make an informed decision, we can't know. This situation is where many organizations are today. They just don't have the data to make an informed decision.
Okay, so let's look at the Flow Velocity® at each step.
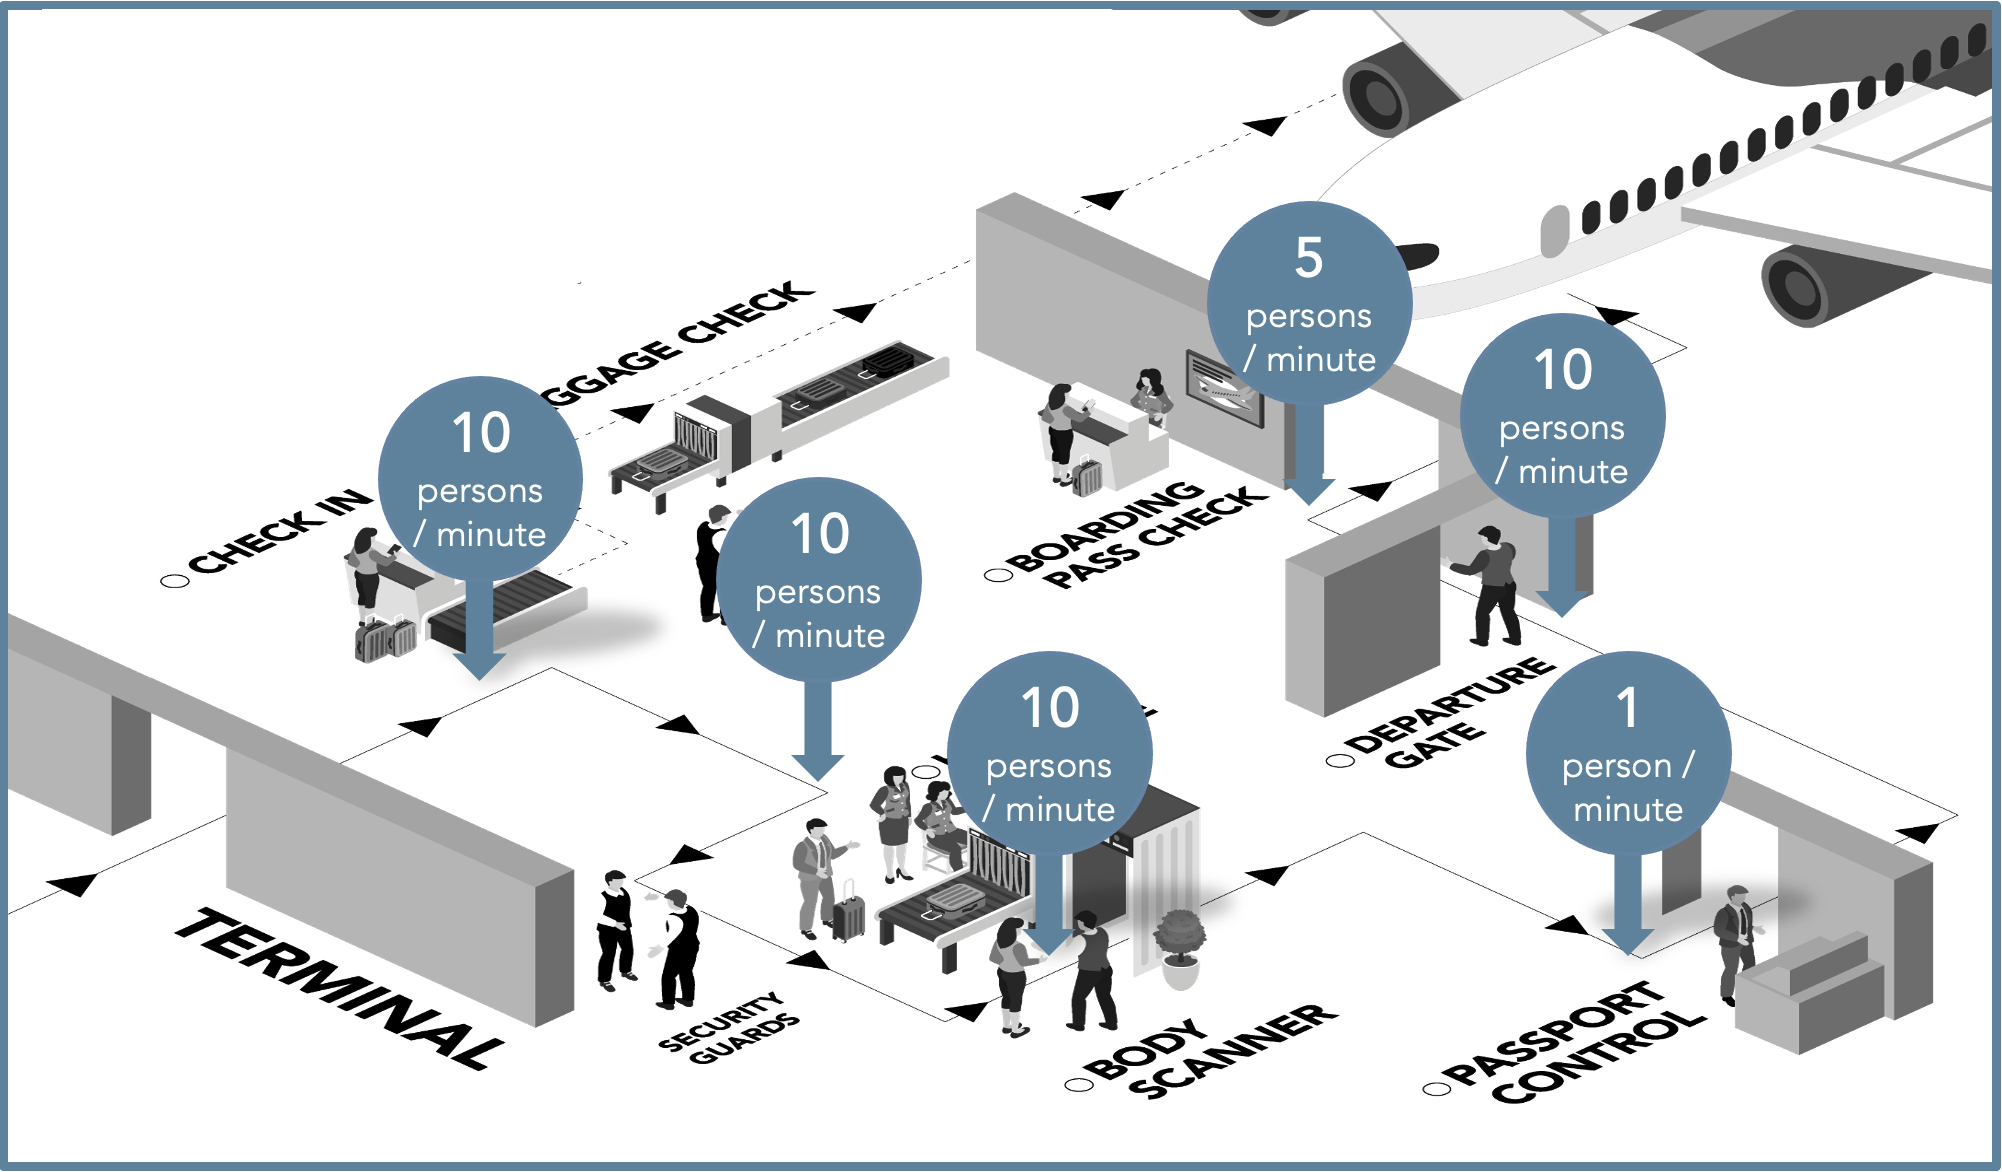
Now it's simple. If you look carefully, you'll see the constraint — the one area that's holding up all the other areas — passport control. With just one person processed per minute, it's clear that passport control is the area where we should invest.
Now we start to see the value of visibility. Without data and Flow Metrics, there is no hope of optimizing the idea to impact process. In the real world, it's easy to see where work is piling up. You see the longest line and you quickly know to go and stand in another line. But in the world of knowledge work, this behavior is hidden. That's why it's so important to have a system that brings visibility to Flow Metrics.
Potential Improvements
Before we conclude this section, let's discuss some potential improvements provided by added visibility.
Visibility means recognizing potential improvements and pinpointing where to improve.
There are three key potential improvements that customers can gain visibility into:
- Flow Velocity® improvement: This indicates the potential to deliver more value.
- Think of this as a virtual extension of your team; you're getting more without having to hire more. A 10-30% improvement can lead to avoiding costs of $1M - $3M for a value stream of 50 FTEs.
- Flow Time improvement: This indicates the potential to deliver value more quickly.
- It's important to understand the value of time-to-market. Getting value to customers 10 to 45 days earlier on a value stream that produces $20M annually could result in additional value of $550K to $2.5M.
- Bottleneck Improvement: The indicates the potential to remove impediments to your process.
- An organization employing process consultant may be wasting effort by looking at non-bottleneck areas. By removing waste, an organization may save 20% or more on consulting expenses.
These are just a few examples of how making flow visible can have a tangible impact on your day-to-day operations.
Next Steps
Learn strategies for optimizing your flow in the next section, Flow Maturity.
Share your feedback
Do you have any suggestions that can help us improve this page? Let us know.