
Portfolios process flows
Overview
This guide provides an overview of how organizations can use the benefits realization capability to track and measure the value of their products, initiatives, and investments in Planview Portfolios. It walks through key steps in the process —like rolling up financials, reviewing progress against baselines, and analyzing key results and roadmaps— to help ensure that planned benefits are actually delivered. It also highlights reporting tools and dashboards that provide visibility into financial performance, forecast trends, and investment outcomes.
Process steps
| Process step | Description |
|---|---|
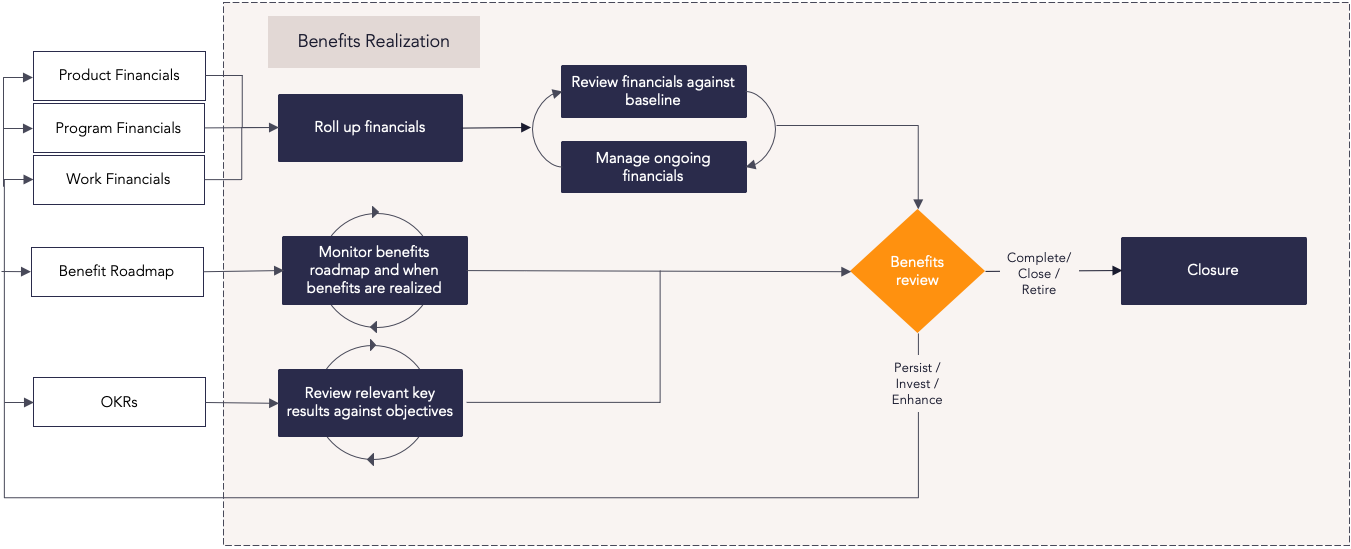
| Roll up financials (product, program, work) | The purpose of this step is to summarize costs and benefits to date by rolling up financial planning data from work and programs to products, strategies, outcomes, and any other entities. |
| Review financials against the baseline | The purpose of this step is to monitor the realization of the financials using a comparison against the baseline in order to track any variance. Users should harness this information to make well-informed investment decisions and any appropriate corrective actions. Financial planning detail will have been updated with the appropriate budget and target data during the funding and financial planning process and a financial baseline will have been taken. |
| Manage ongoing product financials |
As financials are monitored and compared against the baseline so both forecasted and actual information can be managed going forward. |
| Review relevant key results against objectives | Key results allow you to capture and track progress toward your objectives. Project, product, and portfolio managers should periodically review the current state of key results to see if progress is being made towards relevant objectives. |
| Review benefits roadmap | Roadmaps lets you track benefits over time and understand when benefits will be realized. Project, product, and portfolio managers can add benefits to the roadmap at the appropriate date, and link to relevant AgilePlace cards. |
| Benefits review |
This step represents a decision point. Review the expected benefits against the actual results realized. How do they match up? Are your original plans still valid? Do the stakeholders want to see anything else? Based on the information, strategic decisions can be made on whether to persist, enhance, fund, or retire investments. |
| Closure | The investment goes through the appropriate closure process. |
Reports
How are we able to understand all cost and benefits forecasts for programs and projects across the organization?
| FastTrack Power BI Showcase Dashboards – Strategy – Strategy Financial Analysis | Power BI Dashboard | This dashboard shows the forecasted costs of strategic initiatives and programs in select portfolios, allowing you to identify the trend of forecasted costs over time. You can configure the dashboard to slice and display data in numerous ways. |
| Strategy Portfolio – Portfolio Manager –Customizable Column Set | Tile | This allows you to see strategy data in a customizable column set, including roadmaps, financials, effort, and more. |
| STR31 – Strategic Portfolio Cost and Benefit Analysis | Analytic | This report analyzes program data and summarized portfolio financial plan data, with effort represented as FTEs, days, and hours, and financials as cost, benefits, and revenue. You can slice data by strategy attributes, account structure levels, or line attributes of selected accounts. The report can be configured to run against each level in the strategy structure. |
| STR32 – Strategic Portfolio Financial Performance | Analytic | This report compares versions of the strategic program and summarized portfolio financial plan data, with effort represented as FTEs, days, and hours, and financials as cost, benefits, and revenue. A burndown chart is included for the portfolio and each initiative. You can run the report against each level in the strategy structure. |
| STR33 – Strategic Initiative Pipeline Matrix | Analytic | This report can select cost, revenue, or benefit-based measures from the financial planning data to drive bubble size and visualize the pipeline of strategic initiatives. You can configure the report to run against each level in the strategy structure. |
| STR34 – Strategic Portfolio Investment Risk and Reward | Analytic | This report is based on financial plan data and allows you to select benefit or revenue measures for the x-axis, a risk-based attribute for the y-axis, and cost-based measures for the bubble size. You can configure the report to run against each level in the strategy structure. |
| FastTrack Power BI Showcase Dashboards – Work | Power BI Dashboard |
This dashboard displays a range of out-of-the-box Power BI visualizations for the Financial Summary, Portfolio Balance Count, and Portfolio Balance Cost dashboards. Detailed information for each visualization is provided, highlighting the configuration steps required to recreate the visualization. |
|
Work Portfolio – Portfolio Manager – Customizable Column Set |
Tile | This column set gives you an overview of work items in a portfolio and their details, including synced AgilePlace boards, start and finish dates, and percentage complete. |
| WRK14 – Project and Portfolio Highlight Report | Analytic |
This report summarizes key project information into a one-page report for stakeholders and project review meetings.
You can run the report for a single project or across the portfolio. The portfolio report includes an executive summary on the first page, followed by one-page summaries for each project on individual pages. |
| WRK31 – Work Portfolio Financial Analysis | Analytic |
This report analyzes project and portfolio financial plan data, with effort represented as FTEs, days, and hours, and financials as cost, benefits, and revenue. The report uses a single version of the financial plan and a data type based on project attributes, account structure levels, or line attributes of selected accounts. |
| WRK32 – Project/Work Portfolio Financial Burndown Comparison | Analytic |
This report compares versions of project and work portfolio financial plan data, with effort represented as FTEs, days, and hours, and financials as cost, benefits, and revenue. The report includes the following:
|
| WRK33 – Project Cost or Revenue/Benefit Bubble | Analytic | This report can select cost, revenue, or benefits-based measures from the financial planning data to drive bubble size. |
| WRK34 – Work Portfolio Investment Balance Bubble | Analytic | This report identifies the risk and reward balance across projects. You can select benefit or revenue measures for the x-axis, a risk-based attribute for the y-axis, and cost-based measures for the bubble size. The report can run against each level in the strategy structure. |
| Outcome Portfolio – Portfolio Manager – Customizable Column Set | Tile | This customizable column set allows you to see an overview of the outcome breakdown, including total cost of ownership, labor costs, status assessment, and more. |
| OUT31 – Outcome Portfolio Revenue and Cost Analysis | Analytic | This report analyzes program data and summarized portfolio financial plan data, with effort represented as FTEs, days, and hours, and financials as cost, benefits, and revenue. The report uses a single version of the financial plan and a data type based on project attributes, account structure levels, or line attributes of selected accounts. You can configure the report to run against each level in the strategy structure. |
| OUT32 – Outcome Revenue/Cost Forecast Performance | Analytic | This report compares versions of outcome data and summarized portfolio financial plan data, with effort represented as FTEs, days, and hours, and financials as cost, benefits, and revenue. The report includes a burndown chart for the portfolio and each initiative. You can configure the report to run against each level in the strategy structure. |
Best practices
Assign a benefits owner
Assign someone who will be accountable for realizing benefits once benefits projections have been evaluated. This role includes creating the business case and further refining projected benefits, collecting and reevaluating data at key project gates, and then reporting how benefits perform against the baseline.
State the benefits clearly
State clearly in your business case what the expected benefits are, how they will be measured, and a timeframe for their realization. This will gain buy-in from key stakeholders and make reevaluation and reporting easier during execution and delivery, especially for intangible benefits like customer satisfaction and brand awareness.
Rank your benefits
Create a ranking order for your expected benefits. Having a ranking order determines which benefits you will track in the greatest depth and which metrics will most contribute to the overall health of your benefits realization.
Measure around the milestones
Determine a cadence for measuring and reporting benefits to track progress and detect potential issues. Since benefits can begin realization once projects, programs, or products are delivered, using the expected delivery dates of key projects can provide a baseline schedule.
Commit to delivery
Effectively communicate the final goals and benefits to your teams to ensure they commit to achieving the benefits. Understanding and committing to the benefits will aid in alignment between teams and managing unexpected changes.
Conduct a debrief
Hold a benefit debrief through surveys, in-person meetings, or a combination of both. Review the organization’s performance and evaluate how to implement new knowledge. These discussions should examine questions such as whether benefits projections were optimistic or pessimistic, if projections were accurate, if execution was mindful of the benefits, and more.