
WRK32 - Project/Work Portfolio Financial Burndown Comparison
- Last updated
- Save as PDF
Overview
- Single project and work portfolio report that allows the comparison of one/many versions of project and portfolio financial plan data, including effort (FTEs/Days/Hours) or financial data (Cost/Benefit/Revenue). Includes a burn down chart for the whole portfolio and for each project.
- The report includes;
- Portfolio based summary time phased chart showing the financial profile (based on one/many financial plan versions) across the whole portfolio (example shown in first image)
- Project level time phased chart showing the financial profile (based on one/many financial plan versions) for each project (example shown in second image)
- Detailed data tables
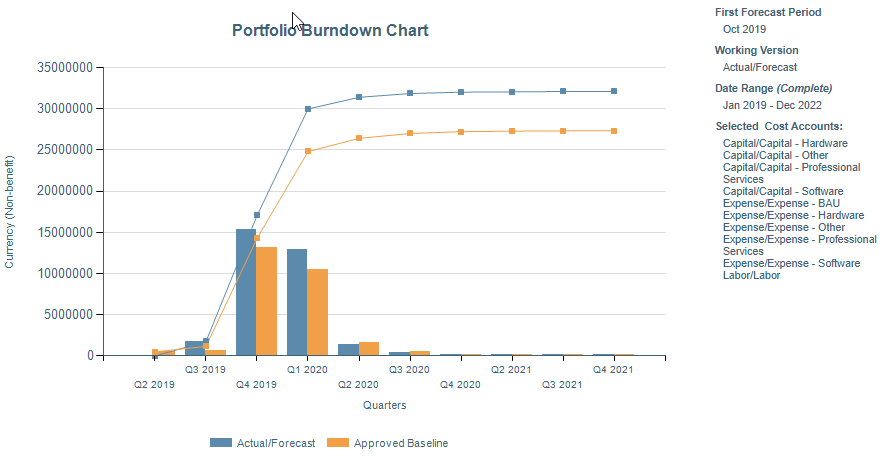
WRK32 Portfolio example
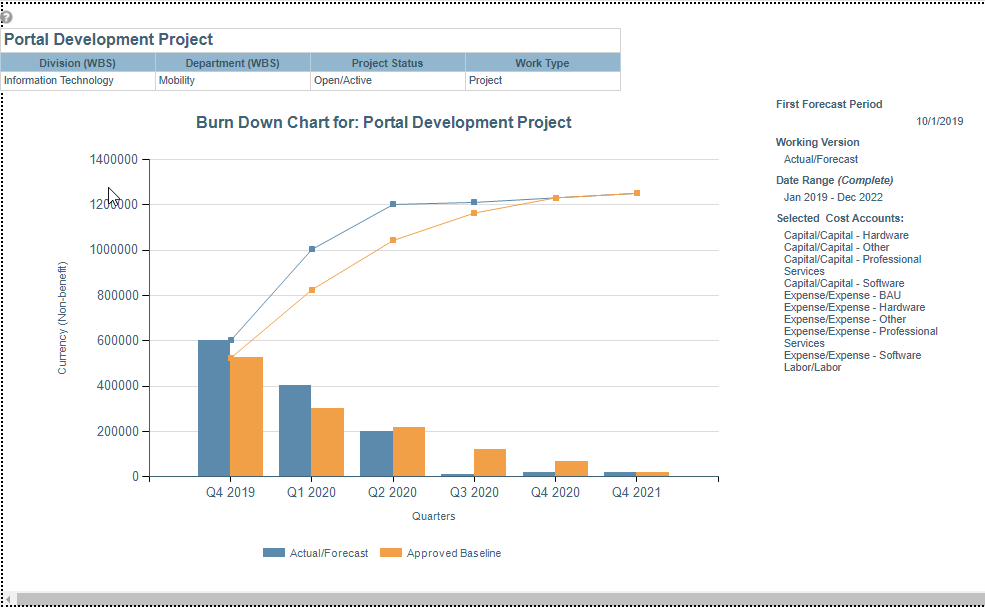
WRK32 Project example
Business Outcomes
- Tracking of project actual burn and forecast burn to ensure that spend/effort/revenue/benefits are in line with projections.
- Enable comparisons between stage gate baselines/snapshots to track variances in project cost and revenue profiles as project moves through the stage gate lifecycle, driving improvements in forecast accuracy.
- Identify investments that are performing badly as they move through execution so that they can be considered for a Go/Kill decision at stage gates.
Supporting Capabilities
- Financial Management
- Project Monitoring and Status
User Parameter Configuration (for Administrators)
| Parameters | Description | Configuration Options | Default/Example Settings |
| Currency | Currency in which the amounts should be displayed | There are several values only if the multi currency option is enabled. Default is the system default currency | Default cannot be changed |
| Working Version | Version to consider (This version will appear first) | Default is the version specified in the version_id parameter (or version marked as forecast otherwise) | Version_id= |
| Compare to version(s) | Comparison version(s) to consider | Use the following syntax to set the default financial version for comparison:
|
Default is version marked as baseline unless overridden |
| Financial Measure ☑ For Versions v2.5.0 + |
This parameter controls the unit of measure to display in the report | A default can be set using:
the Cost from the financials. Currency (Benefit) will show the benefit or revenue from the financials. Units will show the unit value of the financial account. |
The default FastTrack configuration is set to:
|
| Financial Measure ☒ For Versions Prior to v2.5.0 |
Unit to use to display the numbers | Values are:
|
fm_measure=amount |
| Financial Category | Specify whether costs or benefits/revenues should be displayed | Values are:
|
Financial_category=cost |
| Account Types | Specify the account types that should be considered | This is multi select parameter Values are:
|
There is a line for each possible value: account_type=ACTP$EXP account_type=ACTP$CAP account_type=ACTP$LAB |
| Accounts | Specify the accounts that should be considered | This is a multi select parameter This list takes into account the account type parameter | Default cannot be changed |
| Period/Ending Starting | Starting/Finishing Month for the interval | Default=Horizon start of the Financial Model Default=Horizon Finish of the Financial Model |
Default cannot be changed |
| Chart Detail Metric By | Timescale to use for the trend chart | Values are:
|
Default depends on the interval size (number of periods between Period Starting and Period Ending) |
Hidden Parameter Configuration (for Administrators)
| Parameters | Description | Configuration Options | Default/Example Settings |
| Table Columns | 2 columns before and 2 columns after the project name can be defined | It is recommended that WBS parent levels are used in the first two columns. It is recommended that the two columns are used for key status and/or responsibility attributes |
Wbs_level_2_Plan Wbs_level_3_Plan Wbs20_Plan Wbs22_plan |
| Table Format |
Parameter determines the format of the table choosing from the following:
* v2.3.2 saw the addition of a new “plain” detail table that provides a dump of the data ungrouped and not pivoted. It also provides a separate breakout of each budget line attribute for analysis in Excel. In versions previous to 2.3.2 only the grouped table is displayed |
This parameter is configurable with the syntax:
|
table_layout=grouped |
| Report Title | Configurable report title that appears at the top of the report. | If a longer report title is required, create additional report_title=xxx entries. These will be concatenated together based on the order in which they are listed in the configuration structure. | report_title=Work Portfolio Financial Burndown Comparison |
| Financial Model | This parameter provides the ability to override the global setting for the financial model for this report | The financial model for this report can be changed from the global default using the following syntax
|
No override exists as default Financial Model will not differ from Global Default unless entry is added |
| Max Line Attributes | Number of line attributes to consider in the table | Max_line_attributes=2 | |
| Include Zero Financials |
Parameter that determines whether or not to include entities with zero financials in the returned results | If the entry is "N" (the default) any entities that don't have financials for the given set of parameters will not appear in the report at all Options are No(N) or Yes(Y) |
include_zero_financials=N |
| Detail Chart Threshold |
This entry determines whether or not the detail charts will appear. Because of the processing load that charts/graphics consume, larger portfolios could cause the report to slow down or even time out | This default value of 50 should ensure that the report will run, but if there are over 50 entities the detail charts will not appear at all. If you don't want the detail charts at all, you can set this value to zero (0), otherwise change the threshold value as preferred. | detail_chart_threshold=50 |
Global Default Overrides
Applying a custom color palette can help to improve the readability and clarity of a report. This is particularly true for those reports which do not use alternate structures as attributes and therefore cannot apply color charting to the attribute values, such as WRK32.
To ensure that it is easy to distinguish between the bar/lines representing each financial plan version in WRK32, it is recommended that a custom color palette (with a variety of distinct colors) is applied as a global default override.
For further detail on configuring custom color palettes and applying custom color palettes to reports, refer to the Managing Attribute and Report Colors topic.
Additional Information
Details of the attributes, data types, and parameters available for each report dimension:
- X Axis – Time Periods; these periods are based on the Enterprise and Fiscal Calendar.
- Y Axis – Financial Value; the y axis shows data from the financial plan. The following parameters are used to determine what is shown;
- Currency: if Planview Portfoliost is configured to support multi-currency, then this parameter allows selection of the currency to display the financial values in. Standard currency conversions are used.
- Working Version: a single active financial plan version can be selected as the “main” version. This defaults to the Version Marked as Forecast.
- Compare to Versions: this allows the selection of one or many alternative versions that will be compared to the main (working) version. The parameter defaults to the Version Marked as Baseline.
- Financial Measure: financial planning can be used to store financial, effort, and unit data. Only one measure type can be selected, to ensure that different data types are not aggregated.
- Financial Category: selections are either Cost or Revenue/Benefi. These are determined by the financial management account configuration.
- Account Types: Capital/Expense/Labor. Based on the financial management account configuration, this parameter allows further filtering of the financial data that is aggregated for the Y Axis.
- Accounts: this list is dynamically built based on the prior selections and shows the hierarchy of all accounts configured in the model that fit the Category and Account Type selections.
- Max Line Attributes: this determines how the data is displayed in the table, specifically how many line attributes.
Technical/Database Information
| Report (RDL) Location | …/Reports/FastTrack/Mixed_Use/FM32-FinancialBurndown/FM32.rdl |
| Database | This report uses the transactional database and updates will be real-time. |