
Digital Product Insights Connected Dashboard
What Is the Digital Product Insights Connected Dashboard?
The Digital Product Insights connected dashboard is a portfolio-aware Power BI report that connects your strategies' health indicators to forward-looking insights from your delivery teams' in-progress work while also tracking progress against your organization’s objectives and key results (OKRs). This dashboard uses Power BI analytics to visualize strategy, OKR, and value stream data from Planview Portfolios, Planview OKRs, and Planview Viz. By combining portfolio management, agile planning, and value stream management data, this dashboard lets you track progress, work distribution, budget health, and sentiment analysis assessments from one location, helping you align planning with strategic objectives and balance investment among new business functionality, modernization, and maintenance. In addition, you can more easily anticipate risks to delivery, which help you make quicker, more accurate decisions that ensure your business achieves strategic objectives.
You can view the Digital Product Insights connected dashboard as a tile on the My Overview ribbon or on the Strategy Portfolio View ribbon.
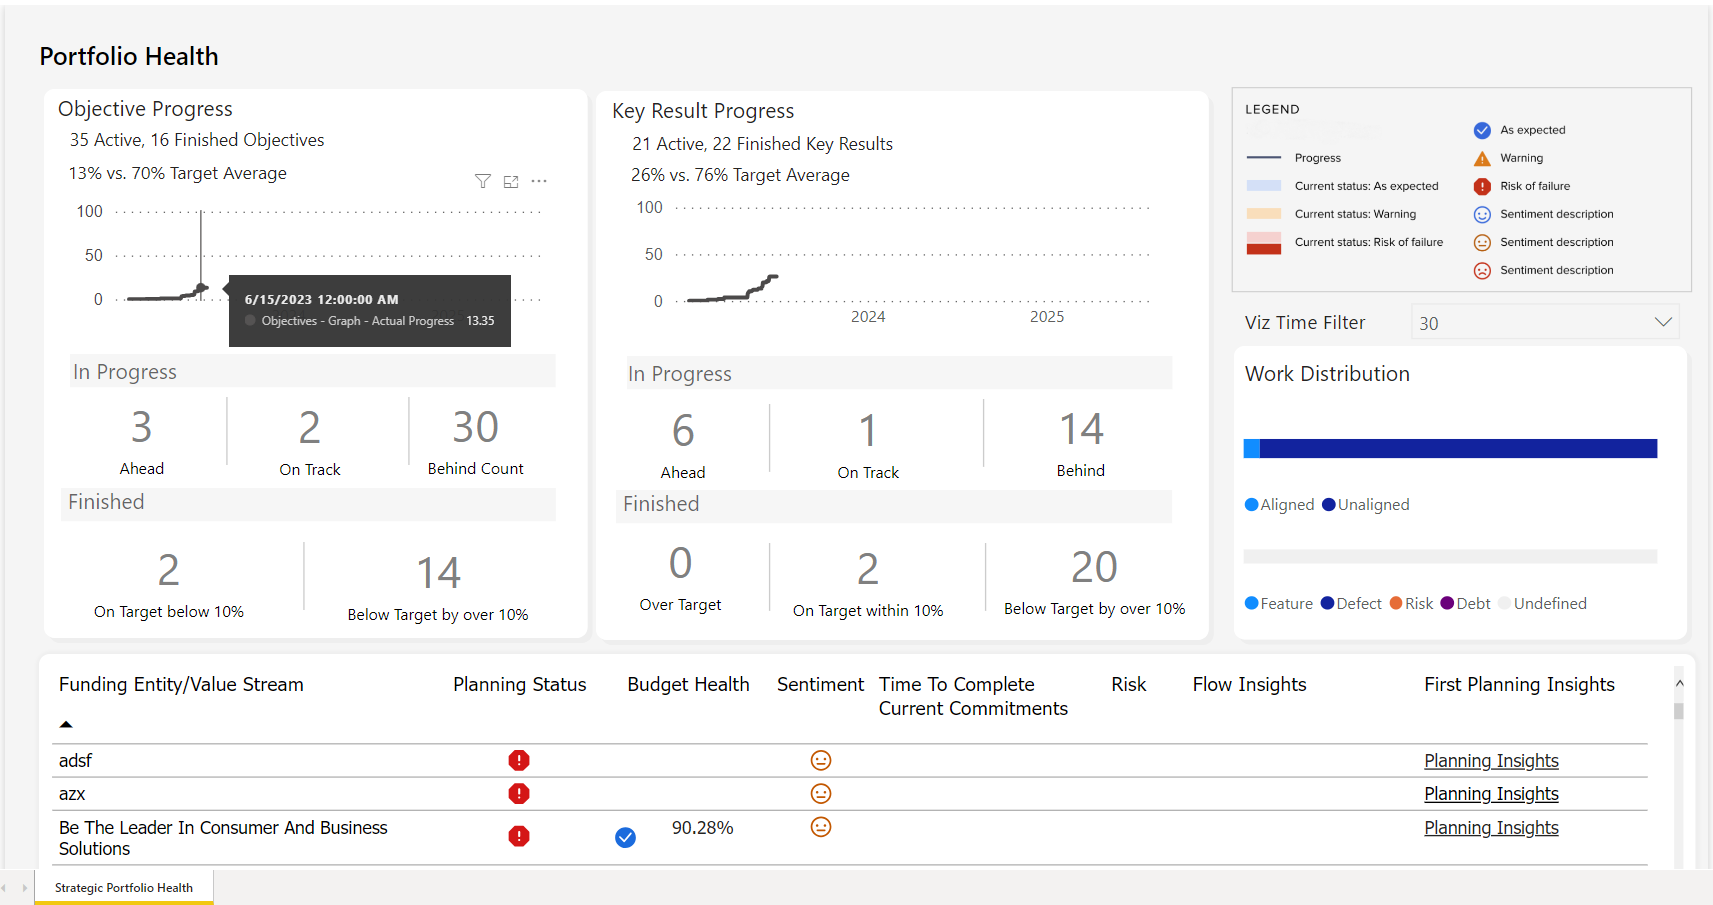
Example of the Digital Product Insights connected dashboard
To use the Digital Product Insights connected dashboard, you need the following Planview products and functionality:
- Planview OKRs
- Planview Viz
- Planview Portfolios release July 2023 or later.
- Sentiment analysis must be enabled by opting into data sharing.
- Connected OKRs must be enabled (linking OKRs and strategies).
- Strategies must be associated with Planview Viz value streams.
- Planview Customer Care must have enabled the Value Stream Name and Value Stream URL columns.
Sign in to access the rest of this product help article.