
STR34 - Strategic Portfolio Investment Risk and Reward
- Last updated
- Save as PDF
Overview
Strategic portfolio report, based on financial plan data, where the user can select benefit/revenue measures for the X Axis, Cost based measures for the bubble size and a risk based attribute for the Y Axis. Report can be configured to run against each level in the strategy structure.
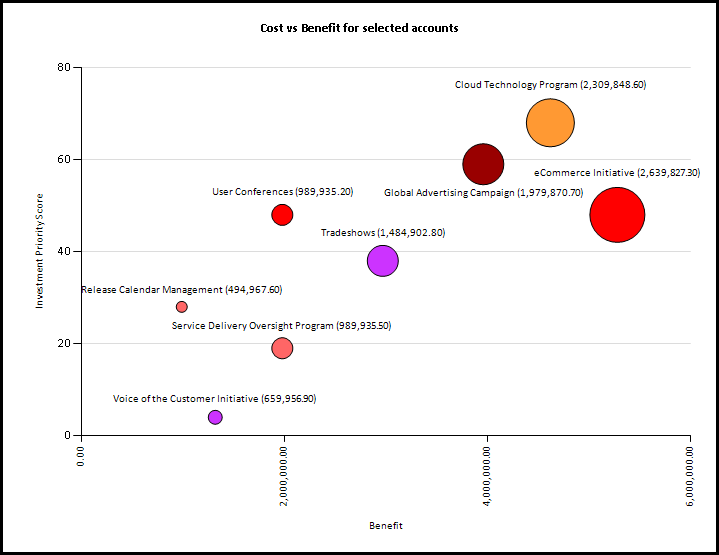
Strategic Portfolio Investment Risk and Reward example
Business Outcomes
- Allow analysis of the portfolio of strategic initiative to ensure that there is a balance of risk vs. reward.
Supporting Capabilities
- Strategic Financial Planning
- Strategic Planning
Report Details
- This report is designed for use by portfolio managers to visualize the investment reward and risk across a portfolio of strategic investments. It visualizes project attribute and financial plan data in a bubble chart, with an X axis plot that represents the financial benefits or revenue associated with each project, an Y axis plot representing a prioritization or risk measure and the bubble size representing the "size" of the project, based on cost or effort to deliver. The most favorable projects are those that are highest in the X axis (biggest benefit or revenue gain), smallest bubble size (lowest cost) and lowest of Y (if a Risk Score is used) or highest on Y (if a Prioritization Score is used). The bubble color highlights the investments that are at risk for a successful delivery.
-
- The X axis allows selection of one or more accounts from the strategic investments financial plan where the Account Type is either Benefit or Revenue. The accounts selected can subsequently be filtered by an line attribute that is common to the selected accounts.
- For the Y axis any strategic investment level numeric attribute can be selected, for example an investment prioritization score or risk score.
- The Z axis (bubble size) allows the selection of one or more cost or effort accounts from the financial plan. The accounts selected can subsequently be filtered by an line attribute that is common to the selected accounts.
- A strategic investment level attribute that has defined charting colors can be selected for the bubble color. Normally a project heath indicator, such as the Red/Yellow/Green status is selected.
- The bubbles plotted on the chart include mouse over text listing the plotted attribute values for each investment. The strategic investment name can be displayed on screen and/or when the report is exported.
Administration: User Parameter Configuration
| Parameters | Description | Configuration Options | Default/Example Settings |
| Currency | Currency in which the amounts should be displayed | There are several values only if the multi currency option is enabled. Default is the system default currency | Default cannot be changed |
| Version | Version to consider | Default is the version specified in the version_id parameter (or version marked as forecast otherwise) | Version_id= |
| X: Benefit/Revenue Accounts | Specify the accounts that should be considered | This is a multi select parameter Only Benefits/Revenues can be selected | Default cannot be changed |
| X: Filter Benefit/Revenue Line Attribute | Can be used to filter down on a given line attribute | By default it is “No Filtering” But one of the used line attribute could be selected. The values to consider for the filtering are defined in the next parameter | Default cannot be changed |
| X: Revenue Filtered Selections | Has to be used if the “X: Filter Benefit/Revenue Line Attribute” is selected | Multi Select parameter | Default cannot be changed |
| Y: Axis Attribute | Attribute to use for the Y axis | Could be any of the numeric project attribute | Y_axis=x_score |
| Size: Cost Account Types | Determine which account type(s) should be used for the size | Multi Select Values are:
|
size_account_type=ACTP$EXP size_account_type=ACTP$CAP size_account_type=ACTP$LAB |
| Size: Cost Accounts | Determine which account(s) should be used for the size | Default is all accounts | Default cannot be changed |
| Size: Filter Costs by Line Attribute | Can be used to filter down on a given line attribute | By default it is “No Filtering” But one of the used line attribute could be selected. The values to consider for the filtering are defined in the next parameter | Default cannot be changed |
| Size: Cost Filter Selections | Has to be used if the “Size: Filter Costs by Line Attribute:” is selected | Multi Select parameter | Default cannot be changed |
| Color: Attribute | Attribute to use for the color | Any of the attribute with defined colors could be used | Color_attribute=str33_strategy |
| Period Starting/Ending | Starting/Finishing Month for the interval | Default=Horizon start of the Financial Model Default=Horizon Finish of the Financial Model |
Default=Horizon Finish of the Financial Model |
| Max Line Attributes | Number of line attributes to consider in the table | Max_line_attributes=2 | |
| Show Bubble Labels | Determine whether the labels should be displayed next to the labels | Values are:
|
Show_bubble_label=export |
Administration: Hidden Parameter Configuration
| Parameters | Description | Configuration Options | Default/Example Settings |
| Table Columns | 2 columns before and 2 columns after the project name can be defined | It is recommended that SBS parent levels are used in the first two columns. It is recommended that the following two columns are used for key status and/or responsibility attributes |
sbs_level_2_strategy sbs_level_3_strategy spsstatus_strategy sps2_strategy |
| Bubble Label Attribute | What should be displayed next to the bubble | Bubble_label_attribute=strat_name | |
| Show Bubble Size | Indicates whether or not the amounts that is used for the size of the bubble should be displayed when Bubble labels are displayed | Available options are: Yes (Y) or No (N) |
Show_bubble_size=Y |
| Depth Restriction | This parameter is used to set the level of the structure that the report is executed on, restricting the results to a specified depth of the Strategic Breakdown Structure. | Use the parameter:
A value of zero (0) removes such limit. |
restrict_depth=0 |
| Report Title | Configurable report title that appears at the top of the report. | If a longer report title is required, then create additional report_title=xxx entries and these will be concatenated together based on the order in which they are listed in the configuration structure. | report_title=Strategic Portfolio Investment Risk and Reward |
Additional Information
Details of the attributes, data types and parameters available for each report dimension;
- Financial Data main parameters;
- Currency; if Planview Portfolios is configured to support multi-currency then this parameter allows selection of the currency to display the financial values in. Standard currency conversions are used.
- Working Version; a single active financial plan version can be selected as the “main” version. This defaults to the Version Marked as Forecast.
- X-Axis – Financial Value; the x axis allows selection of revenue or benefit based data from the financial plan. The following parameters are used to determine what is shown;
- Financial Measure; financial planning can be used to store financial, effort and unit data. Only one measure type can be selected, to ensure that different data types are not aggregated.
- Accounts; this list is dynamically built based on the prior selections and shows the hierarchy of all accounts configured in the model that are benefit/revenue based accounts.
- Account Filtering; the selected accounts can be further filtered down by any of the configured line attributes that are common to the accounts selected.
- Y Axis – strategy numerical fields are available for selection in the Y Axis parameter. Typical data points to use are a prioritization or risk scoring attribute (field).
- Bubble Size – Financial Value; the z axis allows selection of revenue or cost based data from the financial plan. The following parameters are used to determine what is shown;
- Financial Measure; financial planning can be used to store financial, effort and unit data. Only one measure type can be selected, to ensure that different data types are not aggregated.
- Accounts; this list is dynamically built based on the prior selections and shows the hierarchy of all accounts configured in the model that are benefit/revenue based accounts.
- Account Filtering; the selected accounts can be further filtered down by any of the configured line attributes that are common to the accounts selected.
- Color Attribute; alternate structures that have been defined with Charting Colors are available for selection as the bubble color.
- Show Bubble Labels; this determines whether labels are shown for the bubbles for on-screen viewing of the report, export of the report or not at all. Note, when viewed on screen, each bubble has a mouse over hover tool tip that shows the values associated with each bubble.
- Max Line Attributes; this determines how the data is displayed in the table, specifically how many line attributes
Technical/Database Information
| Report (RDL) Location | …/Reports/RPM_PROD/Strategy_RPM/RPM-STR34/RPM-STR34_v2.rd | Report (RDL) Location |
| Database | This report uses the transactional database and updates will be real-time. | Database |
| Report Developer Info: | RPM-STR34_v2 RDL is a derivative of the FM34 RDL | Report Developer Info: |