
Creating an Insight Dashboard
An insight dashboard gives you an overview of all your projects which are under the insight filter.
Login Profile Permissions:
To be able to create an Insight view there is a permission setting within the Login Profile which needs to be enabled as shown below:
General Tab

Creating an Insight Filter:
Click on the project world icon

From the filters icon click on the drop down list click on ‘Add Filter’

Create the filter and then click on ‘Save’
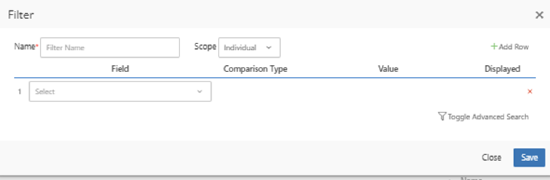
The filter will now be setup:

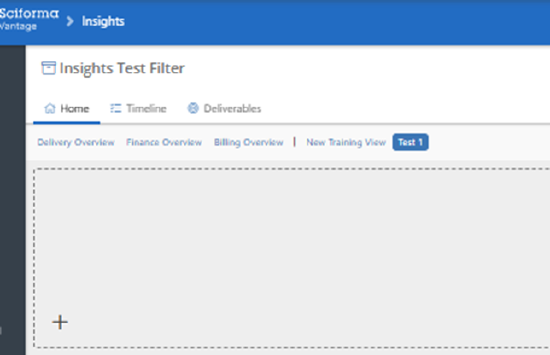
To access the insight dashboard click on the Green icon which shows the project count

This will take you to the dashboard, the dashboard by default will be blank as nothing has been setup in the view.
Please note you can have a maximum of 5 views per dashboard [Per Login]
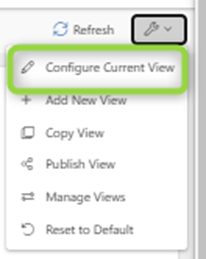
To add a new View click on the Spanner Icon and then click on ‘Add New View’

On the create view screen give the new view a name

Click on ‘Save’
The view will now be shown on the dashboard and will need to configured to display widget/reports.

Click on spanner Icon and then click on ‘Configure Current View’
Next click on ‘+’ shown on the dashboard
This will now bring a list of report widgets you can add to the dashboard

Select a standard out of the box widget from the list or add a new data widget or chart widget. After selecting a widget, click Save.

Please note to add a report widget to a dashboard the report needs to be configured so that it can be used on the dashboard.
The following section shows how this is done. Please note a report has to be a ‘Widget’ type report

To make the widget report available to a dashboard:
1) Go to reports
2) Open a report to be added to the dashboard

3) In the report edit screen first of all you may want to share this report to a particular ‘login group’
You will need to make it available to your own login group as well as any other login groups who want to use this report so this report can be used against the selected login group.
If the login group is not under this report, then this report will not be available to those login groups.
To add the report to a login group please select the ‘Details’ Tab and in the Access section, select login group:

Next this report will need to be made available to a dashboard. Please select the ‘Details’ tab and go to Availability’

Select the required dashboard where the report will be used and then click on ‘Save & Close’
The widget report will now be available to the selected dashboards
