
Configuring PowerPoint Templates - Adding Charts to the PowerPoint template
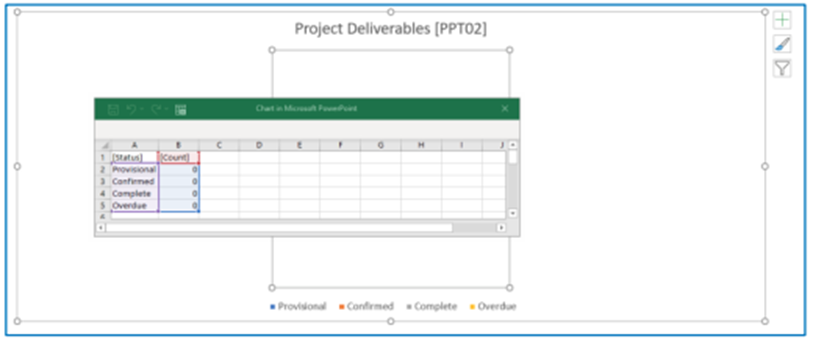
Add a chart to your PowerPoint template, set the title text and add a placeholder to the end of the title to reference the report to be used for the chart. This is the unique reference for the report within square brackets e.g. [PPT02].

Next, edit the data for your chart.
Or

Set the column headings to be the fields from your report, e.g. [Status] and [Count].
In the status column set the status categories to be displayed, this can either be done by naming the specific categories to be displayed or by specifying the [Category] placeholder, in which case the report will pick up the category names from the report (Note: The chart will only display the number of categories that you specify, if the data contains 5 categories but you only specify the [Category] placeholder 4 times, the last category will be excluded)
In the count column enter 0s (This data will be automatically retrieved and replaced from the data report when the PowerPoint report is run)
- Note: Using Dates for categories If you use dates as categories for your chart these will need to be formatted as text in the report for the PowerPoint template to recognise them.
Multiple series of data can be added in the same way. In the example below there are two series of data, Actuals and Planned.

The following standard chart types within PowerPoint can be used:
Clustered Column
Stacked Column
Percent Stacked Column
Clustered Column 3D
Stacked Column 3D
Percent Stacked Column 3D
Column 3D
Line
Stacked Line
Percent Stacked Line
Line with Markers
Stacked Line with Markers
Percent Stacked Line with Markers
Line 3D
Pie
Pie 3D
Percent Stacked Bar
Clustered Bar 3D
Clustered Bar
Stacked Bar
Stacked Bar 3D
Percent Stacked Bar 3D
Area
Stacked Area
Percent Stacked Area
Area3D
StackedArea3D
PercentsStackedArea3D
Doughnut
Radar
Radar with Markers
Filled Radar
Series of Mixed Types (Can only contain the above chart types)