
Planview Anvi administration
How do I manage Planview Anvi functionality?
The following sections explain the way administrators can manage Planview Anvi for their users. More sections will be added over time.
Using the Anvi AAU usage dashboard
Administrators can track Anvi AI Unit (AAU) usage in Planview Admin with the Anvi AAU usage dashboard, which allows you to have a single place to track how many AAUs have been used, who used them, and how they used them.
The top of the dashboard shows the following widgets: Total AAUs used, Total questions asked, and Total agent execution steps. The table on the screen lists all Anvi activity across your customer account. Each row shows data for a single question, agent step, or in-app features such as the Planview.Me Insights widget. Clicking a row on the dashboard displays the details of that specific chat session. On the screen, you can also filter the results by specific date range, user, Planview product, and more.
To access the Anvi AAU usage dashboard:
- Open Planview Admin.
- Click the Analytics menu.
- On the Analytics screen, click the Usage tab if it is not already selected.
Anvi AAU usage dashboard screen elements
The following image shows an example of the Anvi AAU usage dashboard:
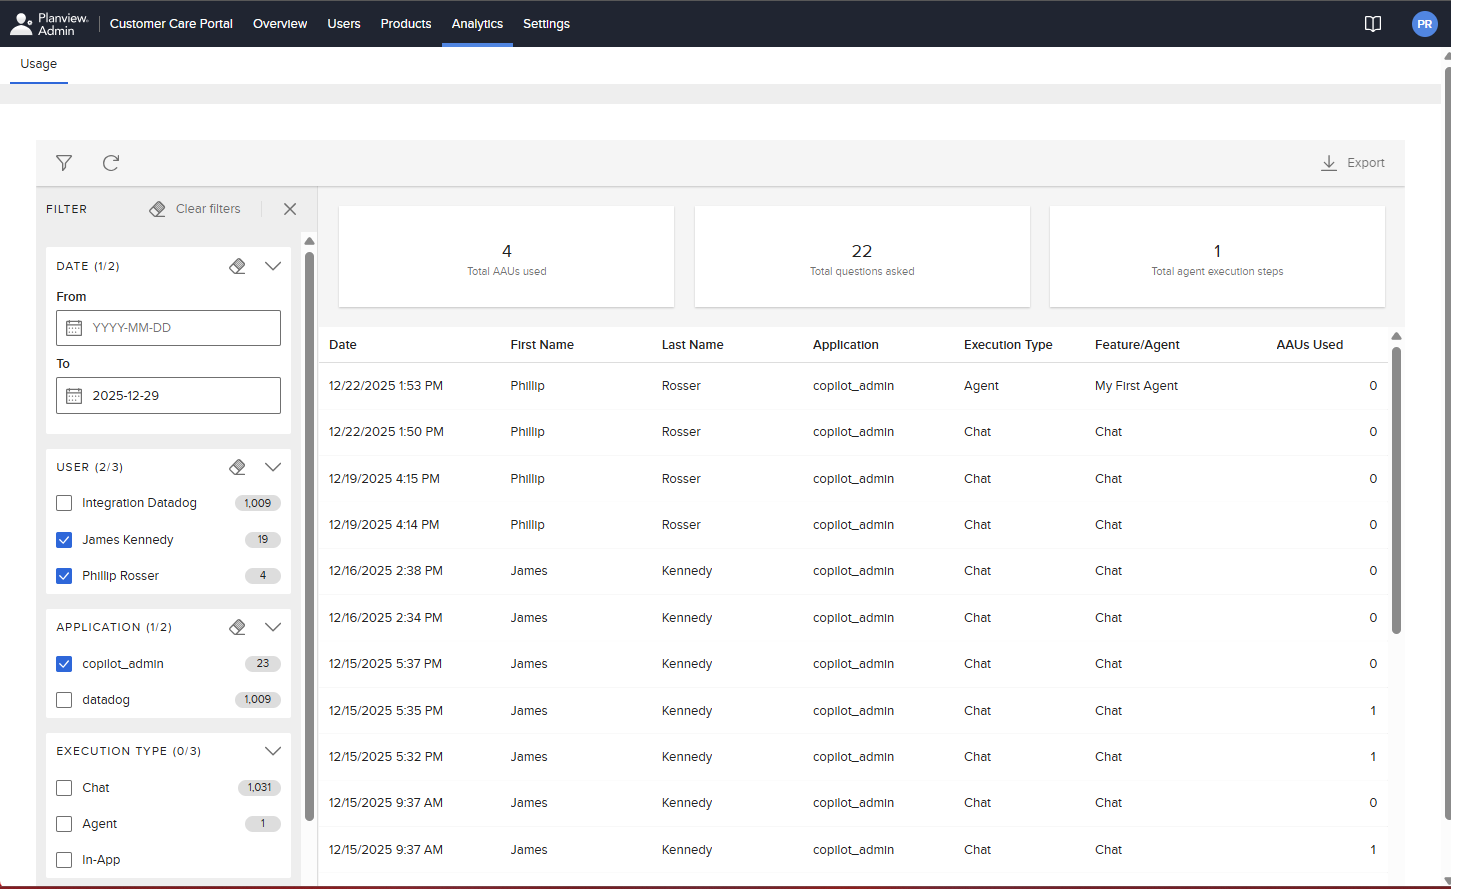
Example of the Anvi AAU usage dashboard
The following table describes the columns and other elements on the screen.
| Element | Description |
|---|---|
 |
Opens the filter pane, which contains the following filters:
TIPS
|
| Refreshes the data on the screen. | |
| Lets you download the raw data behind the dashboard you are currently viewing as a CSV file. All active filters are applied to the exported data. | |
| Total AAUs used | A widget that shows the total number of AAUs used. |
| Total questions asked | A widget that shows the total number of questions asked by all users in Anvi Chat. |
| Total agent execution steps | A widget that shows the total number of Anvi agent steps run by Anvi when it ran agents according to their schedules. |
| Date | The date and time that the activity occurred, shown in the user’s local time zone. |
|
First Name Last Name |
The first and last name of the user that initiated the activity. This can be the user who initiated the chat, who interacted with the Anvi in-app feature, or who owns the agent that Anvi ran. |
| Application | The Planview product that the activity was run against (such as Planview Portfolios, Planview AgilePlace, Planview Viz, or Planview AdaptiveWork). |
| Execution Type |
The type of activity that was run:
|
| Feature/Agent |
This value can be one of the following, depending on if the activity was an in-app feature, an agent, or a chat:
|
| AAUs Used | The number of AAUs used by the activity. |
 Clear filters at the top of the filter pane to delete all filter criteria in all sections.