
Agile Team Delivery (Connected)
Agile team delivery
This capability supports team of teams program backlog management, quarterly planning, and program planning using Kanban boards. Teams can see backlogged and current work and coordinate organizational initiatives effectively and with clarity into the value delivered.
Learn more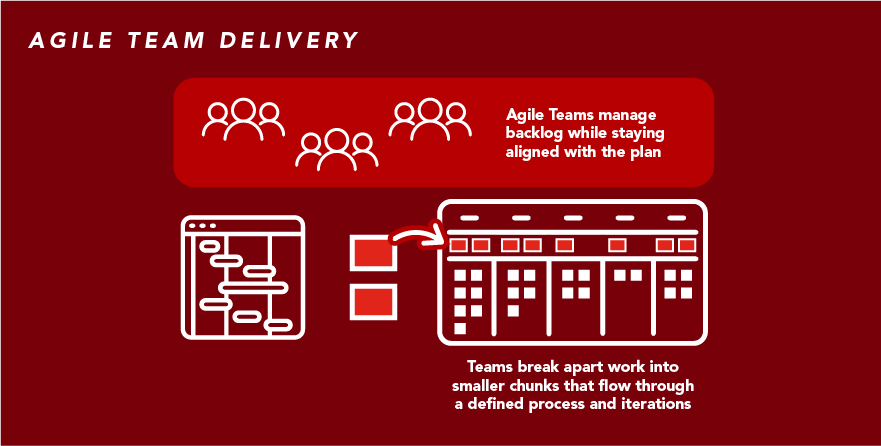
 Team backlog management
 Team execution
 Team integration
Capability resources
Adopt and optimize
Get started using connected Portfolios-AgilePlace and optimize usage with these essential steps and recommendations.
Learn moreAgile Team Delivery Process Steps
Review step-by-step guidance, process flows, and best practices for end users to achieve specific business outcomes.
Learn moreDesign and set up
Explore design and set up recommendations for connected Portfolios-AgilePlace with these steps for Planview administrators.
Learn moreGain insights with reports
Leverage reports and analytics to track project status, communicate with stakeholders, and inform decision-making.
Learn moreOverview of Planview Admin
Activate Planview Admin for connected Portfolios-AgilePlace with these steps for Planview administrators.
Learn moreUnderstand the basics
Get started with foundational knowledge and the key benefits of implementing connected Portfolios-AgilePlace.
Learn more