
PRD51 - Product Portfolio Associated Work Matrix
| RPM Analytics Catalog ▲ | RPM Product Analytics ▲ | RPM Analytic PRD51 ▼ |
|---|
| Overview |
|---|
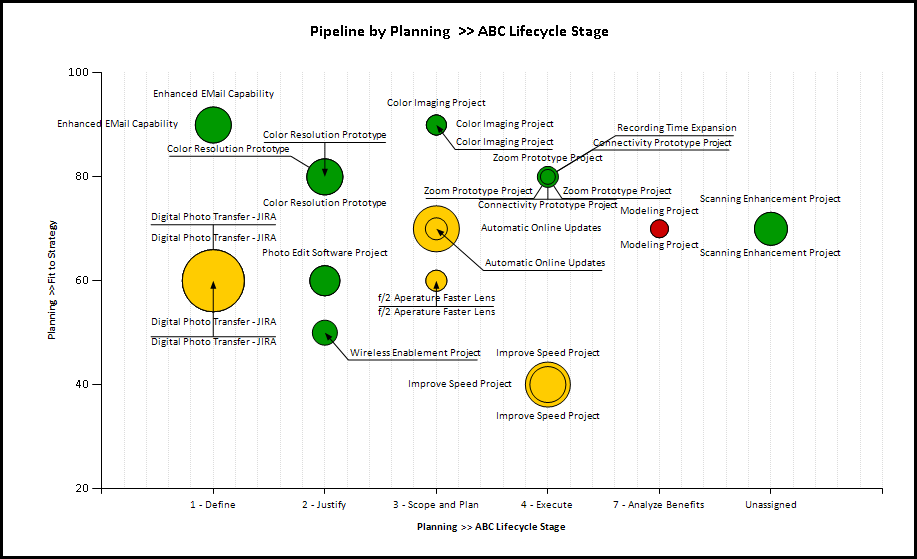
| A product portfolio based report that shows status and data on the projects associated to the products in the portfolio. Report is equivalent to WRK01, but is based on a product portfolio. |
| Business Outcomes | Supporting Capabilities |
|---|---|
|
|
- <Coming Soon>
| User Guide |
|---|
-
User Parameter Configuration (Information for Planview Administrators) Parameters Description Configuration Options Default/Example Settings Show Bubble Label: Determine whether the bubbles have an associated label. Options are;
none = None
export = Export
both = Browser & Exportshow_bubble_label=both Size Attribute: Measure used to size the bubble.
The available measures include;
Any numeric attribute that is enabled for “Use in Configurable Charts” in the attribute display setting, including standard numeric fields, custom numeric fields, effort, duration and currency.bubble_size=grs_fm_fcst_cos_dflt_plan
Color Attribute: Attribute that will be used to color the bubbles representing each product. Any single select product attribute. Must have charting (color) options configured. Color plotted will be based on this config. bubble_color=wbs709_plan
Y-Axis Attribute: Attribute that will be plotted on the Y-Axis Same as the size attribute, plus any date attribute. x_axis=none
X-Axis Attribute: Primary plot on the X-Axis Same as the size attribute, plus any date attribute. y_axis=score1 X-Axis Grouping: Grouping (by an attribute) within the X Axis range. Any single select product alternate structure (enabled for Analyze Charts) plus Lifecycle Roles. Lifecycle stage recommended x_axis_group=wbs28_plan Sort X Axis Grouping: Define the sorting order for the X-Axis Grouping (if defined) Two options:
Alphabetical (default)
Structure OrderDefault cannot be changed Hidden Parameter Configuration (Information for Planview Administrators) Parameters Description Configuration Options Default/Example Settings Table Columns Report supports 3 required/grouped columns plus 3 optional columns. pbs_level_3_prod
product_description
wbs_level_4_plan
project_description
wbs20_plan
lc_role_3_planBubble Label Determine which attribute is used for the bubble label Recommend Product Name or Product ID label_attribute=project_description Depth Restriction Sets the level of the structure that is reported on A value of zero (0) removes such limit. restrict_depth=4 Table Format Defines how the detail table at the bottom is formatted The value “sectiongroup” renders a table with grouping, whereas “plain” renders a table that’s good for analysis in Excel. Neither of these apply when the report view is “Dashboard” because the table is hidden. table_format=sectiongroup Report Title Configurable report title that appears at the top of the report. If a longer report title is required, then create additional report_title=xxx entries and these will be concatenated together based on the order in which they are listed in the configuration structure. report_title=Product Portfolio Associated Work Matrix Additional Information The measures (Size attribute, X-Axis and Y-Axis) include derived financial plan based columns, for each financial planning account type, baseline version, forecast version actuals and forecast cost version forecast and forecast version total.
Financial management sub-total or calculated columns are not available as measure attributes. These can be added through a reporting attribute data model extension. Please refer to Global Reporting Services.
The chart will plot projects with a zero value on the bubble size attribute – they are shown with a very small (minimum size) bubble. The tool tip hover on the bubble shows the values being plotted.Technical/Database Information Report (RDL) Location …/Reports/RPM/Product_RPM/RPM-PRD51/RPM-PRD51_v2.rdl Database This report uses the transactional database and updates will be real-time. Report Developer Info RPM-PRD51_v2 RDL is a derivative of the BUBBLE01 RDL