
PRD42 - Product Process Analysis - Development Stage
| RPM Analytics Catalog ▲ | RPM Product Analytics ▲ | RPM Analytic PRD42 ▼ |
|---|
| Overview |
|---|
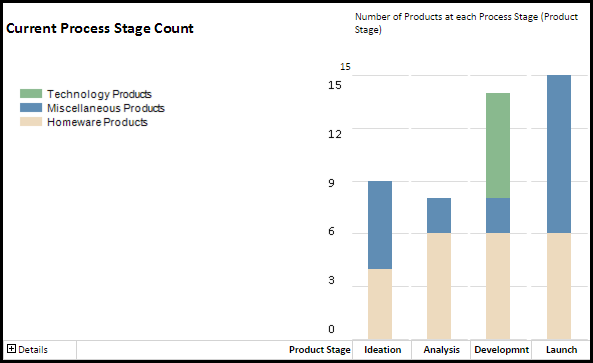
| A product portfolio report showing data on product lifecycles to aid analysis on throughput, volume and cycle time. Report can be run against and sliced by different attributes. |
| Business Outcomes | Supporting Capabilities |
|---|---|
|
|
| User Guide |
|---|
- <Coming Soon>
-
User Parameter Configuration (Information for Planview Administrators) Parameters Description Configuration Options Default/Example Settings Report View Determines the default view of the report. A value of 0 (Dashboard) will show the charts but will collapse all the details. A value of 1 (Chart + Summary) will expand the summaries but keep the details collapsed. A value of 2 (Chart + Details) will render a fully expanded report. The “Dashboard” selection (report_view=0) will also hide the detail table. report_view=0 Table Format Defines how the detail table at the bottom is formatted The value “sectiongroup” renders a table with grouping, whereas “plain” renders a table that’s good for analysis in Excel. Neither of these apply when the report view is “Dashboard” because the table is hidden. table_format=sectiongroup Range start This parameter determines the start of the range of dates that are preselected The value represents the number of months from the current month. So a value of zero (0) represents the current month. A value of -11 would be 12 months ago. horizon_start=-11 Range end This parameter determines the Finish of the range of dates that are preselected The value represents the number of months from the current month. So a value of zero (0) represents the current month. A value of -11 would be 12 months ago. horizon_finish=0 Attribute for Grouping Attribute used for slicing in the report Only alternate structure attributes in the framework, marked as analyzable and that have charting colors assigned can be used for slicing in the report. slicer=pbs_level_2_prod Hidden Parameter Configuration (Information for Planview Administrators) Parameters Description Configuration Options Default/Example Settings Table Columns Report supports 3 required/grouped columns plus 3 optional columns. First three configurable values display grouped columns pbs_level_2_prod
pbs_level_3_prod
pbs1_prodAnalyze attribute Attribute for which process cycle times are being measured. pbs1_prod (analyze_attribute=pbs1_prod) Filtered Attribute Configured value defines structure codes of analyzable attribute values (leaf entries) that are to be included in the analysis. Multiple entries are expected; one for each value to be included. A blank entry means all values are analyzed The default configuration is a single, blank entry Report Title Configurable report title that appears at the top of the report. If a longer report title is required, then create additional report_title=xxx entries and these will be concatenated together based on the order in which they are listed in the configuration structure. report_title=Product Process Analysis - Development Stage Additional Information The short names associated with charting colors for the attribute of lifecycle role drives the abbreviated value used in the charts
Recommendation: the first value of the Lifecycle Stage attribute should be set via an auto scripted dialog at project initiation not based on the default value that exists in the structure definitionTechnical/Database Information Report (RDL) Location …/Reports/RPM/Product_RPM/RPM-PRD42/RPM-PRD42_v2.rdl Database This report uses the transactional database and updates will be real-time. Report Developer Info: RPM-PRD42_v2 RDL is a derivative of the PROCESS01 RDL