
PRD33 - Product Portfolio Revenue Prioritization Bubble
| RPM Analytics Catalog ▲ | RPM Product Analytics ▲ | RPM Analytic PRD33 ▼ |
|---|
| Overview |
|---|
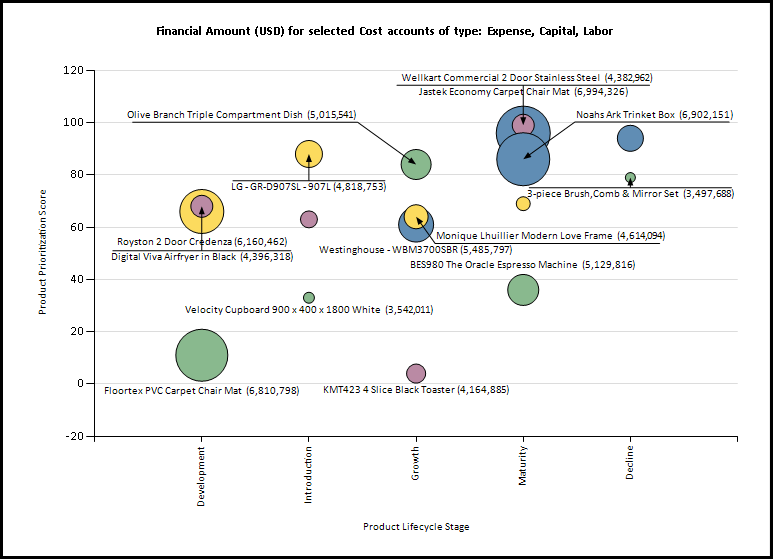
| Product portfolio report that can select cost or revenue based measures from the financial planning data to drive bubble size and visualize the pipeline of products. Report can be configured to run against each level in the product structure. |
| Business Outcomes | Supporting Capabilities |
|---|---|
|
|
| User Guide |
|---|
- <Coming Soon>
-
User Parameter Configuration (Information for Planview Administrators) Parameters Description Configuration Options Default/Example Settings Table Columns 2 columns before and 2 columns after the product entity name can be defined It is recommended that PBS parent levels are used in the first two columns.
It is recommended that the two columns are used for key status and/or responsibility attributespbs_level_2_prod
pbs_level_3_prod
pbs2_prod
pbs95_prodCurrency Currency in which the amounts should be displayed There are several values only if the multi currency option is enabled. Default is the system default currency Default cannot be changed Version Version to consider Default is the version specified in the version_id parameter (or version marked as forecast otherwise) Version_id= Financial Measure Unit to use to display the numbers Values are: - Financial Amount
- Effort (hours)
- Effort (days)
- Effort (FTEs)
- Units
- amount
- hours
- days
- ftes
- units
fm_measure=amount Financial Category Specify whether costs or benefits/revenues should be displayed Values are: - Cost (cost)
- Benefit/Revenue (benefit)
Financial_category=cost Account Types Specify the account types that should be considered This is multi select parameter Values are: - Capital
- Expense
- Labor
- Benefit
There is a line for each possible value: account_type=ACTP$EXP account_type=ACTP$CAP account_type=ACTP$LAB Filter by Budget Line Attribute Can be used to filter down on a given line attribute By default it is “No Filtering” But one of the used line attribute could be selected. The values to consider for the filtering are defined in the next parameter Default cannot be changed Filtered Values Has to be used if the “Filter by Budget Line Attribute” is selected Multi Select attributes Default cannot be changed Accounts Specify the accounts that should be considered This is a multi select parameter This list takes into account the account type parameter Default cannot be changed Period Starting Starting Month for the interval Default=Horizon start of the Financial Model Default cannot be changed Period Ending Finishing Month for the interval Default=Horizon Finish of the Financial Model Default cannot be changed Max Line Attributes Number of line attributes to consider in the table Max_line_attributes=2 Color Attribute Attribute to use for the color Any of the attribute with defined colors could be used Color_attribute=wbs709_prod X-Axis Attribute Attribute to use for the X-Axis Any of the product attributes (fields, alternate structure, SBS) could be used X_axis=spbs1_prod Y-Axis Attribute Attribute to use for the Y-Axis Any of the product fields could be used Y_axis=rpm_product_score Show Bubble Labels Determine whether the labels should be displayed next to the labels Values are: - No Labels (none)
- On Export Only (export)
- Export and Browser (both)
Show_bubble_label=both Hidden Parameter Configuration (Information for Planview Administrators) Parameters Description Configuration Options Default/Example Settings Bubble Label Attribute What should be displayed next to the bubble Bubble_label_attribute=product_description Show Bubble Size Indicates whether or not the amounts that is used for the size of the bubble should be displayed when Bubble labels are displayed Available options are:
Yes (Y) or No (N)Show_bubble_size=Y Report Title Configurable report title that appears at the top of the report. If a longer report title is required, then create additional report_title=xxx entries and these will be concatenated together based on the order in which they are listed in the configuration structure. report_title=Product Portfolio Revenue Prioritization Bubble Additional Information Details of the attributes, data types and parameters available for each report dimension; - X Axis – The attributes available for use on the X axis include categorical dimensions such as strategy alternate structures, SBS hierarchy parent values, strategy numerical fields and strategy date based fields, such as actual/Scheduled finish date. The values will be plotted based on the chronology, size or attribute place (position in the alternate structure definition).
- Y Axis – strategy numerical fields are available for selection in the Y-axis parameter. Typical data points to use are a prioritization or risk scoring attribute (field). Bubble Size – Financial Value; the z axis shows data from the financial plan.
The following parameters are used to determine what is shown:- Currency; if Planview Enterprise is configured to support multi-currency then this parameter allows selection of the currency to display the financial values in. Standard currency conversions are used.
- Working Version; a single active financial plan version can be selected. This defaults to the Version Marked as Forecast.
- Financial Measure; financial planning can be used to store financial, effort and unit data. Only one measure type can be selected, to ensure that different data types are not aggregated.
- Financial Category; selections are either “Cost” or “Revenue/Benefit”. These are determined by the financial management account configuration.
- Account Types; Capital/Expense/Labor; based on the financial management account configuration, this parameter allows further filtering of the financial data that is aggregated for the Y Axis.
- Accounts; this list is dynamically built based on the prior selections and shows the hierarchy of all accounts configured in the model that fit the Category and Account Type selections.
- Max Line Attributes; this determines how the data is displayed in the table, specifically how many line attributes
Technical/Database Information Report (RDL) Location …/Reports/RPM/Product_RPM/RPM-PRDR33/RPM-PRD33_v2.rdl Database This report uses the transactional database and updates will be real-time. Report Developer Info: RPM-PRD33_v2 RDL is a derivative of the FM33 RDL