
PRD32 - Product Revenue/Cost Forecast Performance
| RPM Analytics Catalog ▲ | RPM Product Analytics ▲ | RPM Analytic PRD32 ▼ |
|---|
| Overview |
|---|
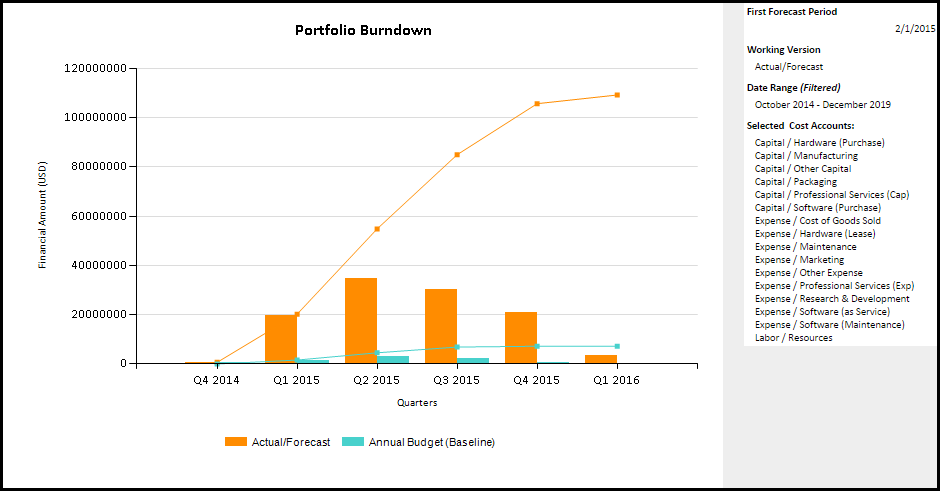
| Single product and product portfolio report that allows the comparison of one/many versions of product and summarized portfolio financial plan data, including effort (FTEs/Days/Hours) or financial data (Cost/Revenue). Includes a burn down chart for the whole portfolio and for each initiative. Report can be configured to run against each level in the strategy structure. |
| Business Outcomes | Supporting Capabilities |
|---|---|
|
|
| User Parameter Configuration (Information for Planview Administrators) | |||
|---|---|---|---|
| Parameters | Description | Configuration Options | Default/Example Settings |
| Currency | Currency in which the amounts should be displayed | There are several values only if the multi currency option is enabled. Default is the system default currency | Default cannot be changed |
| Working Version | Version to consider (This version will appear first) | Default is the version specified in the version_id parameter (or version marked as forecast otherwise) | Version_id= |
| Compare to version(s) | Comparison version(s) to consider | Choose from list of financial versions Default is version marked as baseline |
Default cannot be changed |
| Financial Measure | Unit to use to display the numbers | Values are:
|
fm_measure=amount |
| Financial Category | Specify whether costs or benefits/revenues should be displayed | Values are:
|
Financial_category=cost |
| Account Types | Specify the account types that should be considered | This is multi select parameter Values are:
|
There is a line for each possible value: account_type=ACTP$EXP account_type=ACTP$CAP account_type=ACTP$LAB |
| Accounts | Specify the accounts that should be considered | This is a multi select parameter This list takes into account the account type parameter | Default cannot be changed |
| Period/Ending Starting | Starting/Finishing Month for the interval | Default=Horizon start of the Financial Model Default=Horizon Finish of the Financial Model |
Default cannot be changed |
| Chart Detail Metric By | Timescale to use for the trend chart | Values are:
|
Default depends on the interval size (number of periods between Period Starting and Period Ending) |
| Hidden Parameter Configuration (Information for Planview Administrators) | |||
|---|---|---|---|
| Parameters | Description | Configuration Options | Default/Example Settings |
| Table Columns | 2 columns before and 2 columns after the product name can be defined | It is recommended that PBS parent levels are used in the first two columns. It is recommended that the two columns are used for key status and/or responsibility attributes |
pbs_level_2_prod pbs_level_3_prod pbs2_prod pbs95_prod |
| Report Title | Configurable report title that appears at the top of the report. | If a longer report title is required, then create additional report_title=xxx entries and these will be concatenated together based on the order in which they are listed in the configuration structure. | report_title=Product Revenue/Cost Forecast Performance |
| Max Line Attributes | Number of line attributes to consider in the table | Max_line_attributes=2 | |
| Include Zero Financials ☑ Added in RPM Analytics v2.2.0. |
Parameter that determines whether or not to include entities with zero financials in the returned results | If the entry is "N" (the default) any entities that don't have financials for the given set of parameters will not appear in the report at all Options are No(N) or Yes(Y) |
include_zero_financials=N |
| Detail Chart Threshold ☑ Added in RPM Analytics v2.2.0. |
This entry determines whether or not the detail charts will appear. Because of the processing load that charts/graphics consume, larger portfolios could cause the report to slow down or even time out | This default value of 50 should ensure that the report will run, but if there are over 50 entities the detail charts will not appear at all. If you don't want the detail charts at all you can set this value to zero (0), otherwise change the threshold value to preference | detail_chart_threshold=50 |
| Additional Information |
|---|
Details of the attributes, data types and parameters available for each report dimension:
|
| Technical/Database Information | |
|---|---|
| Report (RDL) Location | …/Reports/RPM_PROD/Product_RPM/RPM_PRD32/RPM-PRD32_v2.rdl |
| Database | This report uses the transactional database and updates will be real-time. |
| Report Developer Info: | RPM-PRD32_v2 RDL is a derivative of the FM32 RDL |