
PRD03 - Product Portfolio Prioritization Matrix
| FastTrack Analytics Catalog ▲ | FastTrack Product Analytics ▲ | FastTrack Analytic PRD03 ▼ |
|---|
| Overview |
|---|
| Bubble chart that allows prioritization, cost, benefit, revenue and effort measures be plotted against product status dimensions (such as lifecycle stage and strategic alignment) providing a value vs. cost visualization of the portfolio pipeline. |
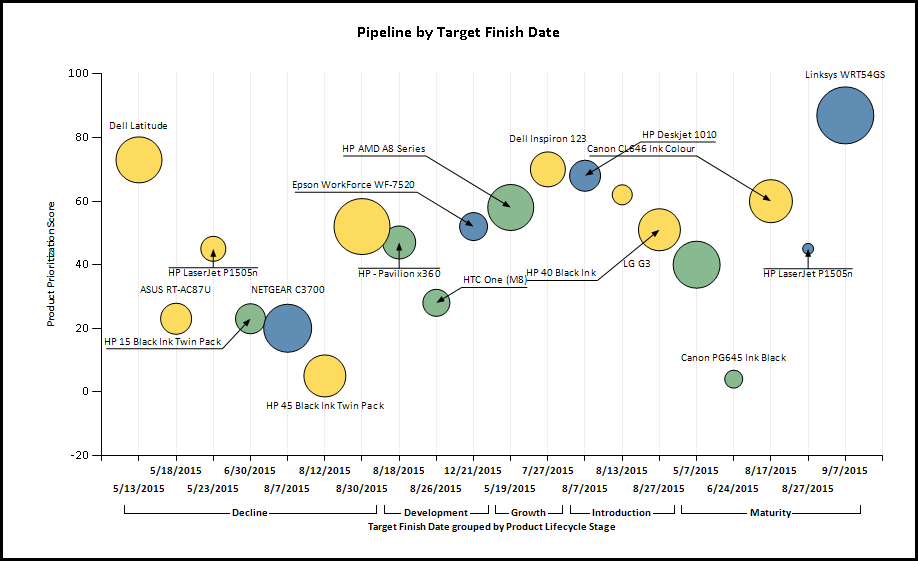
Product Portfolio Prioritization Matrix bubble chart example
| Business Outcomes | Supporting Capabilities |
|---|---|
|
|
| User Parameter Configuration (Information for Planview Administrators) | |||
|---|---|---|---|
| Parameters | Description | Configuration Options | Default/Example Settings |
| Show Bubble Label: | Determine whether a label should be displayed next to the label | Values:
|
show_bubble_label=both |
| Size Attribute: | Define the attribute that will be used for the size of the bubble | Any financial amount and $PBS numerical field can be selected here | bubble_size=grs_fm_fcst_cos_dflt_prod |
| Color Attribute: | Define the attribute that will be used for the color | Only $PBS alternate structures with the color defined can be selected here | bubble_color=wbs709_prod |
| Y-Axis Attribute: | Define the attribute that will be used for the Y-Axis | Any financial amount and $PBS numerical field can be selected here | x_axis=prod_target_finish |
| X-Axis Attribute: | Define the scalar attribute that could be used for the X-Axis | Any financial amount and $PBS numerical field can be selected here It is also possible to not define such an attribute by using the following option: “** No Scalar Attribute – Grouping Only **” If this is the default option. X_axis should be set to NULL | y_axis=rpm_product_score |
| X-Axis Grouping: | Define the attribute that could be used for the grouping on the X axis | Any $PBS alternature structure can be defined here. It is also possible to not define such a grouping by using the following option: “** No grouping **” If this is the default option. X_axis_group should be set to NULL | x_axis_group=wbs28_plan |
| Sort X Axis Grouping: | Define the sorting order for the X-Axis Grouping (if defined) | Two options: Alphabetical (default) Structure Order |
x_axis_group=pbs1_prod |
| Hidden Parameter Configuration (Information for Planview Administrators) | |||
|---|---|---|---|
| Parameters | Description | Configuration Options | Default/Example Settings |
| Table Columns | Columns to be displayed in the table. | 2 attributes can be defined here: the first one will be the first column of the table The second one will be displayed after the product entity description | pbs_level_4_prod pbs2_prod |
| Label Attribute | Attribute to be displayed for the label (if Bubble labels are displayed) | Recommended to display the product entity name (default) | label_attribute=product_description |
| Hidden Attribute Depth Restriction | Depth Restriction sets the level of the structure that is reported on | A value of zero (0) removes such limit. | Restrict_Depth=0 |
| Report Title | Configurable report title that appears at the top of the report. | If a longer report title is required, then create additional report_title=xxx entries and these will be concatenated together based on the order in which they are listed in the configuration structure. | report_title=Product Prioritization Matrix |
| Additional Information |
|---|
| The measures (Size attribute, X-Axis and Y-Axis) include derived financial plan based columns, for each financial planning account type, baseline version, forecast version actuals and forecast cost version forecast and forecast version total. Financial management sub-total or calculated columns are not available as measure attributes. These can be added through a reporting attribute data model extension. Please refer to Global Reporting Services. The chart will plot projects with a zero value on the bubble size attribute – they are shown with a very small (minimum size) bubble. The tool tip hover on the bubble shows the values being plotted. |
| Technical/Database Information | |
|---|---|
| Report (RDL) Location | …/Reports/FastTrack/Mixed_Use/BUBBLE01-PipelineMatrix/BUBBLE01.rdl |
| Database | This report uses the transactional database and updates will be real-time. |