
Reporting on Investment Dependencies - Analytic
| RPM Analytics ▲ | RPM Configuration Case Studies ▲ | Reporting on Investment Dependencies ▼ |
|---|
| Overview |
|---|
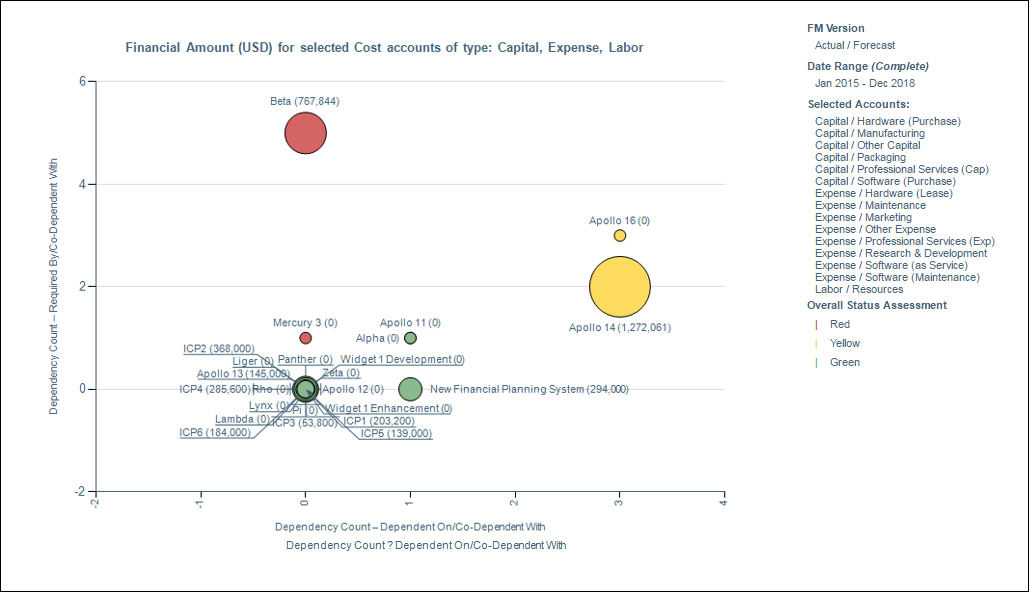
| This bubble chart report provides a mechanism to visualize the dependencies between investments such as projects and programs, in a portfolio and highlights areas of risk in the portfolio. |
| Example showing Project Investment Dependencies |
This bubble chart report is designed to show the investment dependency relationships between projects within the Portfolio.
This provides value by identifying important projects that may have other projects dependent on the success of their delivery. This helps understand the impact of projects in the context of the portfolio and to identify areas where mitigating actions may need to be taken. |
| Analyzing the Output |
The example investment dependency report output below shows some interesting and telling results.
|
| Reporting on Investment Dependencies Configuration |
|---|
| This report uses the base report WRK33 - Project Cost or Revenue/Benefit Bubble, configured to provide a view of project dependencies within the portfolio by changing the X and Y axis defaults in the parameter configuration. Create a persona of WRK33 - Project Cost or Revenue/Benefit Bubble and update the following configuration entries in the RPM report configuration structure to achieve the above report. For more information on creating personas, please see Report Personas. |
| Outcomes & Strategy |
| The example on this page is showing a project centric view using the WRK33 - Project Cost or Revenue/Benefit Bubble report but this could equally be used on strategy and outcomes as they also supports investment dependencies between entities. Simply configure the STR33 - Strategic Initiative Pipeline Matrix and OUT33 - Outcome Portfolio Revenue Prioritization Bubble reports and replace the project attributes with appropriate Strategy and Outcome ones respectively. |
| Parameter Configuration (Information for Planview Administrators) | |||
|---|---|---|---|
| Parameters | Description | Configuration Options | Default/Example Settings |
| X-Axis Attribute | Attribute to use for the X-Axis | Any of the project attributes (fields, alternate structure, WBS) could be used | X_axis=inv_pred_plan |
| Y-Axis Attribute | Attribute to use for the Y-Axis | Any of the project fields could be used | Y_axis=inv_succ_plan |
| Color Attribute | Attribute to use for the color | Any of the attribute with defined colors could be used | Color_attribute=wbs709_plan |
| Report Title | Configurable report title that appears at the top of the report. | If a longer report title is required, then create additional report_title=xxx entries and these will be concatenated together based on the order in which they are listed in the configuration structure. | report_title=Investment Dependencies |