
Report on Lessons Learned - Analytics
| RPM Analytics ▲ | RPM Configuration Case Studies ▲ | Report on Lessons Learned ▼ |
|---|
| Overview |
|---|
| This report is designed provide an easy and convenient one page reference guide which can be used as material for future projects to learn from the projects experiences. |
| The Output |
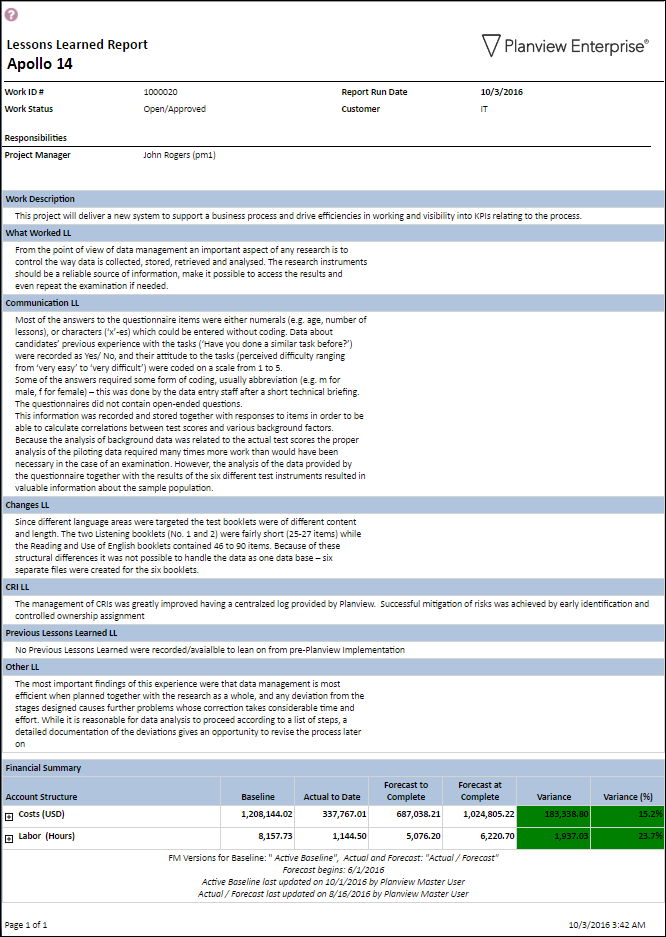
| This report contains all of the lessons learned data points collected during the closure process, all of the final project actuals and their variance with the original baselined forecast, the core assessment status attributes history and a list of issues and changes that were raised against the project. |
| Configuration |
|---|
| This report uses the base report WRK14, typically configured to provide a view of the project stauts, but in this example configured to show the historical data and status of the projects and the lessons leaned captured during closure. The first thing is to remove any project attributes that are relevant when 'in-flight' such as lifecycle gate stage fields such as 'activities this week', which are no longer relevant to a closed project. Risks and issues also come under this category they represent something that could/is impacting the project, as the project is now complete, or in closure, this is no longer relevant to report. A record of the financials and any issues and changes against the projects could be very useful to a lessons learned report so should remain. It may also be useful to show the historical assessment indicator data for the project as this provides a guide to how the various elements of the project were performing over the previous periods before closure. Finally the report should be configured to include all Lessons Learned attributes populated via the Lessons Learned Detail screen against the project. This may be a combination of attributes (captured in the top project heading section) or long text fields captured below the attribute history section. This is the core lessons learned information that will make up the narrative to the report for future projects to reference. Create a Persona of WRK14 and update the following configuration entries in the RPM report configuration structure to achieve the above output. For more information on creating personas, please see Report Personas. |
| Parameter Configuration (Information for Planview Administrators) | |||
|---|---|---|---|
| Parameters | Description | Configuration Options | Default/Example Settings |
| Report Header Attributes | Twenty-nine columns are available for display in the report header section. Executive Summary table on page 1 of the report (when run on a portfolio) includes the first four table columns. These Executive Summary columns can be separately configured. See below. |
Appear in the sequence in which they are placed in the structure. Minimum number of columns is seven columns. Recommendations – key project categorization, status and responsibility attributes. These attributes are configured in the Table Columns Section of the Report Config Structure |
work_id wbs20_plan wbs24_plan remove all 'in-flight' status attributes and include only relevant categorization attributes |
| Scheduled Dates Table ☑ Added in v2.1.1.0 |
Provides users with the ability to include WRM project schedule information in the report output | The table can be configured to control the depth of the WBS information returned and a single work attribute that will appear next to the work description column. Configuration entry 'sch_dates_depth=' defines the maximum depth of the WBS (starting at PPL) that should appear in the “Schedule Dates” section.
There is NO filtering available in this table |
sch_dates_depth=-1 Removes schedule information table from report |
| History Attribute | Provides a way to show an attributes history | Any work single select work alternate structure that has been enabled in Attribute properties to be “Available in Analyze Charts” and has “Track History” enabled and has colors assigned can be configured to display in the Attribute History Section. Up to four history attributes can be displayed and are displayed in the order they appear in the configuration structure. The first configuration entry is used to set the default user parameter (the user can change only the first attribute) If you want this first attribute to appear regardless of the user parameter selection then add a duplicate configuration entry for it. (The duplicate will be ignored if the user doesn’t change from the default) hist_attrib_id=none should be used when a customer doesn’t want to see the history attribute. This will make the history box disappear. (Takes value from the last day of the period in the attributes history) The History attribute uses the last day of the timeframe to determine the prevailing value. So if you choose to breakdown by weeks it will use the last calendar day of each week. |
hist_attrib_id=wbs709_plan hist_attrib_id=wbs722_plan hist_attrib_id=wbs723_plan hist_attrib_id=wbs724_plan include important assessment status indicators to show their historical values |
| Additional Assessment Indicator (RAG) entries | This report supports up to 9 additional RAG entries (without history). These will appear in a table immediately underneath the existing Attribute History Table. | Charting colors have to be assigned. The RAGs appear in the order that the structure entries are created: other_rag=attribute_id. Short Name entered on the charting colors screen is what will be shown against the RAG colors in the additional RAG boxes |
other_rag= remove all current assessment indicators |
| Long Text Fields Section of Report ☑ Enhanced in RPM Analytics v2.2.1 |
Determines the list of long text fields near the top of the report. Prior to RPM Analytics v2.2.1 the maximum number of fields that can be configured is 10. |
Entries can be either long text fields or project (PPL) level notes from WRM. No minimum required, maximum of 30 values. Fields will appear in the order in which they are listed in the configuration structure. long_text=Field ID |
long_text=pe01 long_text=what_worked_ll long_text=communication_ll long_text=changes_ll long_text=cri_ll long_text=previous_ll long_text=other_ll |
| Hide CRI Tables | Ability to Include/Hide Change Request, Issue or Risk Tables in Report | This parameter determines whether the CRI summary tables are included. If set to “Y” and a project has no C/R/I, then static text is shown saying there are no associated C/R/I . These controls can be made report specific by making entries in the report specific Config in the Global Default Overrides node. If CRI is not being used in global defaults in the RPM Configuration Structure, the CRI status parameter is prepopulated and preselected to ‘Not Applicable’ and the CRI section of the report is completely hidden | use_changes=Y use_risks=N use_issues=N |
| Report Title | Configurable report title that appears at the top of the report. | If a longer report title is required, then create additional report_title=xxx entries and these will be concatenated together based on the order in which they are listed in the configuration structure. | report_title=Lessons Learned Report |