
FastTrack Analytics - Configuration Case Studies
A key feature and value of the FastTrack Analytics is the ability for Planview Enterprise One Administrators to configure the reports, modifying the datapoints displayed on the report and controlling the behavior of the report including default parameters.
On this page you can view case study examples of FastTrack Analytic report configurations and personas which illustrate the power and flexibility delivered through the configurability of the FastTrack analytics and provides ideas for new and creative ways of harnessing their value.
Configuration Case Studies
In this section you can view case study examples of FastTrack Analytic report configuration which illustrate the power and flexibility delivered through the configurability of the FastTrack analytics and provides ideas for new and creative ways of harnessing their value.
| Configuration Area | Preview | Core Report | Type |
|---|---|---|---|
| Expose Key Project Milestone Dates on Summary Reports Expose Project Kickoff and Go-Live project milestone dates in WRK14 Display Milestone Dates in the Key Summary Information Section, in a separate section under the heading Project Milestone Dates |
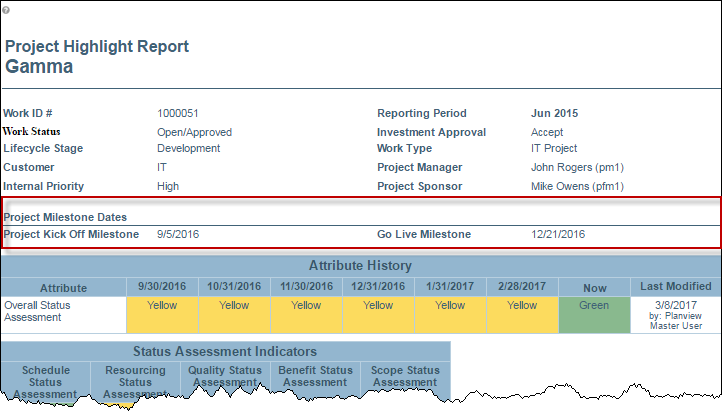 |
WRK13 WRK14 WRK16 STR16 |
Report Config |
| Display Lifecycle Stage Initiation Data and Duration Expose the first date that each lifecycle stage was initiated and the duration in days that it spent in that stage in WRK12 for each project in a portfolio. |
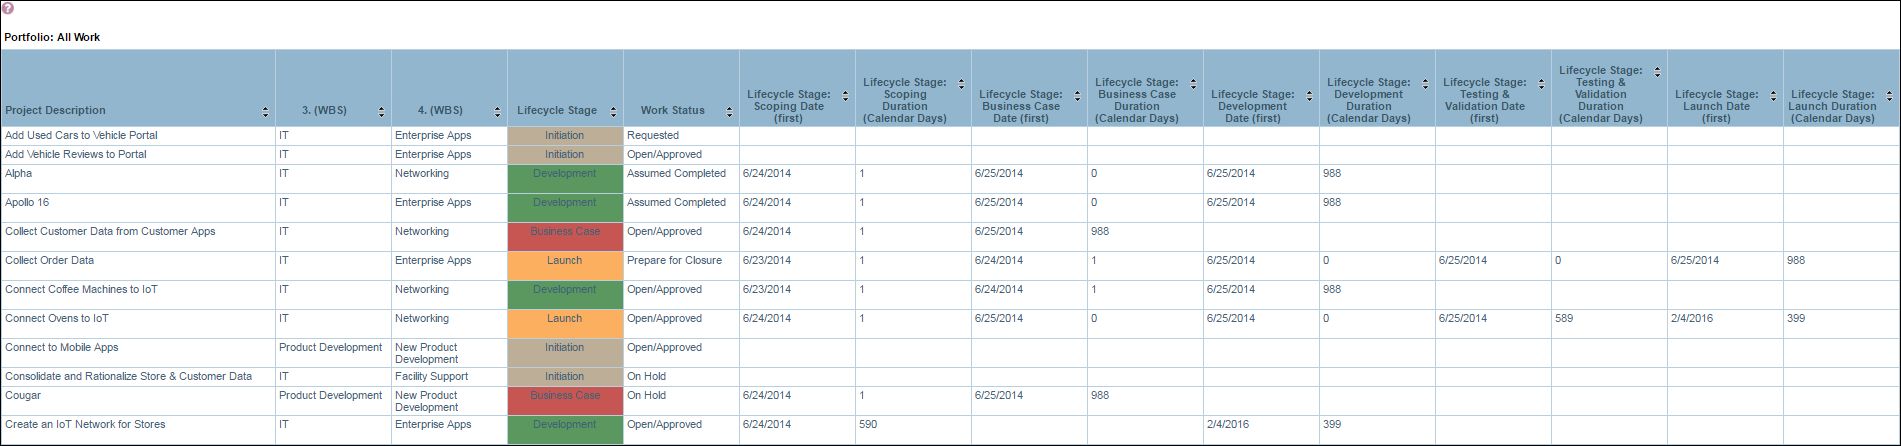 |
WRK12 | Report Config |
Persona Case Studies
Completely new reports can be created through a configuration process called Report Personas. In this section you can view case study examples of FastTrack Analytic report personas which illustrate the power and flexibility delivered through the configurability of the FastTrack analytics and provides ideas for new and creative ways of harnessing their value.
| Persona and Topic Area | Preview | Core Report | Type |
|---|---|---|---|
| Portfolio Manager > Investment Dependencies A bubble chart showing investment dependencies between entities in a portfolio used to highlight areas of impact |
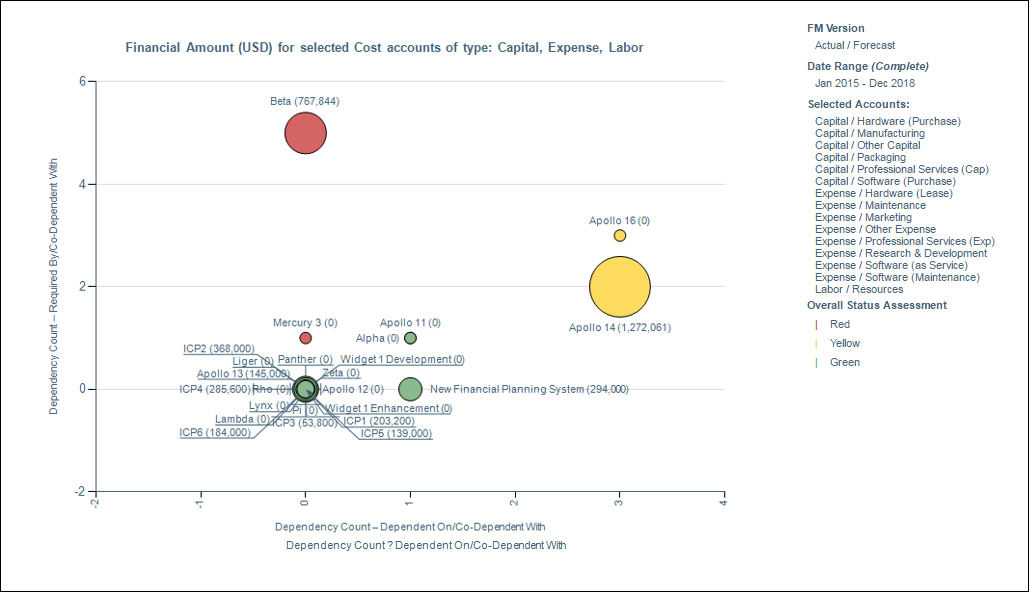 |
WRK33 STR33 OUT33 |
Report Persona |
| Resource Manager > What Projects are My Team are Working On A report showing resource assignments by project to provides a view of projects that have specific Resources assigned to them. |
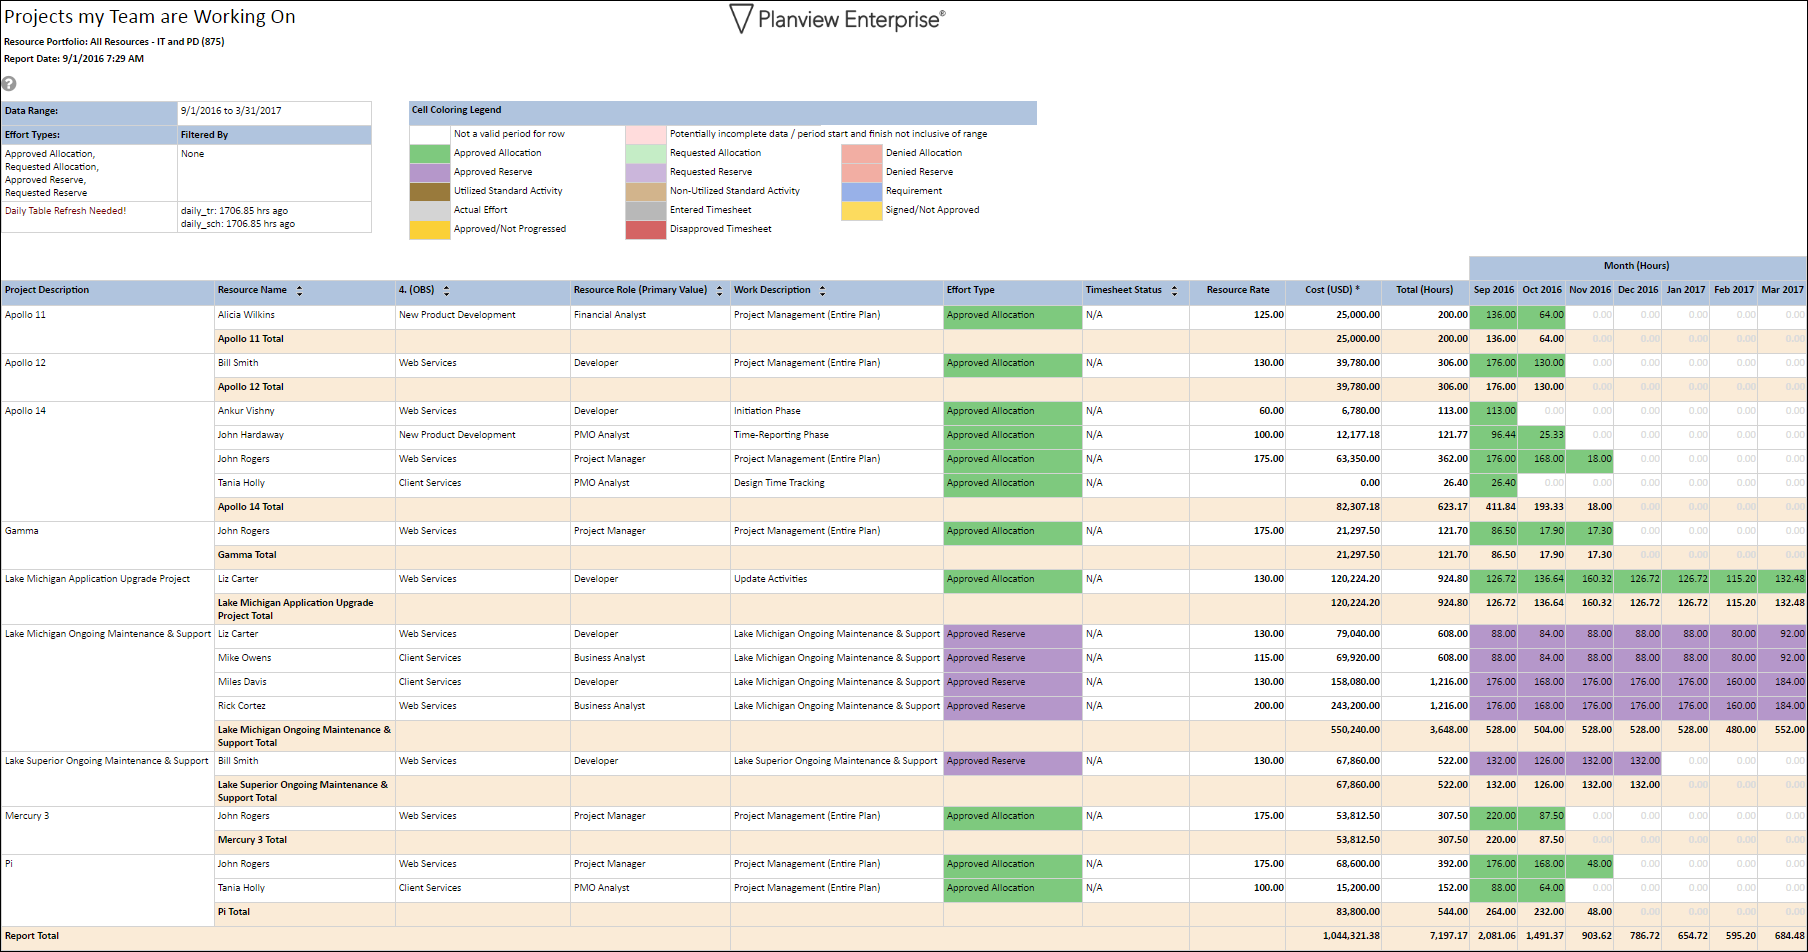 |
RES24 | Report Persona |
| Team Members > Timesheet Print Out for Contractors A report showing an extract of resource timesheets with audit information on approval. Ideal for use by contract resources to support invoices for payment. |
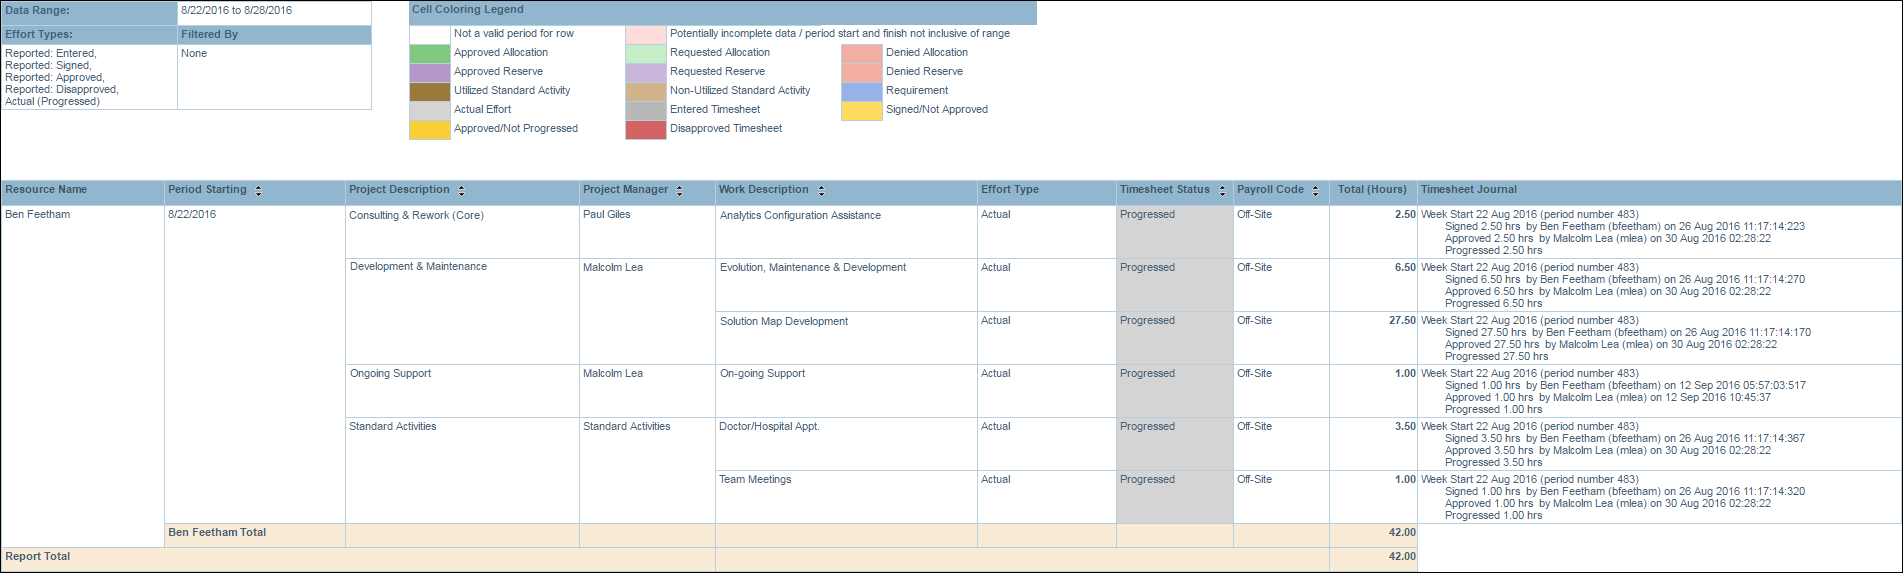 |
MY26 RES26 |
Report Persona |
| Finance > Cost Centre Recharge Export This report is designed to be used as a Cost Center Recharge Report to extract costed effort information based on the organizational recharge rates rate set and the hours worked by resources. |
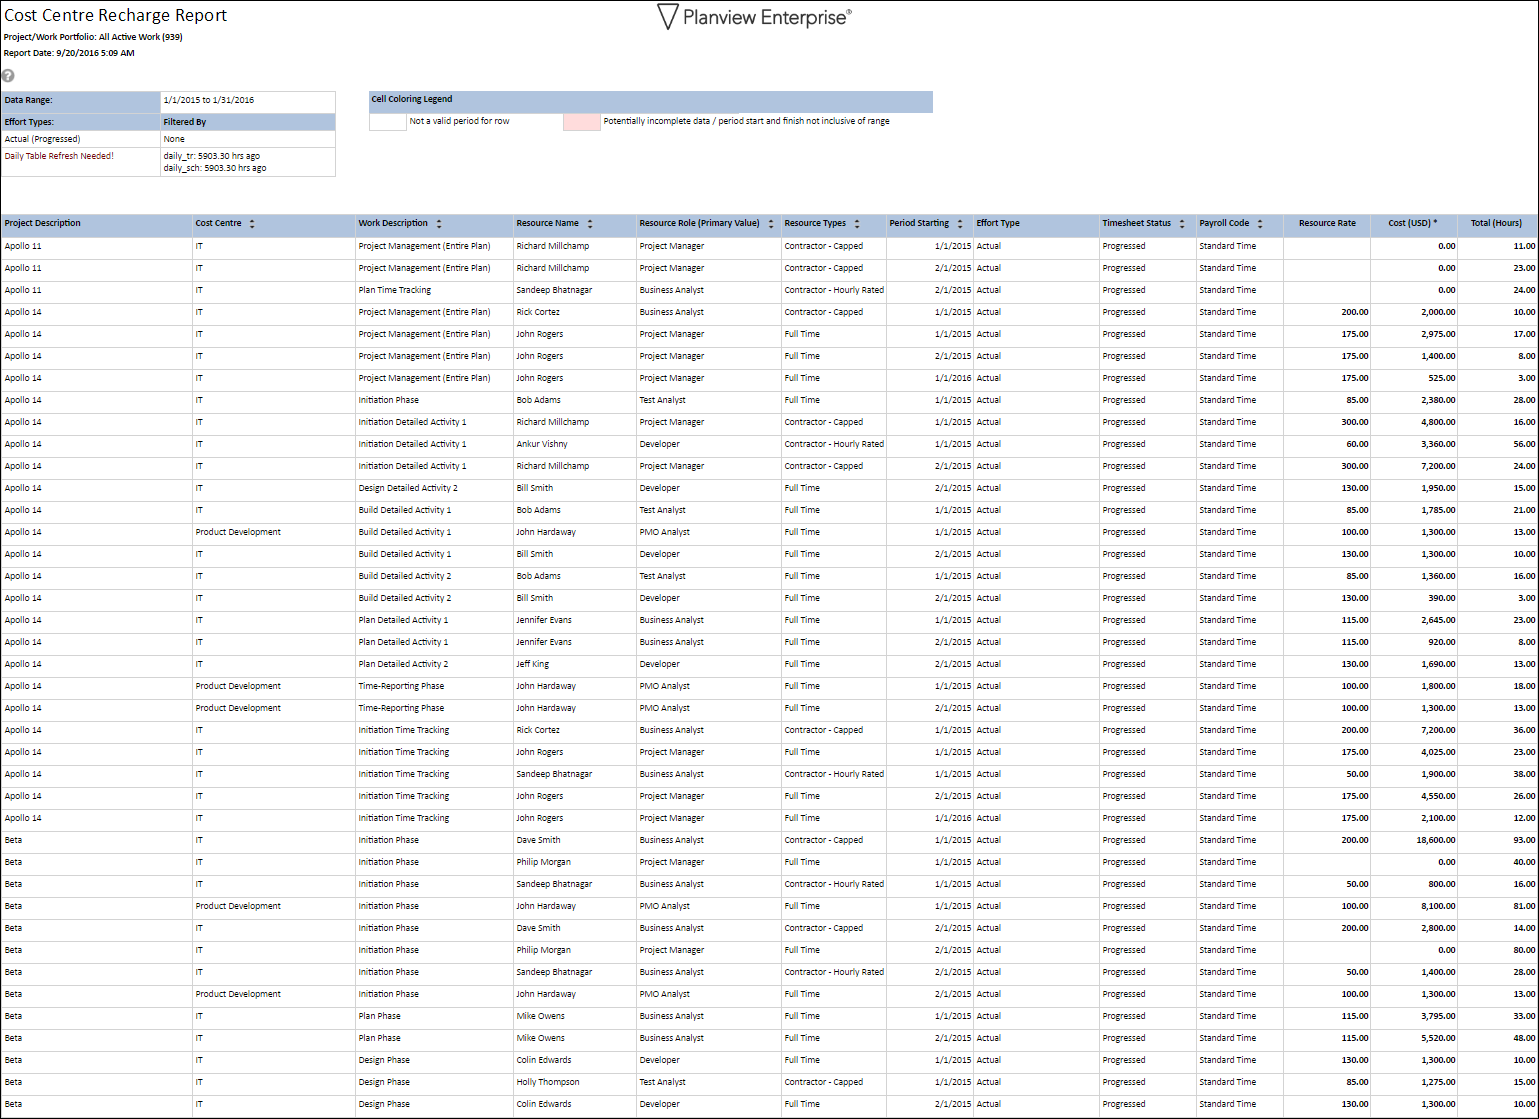 |
WRK26 RES26 |
Report Persona |
| Project Manager > Lessons Learned Report Report that provides an extract of Lessons Learned to provide future projects with a list of important lessons to share experiences of delivering projects. |
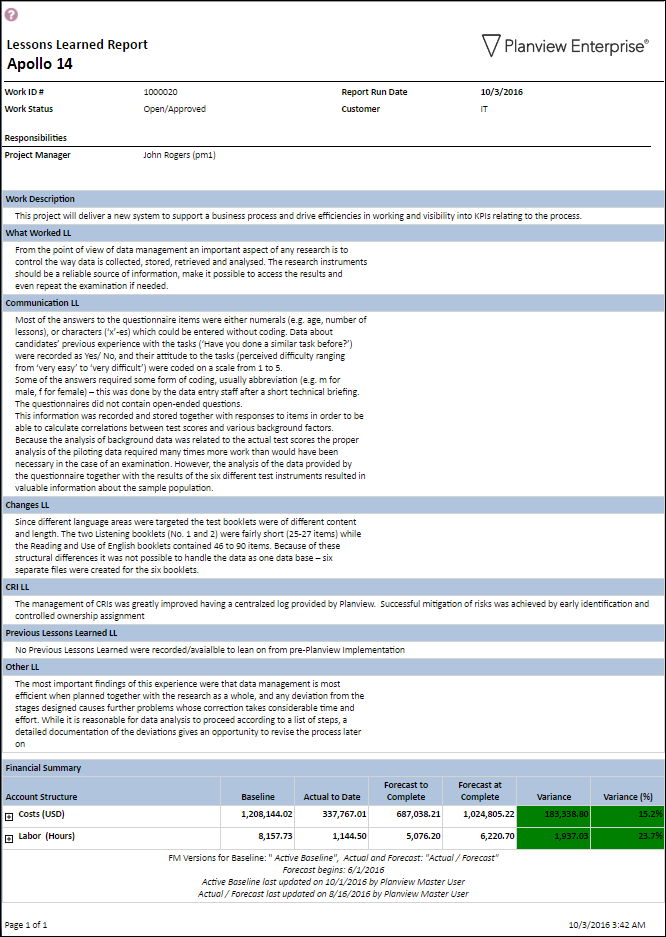 |
WRK14 | Report Persona |