
FastTrack Analytics Configuration
FastTrack Analytics can be configured in many ways, both individually and globally. This information will help report creators and administrators get the information they need.
 Configuration Principles
The FastTrack Analytics allow for configuration of individual report and the setting of global defaults across the reporting catalog. By harnessing the power of the configuration capabilities, the Planview Portfolios implementation consultant or the system administrator can control the data displayed in the report, modify the way that data is visualized in charts, change the behavior of parameters and update the look and feel of the outputs.
Introduction
The FastTrack Analytics allow for configuration of each report using a “special” alternate structure that holds global and report specific parameters that can be adjusted to control the data displayed in the report, the way that data is visualized in charts and the behavior of parameters. The alternate structure is called the “FastTrack Report Configuration” and is accessed in the alternate structure maintenance screen. Using this structure, the Planview implementation consultant or the Planview System Administrator can modify the following elements of the FastTrack analytics;
- Determine the data points that appear in the reports, for example swapping/adding/ removing attributes in the reports
- Controlling settings for charts and visualizations, for example the time interval used for time phased data
- Controlling the defaulting of values into user parameters so that the report can run with default parameters that fit the customer’s use case.
- Controlling formats for dates, numbers, durations
- Controlling colors in headers and tables and logo.
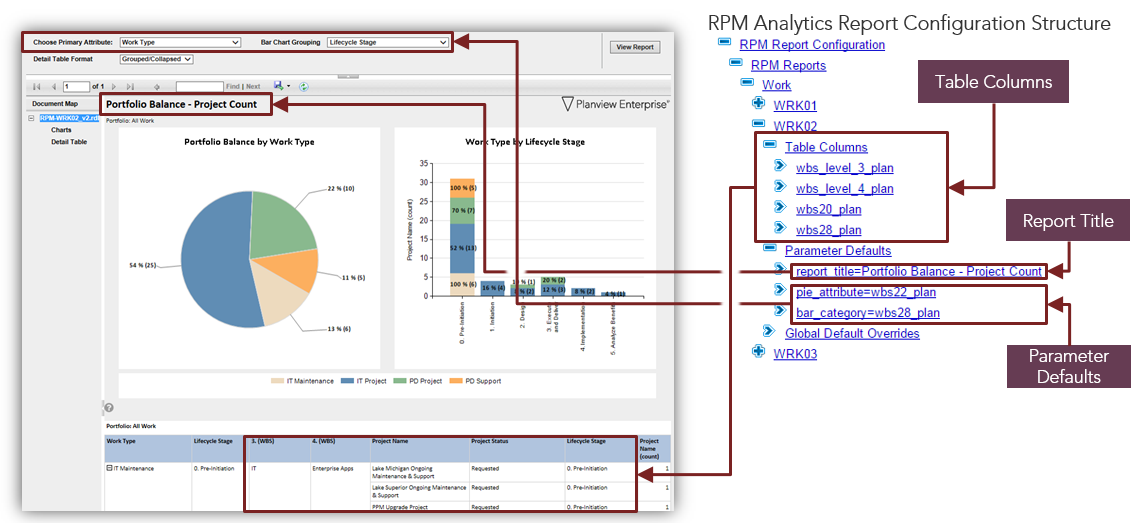
Example of Report Configuration Control
Editing Configuration Entities
- Navigate to the list of Planview Alternate Structures.
Administration > Attributes and Column Sets > Alternate Structures
- Click the FastTrack Report Configuration structure.
- Expand the structure, select FastTrack Reports and locate the relevant report ID.
Locate the parameter and click to edit. Click Save to confirm changes.
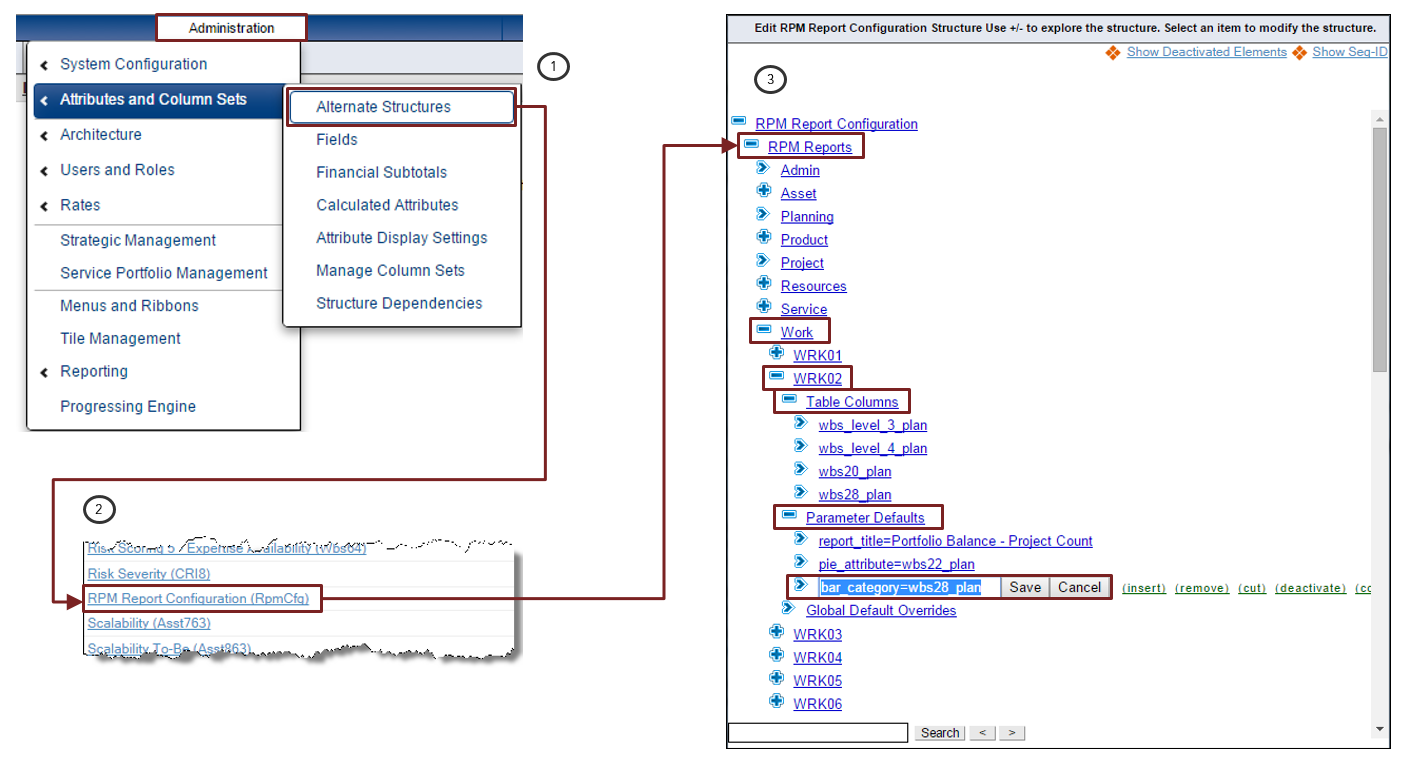
Example: FastTrack Reports > Work > WRK02 > Parameter Defaults > 'bar_category='
![]()
Reporting Attributes
In the context of the FastTrack Analytics, an attribute is defined as a data point that can be used in the reports. Attributes include, structures, fields, financial attributes, milestone dates, lifecycle data, and even historical attribute date and duration information.
Understanding the setup and use of attributes is key in harnessing the configuration possibilities of the FastTrack Analytics to the most value out of reports.
Structures and Fields
The settings that control the availability and properties of each attribute type are detailed below.
Primary Structure Parent Values
- All parent levels in the primary structure are automatically available as reporting attributes. The attribute name will be the level name entered in the primary structure definition.
- The attribute is available as an Analyzable Dimension (appearing in report categorization/slicer parameter lists) unless an entry has been added in the Excluded Attributes list in the FastTrack Configuration Structure
- The attribute name can be overridden by creating an entry in the Attribute Title Overrides list in the FastTrack Configuration Structure
Learn more about the general principles of using Structures.
Single Select Alternate Structures
- Single Select Alternate structures will be available as attributes provided that the attribute is enabled
- The alternate structure is available as an Analyzable Dimension (appearing in report categorization/slicer parameter lists) provided that it has been enabled to be “Available in Configurable Charts” in the Attribute Display Settings
- If the alternate structure is not enabled to be “Available in Configurable Charts” in the Attribute Display Settings it can be made available as an Analyzable Dimension by entry of the Attribute ID in the Analyzable Attributes list in the FastTrack Configuration Structure
- The attribute can be excluded as an Analyzable Dimension by entry of the Attribute ID in the Hidden Attributes list in the FastTrack Configuration Structure
- The attribute name can be overridden by creating an entry in the Attribute Title Overrides list in the FastTrack Configuration Structure
Learn more about the general principles of defining Alternate Structures.
Single Select Multi Level Alternate Structures Parent Levels
The FastTrack analytics provide the ability to expose a parent (ancestor) level value for an alternate structure.
The following Multi Level 'Location' alternate structure example is used to outline this functionality:
 Location (Loc)
 Continent North America
- Continent Asia
- Continent Europe
- Country Germany
 City Frankfurt
- Country France
- Country United Kingdom
- City London
- City Manchester
The 'City' level selected value (provided that the attribute is enabled) would be included by default in the framework using an attribute ID of 'loc_res'
The following steps outline how to create an attribute to expose the parent level of this structure for any selected value.
| Resource | Location Attribute Parent Level 2 | Location Attribute Parent Level 3 | Location Attribute Value |
| Resource Name | Continent | Country | City |
| Resource A | Europe | United Kingdom | London |
| Resource A | Europe | Germany | Frankfurt |
An entry for each parent level that you would like to add to the framework must be added to the FastTrack Report Configuration Structure in the format below.
- AltStructure|PrimaryStructure|ParentLevelNumber
Add the entry to the configuration branch “Attribute Modifications / Multi-Level Alternate Structures to Include” for each parent level that you would like to add to the framework.
Configuration Entry:
 FastTrack Report Configuration
- Attribute Modifications
- Multi-Level Alternate Structures to Include
 Loc|$Res|2
- Loc|$Res|3
See the following sub-section for generating the attributes in the framework.
Using the Newly Generated Parent Attributes
Following the addition of FastTrack Report Configuration Structure Entry outlined above, ADM01 - FastTrack Report & Metadata Configuration must be executed with the Refresh Metadata parameter set to yes to create the new Attribute.
The new attribute will appear in the Attribute Lists under the relevant entity type along with the attribute ID.
- Attribute Title - Attribute ID
- Location (Continent) - loc_lv2_res
- Location (Country) - loc_lv3_res
This attribute ID can then be used against specific reports by adding it to the appropriate configuration structure node i.e as a table column.
TOPTOP: These Attribute Titles can be renamed by using the “Attribute Title Overrides” branch using the attribute IDs generated for those new attributes.
Multi Select Alternate Structures
- Multi Select Alternate structures will be available as attributes provided that the attribute is enabled.
- Multi Select attributes are displayed as a concatenate list of values.
Example attribute ID for a concatenated list of the roles assigned to each resource; obs20_concat_res. - If the attribute is defined to support a Primary Value, then the alternate structure will have a Primary Value entry in the attribute list.
Example attribute ID for the role marked as primary for each resource; obs20_prim_res. - Multi Select Alternate Structures cannot be used as Analyzable Dimensions.
- The attribute name can be overridden by creating an entry in the Attribute Title Overrides list in the FastTrack Configuration Structure
- When using Multi Select Alternate structures with either 'Capture Associated Number' or 'Capture Associated Text' enabled, it is possible to expose the percentage, number or additional text in parentheses after each value in the concatenated attribute.
The ability to turn on or off the additional percent/number/text details of the multi-select concatenation is controlled using the configuration entry “concat_ms_alt_show_addtl=Y/N” in Global Defaults. This functionality is turned off by default. - The delimiter used between the returned values of concatenated multi-select alternate structures can be configured using the entry “concat_ms_alt_delim=" in Global Defaults
The default is a comma followed by a space (“concat_ms_alt_delim=, “) but this can be changed to anything including a new line character using "/n" (“concat_ms_alt_delim=/n”) - The 'new line' delimiter parameter is also supported in the other concatenation configuration entries (concat_strat_in_work_delim and concat_work_in_strat_delim).
Learn more about the general principles of defining Alternate Structures.
Custom Fields
- Custom Fields will be available as attributes provided that the field is enabled.
- Custom Fields cannot be used as Analyzable Dimensions.
- The attribute name can be overridden by creating an entry in the Attribute Title Overrides list in the FastTrack Configuration Structure
Learn more about the general principles of administering Fields
Long Text Fields
Long text fields in the database are limited to 4000 characters - entries longer than that are split into multiple records. The FastTrack Analytics, by default, only show the first record (maximum of 4000 characters) because of the report performance overhead involved in concatenating the records (and the bulk on the report).
To address this there is configuration option to identify which long text attributes should have multiple records concatenated in the report framework. This is controlled in the FastTrack Report Configuration alternate structure under Attribute Modifications >> Long Text to Concatenate. The attribute ID of the long text field is added into this branch and the ADM01 report executed with Refresh Metadata = Yes.
Learn more about the general principles of administering Fields
Notes in Work and Assignments
Project Notes that are entered and maintained in the 'Notes' Tab of the Task Information window in Work and Assignments are available as attributes (Non-Analyzable Dimension attributes) in the FastTrack Framework.
Two attributes will automatically generate into the Framework (following an ADM01 metadata refresh), for every value in the 'Notes (NotCrt)' alternate structure:
- Note - (prj_note_SEQ-ID_full)
- Note Abstract - (prj_note_SEQ-ID_short)
Notes (NotCrt) Alternate Structure:
- Note Type
- Status Report Summary (10762)
- Executive Comments (10880)
- Status Report Summary Note - (prj_note_10762_full)
- Status Report Summary Note Abstract - (prj_note_10880_short)
- Executive Comments Note - (prj_note_10762_full)
- Executive Comments Note Abstract - (prj_note_10880_short)
- The 'Note' attribute will contain the latest record (by note date) from the 'Long Description' box for the relevant note type
- The 'Note Abstract' attribute will contain the latest record (by note date) from the 'Short Description' box for the relevant note type
The Note attributes will return the relevant note data from the corresponding level in the WBS structure,
i.e. if the report contains rows of below ppl task level information, then the notes column will return the corresponding notes from that task line.
If the report only contains project level information rows, then the notes column will return the corresponding notes from the project level only.
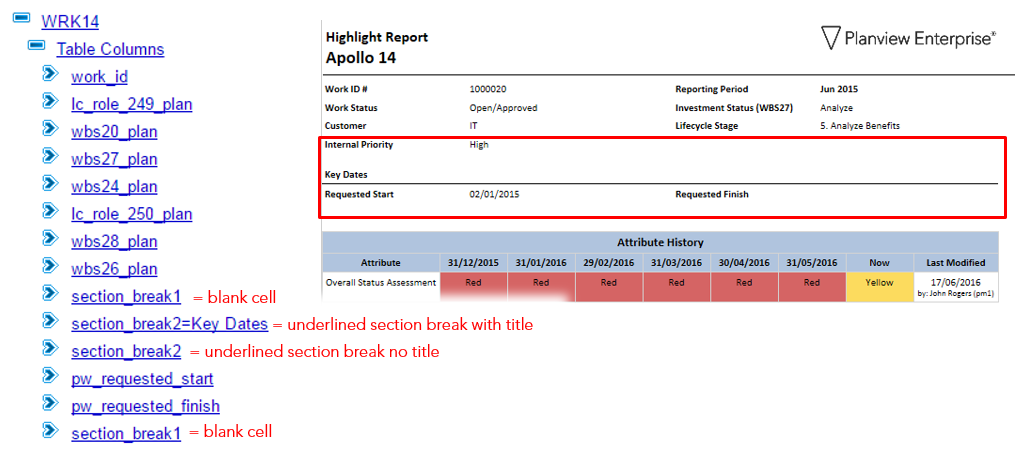
The below example outlines configuring project level Notes in the WRK14 - Project Highlight Report.
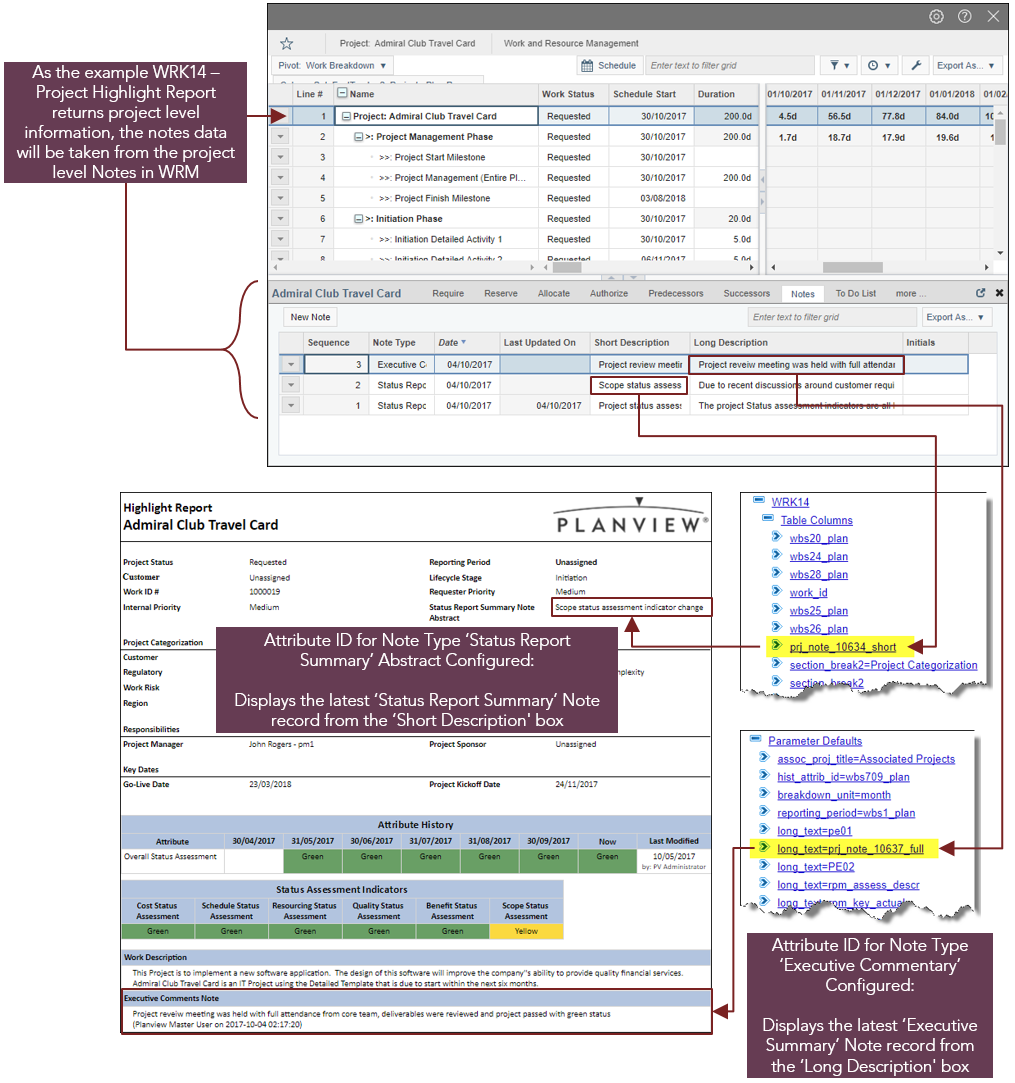
Configuration example
Attribute History Dates and Duration
Alternate Structure History Dates and Duration Attributes
It is possible to configure custom date attributes for use in the FastTrack Analytics to expose historical attribute value information.
The following derived alternate structure attributes utilize the attribute history functionality and are available to any Single-Select alternate structure with Keep History enabled in the attributes definition. See Enabling or Disabling History Tracking on an Alternate Structure for more detail
- Alternate Structure History Date
- First Date - This attribute displays the date that the current value was first assigned.
- Last Date - This attribute displays the date that the current value was most recently assigned.
- Alternate Structure Duration
- Duration Business Days - This attribute shows the duration that the current recent value has been set for in business days
- Duration Calendar Days - This attribute shows the duration that the current recent value has been set for in calendar days
- Duration Hours - This attribute shows the duration that the current recent value has been set for in hours
The following sections document the creation and use of Alternate Structure History Dates and Durations in the FastTrack Report Configuration Structure.
Generating Alternate Structure History Dates and Durations
Due to the almost limitless number of Alternate Structure History Date and Duration attributes potentially possible (dates and duration for every attribute value), any desired attribute dates have to be created and added manually to the framework to expose them for use in the FastTrack Analytics.
This is achieved by adding a configuration entry for each of the required attributes in to the configuration structure under:
- FastTrack Report Configuration > Attribute Modification > Attribute Dates
- attribute_id=sequence_id|aggregation
- Attribute_id can be from any enabled single select alternate structure.
- Sequence_id (or structure_code) of any leaf entry in the alternate structure.
- If you would like to create date attributes for all leaf items for that attribute you can use the entry “ALL”
- Aggregation can be any of the following values:
- first – shows the first time the attribute was set to that status.
- Last – shows the last time the attribute was set to that status
- dbd – “duration business days” – shows the duration that value was set to in business days (using the standard calendar) – always uses the most recent time that the value was set.
- dcd – “duration calendar days” – shows the duration that value was set to in calendar days – always uses the most recent time that the value was set.
- dh – “duration hours” – shows the duration that value was set to in hours
Any new attributes not yet in the framework must be added to the framework using ADM01 before a date attribute can be generated.
Example
Use case:
When did the project manager first highlight something was wrong with the delivery of the project?
Administrative Definition:
I would like to expose a date attribute value showing the first time a projects Overall Status Assessment Value was turned to RED
- Attribute_id: Overall Status Assessment (Wbs709) - Wbs709_plan
(Keep History has been in use since attribute creation) - Sequence_id: Available Values:
- >> Red (Seq-ID = 83)
- >> Yellow (Seq-ID = 84)
- >> Green (Seq-ID = 85)
- Aggregation: first – shows the first time the attribute was set to that status
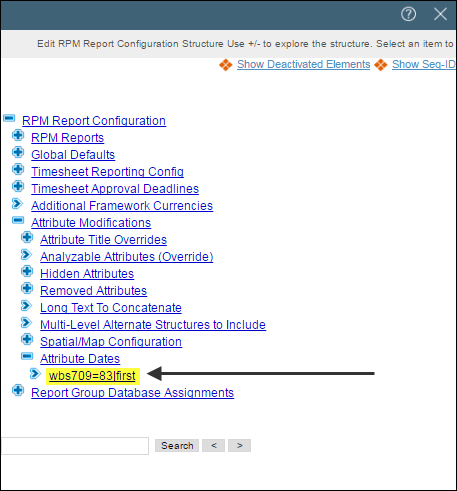
FastTrack Report Configuration Structure Entry:
wbs709_plan=83|first
Example
Using the Newly Generated Date and Duration Attributes
Following the addition of FastTrack Report Configuration Structure Entry outlined above, ADM01 - FastTrack Report & Metadata Configuration must be executed with the Refresh Metadata parameter set to yes to create the new Attribute.
The new attribute will appear in the Attribute Lists under the relevant entity type along with the attribute ID.

This attribute ID can then be used against specific reports by adding it to the appropriate configuration structure node i.e as a table column.
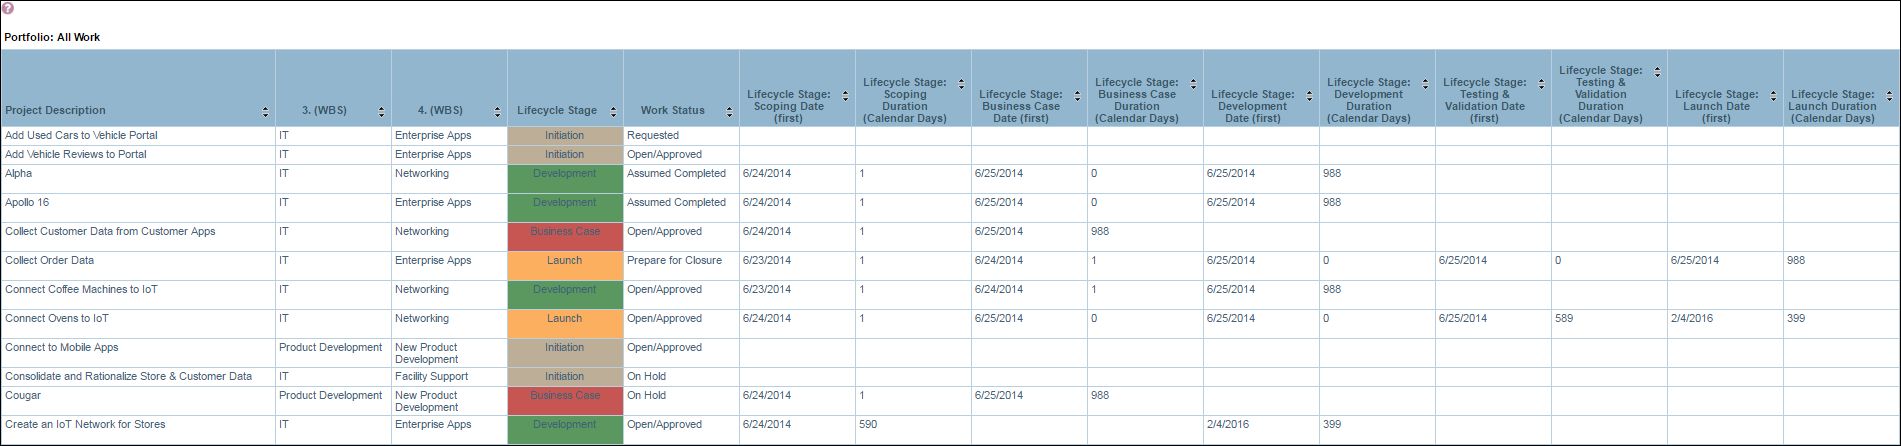
Create Lifecycle Stage Activation Date and Duration Attributes
Objective: To create new reporting history date and duration attributes exposing the date the attribute was first set and the length of time spent as that value.
This exercise will create two history attributes in the FastTrack Analytics framework for each value which, when added to a report, will display:
- Alternate Structure First Date
- Alternate Structure Duration in Calendar Days
This requires that the Lifecycle Stage attribute is being used and the correct value of this attribute for each project is being set at the appropriate times during the project's delivery.
Configuration:
- Add configuration entries for each of the required lifecycle stage first set dates and duration in days in to the configuration structure. (See right)
attribute_id=sequence_id|aggregation
- Attribute_id: Lifecycle Stage (Wbs28)
- wbs28_plan
- Sequence_id: Values:
- >> Scoping (WBS28JUSTF)
- >> Business Case (WBS28SCOPE)
- >> Development (WBS28EXECD)
- >> Testing & Validation (WBS28DPLOY)
- >> Launch (WBS28ANLBN)
- TOPTIP: Instead of adding an entry for each value for lifecycle stage, it is possible to create an attribute for each one using 'all' in a single entry instead of the value Sequence ID
- Aggregation:
- first – shows the first time the attribute was set to that status.
- dcd – “duration calendar days” – shows the duration that value was set to in calendar days – always uses the most recent time that the value was set.
Configuration Entry:
- FastTrack Report Configuration
- Attribute Modifications
- Attribute Dates
- wbs28_plan=all|first
- wbs28_plan=all|dcd
- Expose the Milestone date attributes in the framework by executing ADM01 with the Refresh Metadata parameter set to yes.
- Identify the Attribute IDs of newly created attributes in ADM01.
- Lifecycle Stage: Scoping Date (first) = fst_wbs28justf_plan
- Lifecycle Stage: Scoping Duration (Calendar Days) = dcd_wbs28justf_plan
- Lifecycle Stage: Business Case Date (first) = fst_wbs28scope_plan
- Lifecycle Stage: Business Case Duration (Calendar Days) = dcd_wbs28scope_plan
- Lifecycle Stage: Development Date (first) = fst_wbs28execd_plan
- Lifecycle Stage: Development Duration (Calendar Days) = dcd_wbs28execd_plan
- Lifecycle Stage: Testing & Validation Date (first) = fst_wbs28dploy_plan
- Lifecycle Stage: Testing & Validation Duration (Calendar Days) = dcd_wbs28dploy_plan
- Lifecycle Stage: Launch Date (first) = fst_wbs28anlbn_plan
- Lifecycle Stage: Launch Duration (Calendar Days) = dcd_wbs28anlbn_plan
The attributes are now created and ready for use in the FastTrack Analytics.
Using Date and Duration Attributes in Portfolio Summary Report (WRK12)
Objective:
- Expose the first date that each lifecycle stage was initiated and the duration in days that it spent in that stage in a report (WRK12) for each project in a portfolio.
WRK12
Configuration:
Add the date and duration attributes in to the WRK12 configuration structure to expose them as columns in the report output.
Columns will appear in the order they are added in the structure.
Configuration Entry:
- FastTrack Report Configuration
- FastTrack Reports
- Work
- WRK12
- Table Columns
- fst_wbs28justf_plan
- dcd_wbs28justf_plan
- fst_wbs28scope_plan
- dcd_wbs28scope_plan
- fst_wbs28execd_plan
- dcd_wbs28execd_plan
- fst_wbs28dploy_plan
- dcd_wbs28dploy_plan
- fst_wbs28anlbn_plan
- dcd_wbs28anlbn_plan
Financial Management Attributes
Two sets of financial management attributes are available in the FastTrack Analytics Framework for inclusion in reports;
Derived Financial Management Attributes
For all FastTrack Analytics versions a set of derived financial attributes are available for all entities that support financial management, eg. work, strategy, product. These attributes are all prefixed with "FM: " in the attribute name and an attribute ID that is prefixed with "grs_fm_". They are automatically derived based upon;
- Financial Management currency values only, for the system currency
- In a system configured for multi-currency, an attribute is derived only for the Default currency
- An attribute is derived for each account type; Labor costs, Capital costs, Expense costs and Benefits
- Data is returned for ALL periods in the Enterprise and Fiscal Calendar (not the Planning Horizon in the Financial Planning Model), which can result in the reporting of financial data values that are not visible in the financial plan and are not included in any Financial Management Subtotal columns
- For each account type an attribute is derived for "Forecast", using data in the version marked as Forecast and an attribute for "Budget" using the version marked as Baseline
- Using the Financial Planning Model Forecast Period to determine which periods are classified as actuals and forecast, an attribute is derived for each account type/version as"Actual", and a second attribute for "Remain"
- The data returned by these financial attributes uses only the default Financial Planning Model for the entity
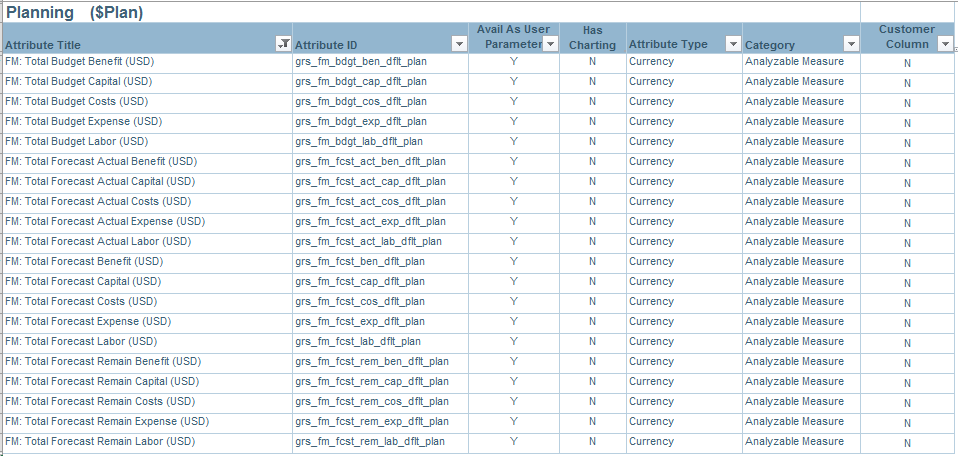
Example of Derived Financial Attributes as viewed in the ADM01 - FastTrack Report & Metadata Configuration report.
Financial Management Column Attributes
A set of financial management attributes based on Financial Management Sub Total and Calculated columns are automatically derived and available for use in reports. These attributes have an attribute name that matches the configured column name and have attribute IDs prefixed with "ifm_".
- An attribute is derived for each entity (work, strategy, products) for each Sub Total and Calculated column enabled for use with that entity
- Only columns that are configured to use the Version Marked as Forecast or the Version Marked as Baseline will be used
- Calculated columns of the IRR Type are not available as a reporting attribute
- The data returned by these financial attributes uses only the default Financial Planning Model for the entity
- Currency based columns will always display values based on the system currency
- In a system configured for multi-currency, the value is always shown in the Default currency
- For further information on creating and managing the Subtotal and Calculated Financial Management columns refer to: Adding Subtotal Financial Planning Columns and Create Financial Planning Calculated Columns.
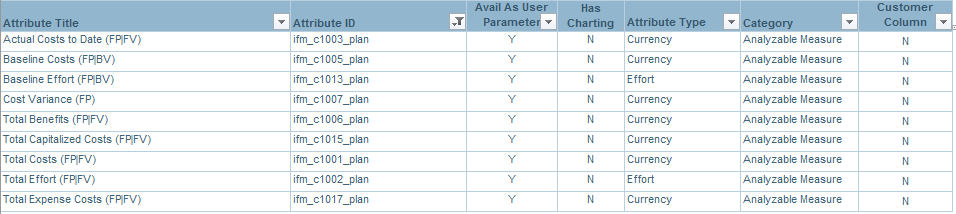
Example of Financial Management Column Attributes as viewed in the ADM01 - FastTrack Report & Metadata Configuration report.
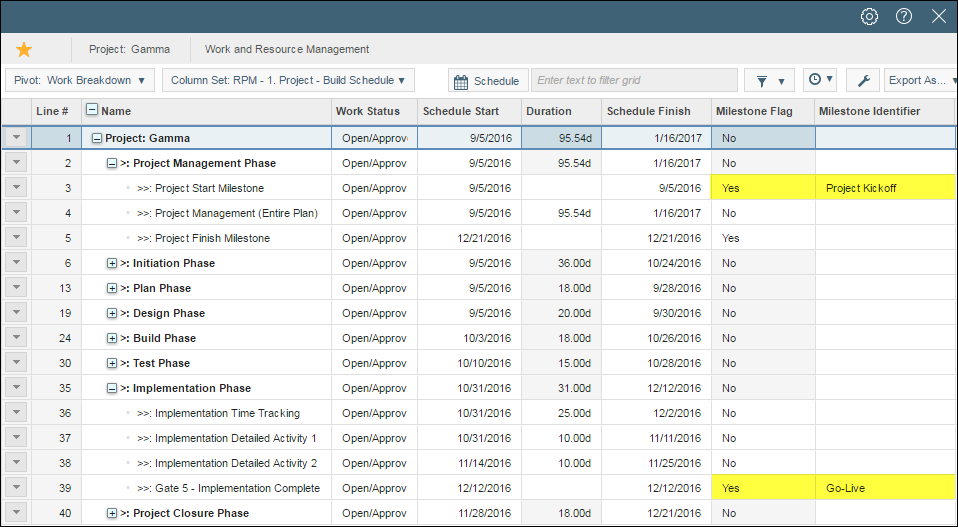
Milestone Date Attributes
It is possible to expose milestone dates for use in the FastTrack Analytics.
The following derived milestone date attributes can be created for any line in the WRM schedule (below PPL) for a defined milestone type. The Milestone Flag column must also be set to Yes. See Setting Work Milestones for more detail
- Milestone Start Date - Start date of the first milestone of that type
- Milestone Finish Date - Finish date of the first milestone of that type
The following sections document the creation and use of Milestone Dates in the FastTrack Report Configuration Structure
Generating Milestone Dates
Any desired Milestone Dates have to be created and added manually to the framework to expose them for use in the FastTrack Analytics.
This is achieved by adding a configuration entry for each of the required attributes in to the configuration structure under:
- FastTrack Report Configuration > Attribute Modification > Attribute Dates
- attribute_id=sequence_id|aggregation
- Attribute_id can be from any enabled single select milestone attribute (alternate structure).
- Sequence_id (or structure_code) of any leaf entry in the milestone attribute.
- If you would like to create milestone date attributes for all leaf items for that attribute you can use the entry “ALL”
- Aggregation can be any of the following values:
- msf – First Milestone Date - Date of the first milestone of that type
- msl – Last Milestone Date - Date of the last milestone of that type
Any new attributes not yet in the framework must be added to the framework using ADM01 before a date attribute can be generated.
Example
Use case:
What is the due date of the last governance milestone for the project?
Administrative Definition:
I would like to expose the date of the last milestone where Milestone Type = Governance
- Attribute_id: Milestone Type (Wbs712_plan)
- Sequence_id: Available Values:
- >> Governance (Seq-ID = 86)
- >> Deliverable (Seq-ID = 87)
- >> External (Seq-ID = 88)
- Aggregation: msf – finish date of the first milestone of that type
FastTrack Report Configuration Structure Entry:
wbs712_plan=86|msf
Using the Newly Generated Milestone Dates
Following the addition of FastTrack Report Configuration Structure Entry outlined above, ADM01 - FastTrack Report & Metadata Configuration must be executed with the Refresh Metadata parameter set to yes to create the new Milestone Date Attribute.
The new attribute will appear in the Attribute Lists under the relevant entity type along with the attribute ID.
This attribute ID can then be used against specific reports by adding it to the appropriate configuration structure node.
Configuration Examples
A key feature and value of the FastTrack Analytics is the ability for Planview Administrators to configure the reports, modifying the datapoints displayed on the report and controlling the behavior of the report including default parameters.
This section provides examples where Milestone Dates have been used in Analytics which illustrate the power and flexibility delivered through the configurability of the FastTrack analytics and provides ideas for new and creative ways of harnessing their value.
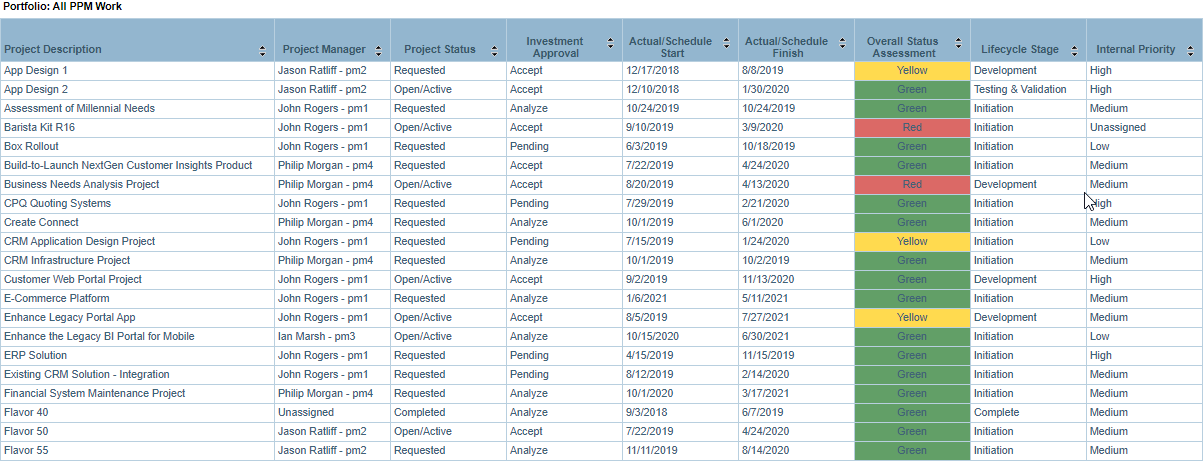
Create Attributes for Project Kickof and Go-Live Project Milestone Dates
Objective: To create new reporting attributes exposing key project kickoff and go-live milestone dates for use in the FastTrack Analytics.
This exercise will create two milestone date attributes in the FastTrack Analytics framework which, when added to a report, will display the date of the project milestones where:
- Milestone Identifier = Project Kickoff
- Milestone Identifier = Go-Live
This requires the inclusion of the Milestone Identifier Alternate Structure as a column in a column set in WRM.
.png?revision=2)
Example of identifying the relevant project milestones with the Project Kickoff and Go-Live Milestones Identifier values.
Note: Although this is not the intention of the Milestone Identifier attribute, it is possible to assign multiple milestones the same value of milestone identifier. If this is done the date returned will either be the first or last milestone with that value, depending on which of the Aggregation values is used in the configuration:
- First Milestone Date - Date of the first milestone of that type
- Last Milestone Date - Date of the last milestone of that type
Configuration:
- Add a configuration entry for each of the required milestone dates in to the configuration structure:
attribute_id=sequence_id|aggregation
- Attribute_id: Milestone Identifier (Wbs714_plan)
- Sequence_id: Values:
- >> Project Kickoff (Seq-ID = 7332)
- >> Go-Live (Seq-ID = 7334)
- Aggregation: Date of the last milestone of that type - msf
Configuration Entry:
- FastTrack Report Configuration
- Attribute Modifications
- Attribute Dates
- wbs714_plan=7332|msf
- wbs714_plan=7334|msl
- Expose the Milestone date attributes in the framework by executing ADM01 with the Refresh Metadata parameter set to yes.
- Identify the Attribute IDs of newly created attributes in ADM01.
- Project Kickoff Milestone = msf_7332_plan
- Go-Live Milestone = msl_7334_plan
The attributes are now created and ready for use in the FastTrack Analytics.
Use Attributes in Reports - Display Milestone Dates in Project Status Report (WRK13, WRK14, WRK16)
Objective:
- Expose Project Kickoff and Go-Live project milestone dates in WRK14
- Display Milestone Dates in the Key Summary Information Section, in a separate section under the heading Project Milestone Dates
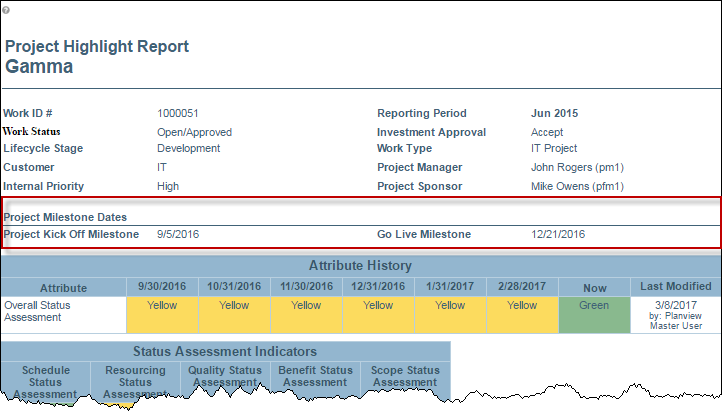
Example
Configuration:
Add the milestone date attributes to the WRK14 configuration structure table columns section, including the appropriate entries for section titles.
Configuration Entry:
- FastTrack Report Configuration
- FastTrack Reports
- Work
- WRK14
- Table Columns
- section_break2=Project Milestone Dates
- section_break2
- msf_7332_plan
- msl_7334_plan
See here for more details on Key Summary Detail Information Section configuration.
Highlight Reports Summary Section Configuration
Configuring Blank Cells, Section Breaks, and Titles into Reports
Configuration entries are available to format the layout of specific reports to have blank cells, section breaks and section titles. Available Options for adding in to the report header are
- Section Break blank gap between attributes: section_break1
- Section Break with Heading: section_break1=heading
- Section Break with Line: section_break2
- Section Break With Line and Heading: section_break2=heading
The section_break syntax should be added in the appropriate place in the order of table columns it is required to divide. Two entries should be added in a row to ensure the heading spans both columns in the report header section.
The reports that support these configuration options include;
 Analytics Look and Feel
The Look and Feel configuration settings are maintained in the Global Defaults branch of the FastTrack Report Config structure and can be used to control the fonts, colors and formats of data displayed in the FastTrack Analytics.
Each report has Global Default Overrides section where different report specific formatting can be defined, using the same conventions.
The Global Options topic has information on Global Options not associated with the look, feel and formatting of the reports.
Managing and Formatting Attributes
The following options exist to modify the default behavior of attributes.
Table Column Text Alignment and Formatting Options
It is possible to format the appearance of table columns when they are displayed in the analytics, for example applying a text alignment, text color or background color format to the display of the attribute in the detailed table in an analytic. The available formatting options are;
Text Column Alignment
- |Left
- |Middle or |Center
- |Right
Number Formats
- Refer to the FastTrack Analytics - Global Defaults section for the available formatting rules.
Background and Foreground Coloring
This is provided as a format directive instead of number formats. It only applies to single select alternate structures that have charting colors defined.
- |fc (font color)
- |bgc (background color)
For additional information on attribute color controls refer to the Managing Attribute & Report Colors topic.
Convention
The attribute entry in the report configuration table column section is updated to specify the alignment and format options, in with each option separated with a "|" pipe symbol;
Attribute ID|Alignment|Format
Example, to display Lifecycle Stage, center justified, with the background color as specified in the attribute charting values enter the following into the table column configuration;
wbs28_plan|center|bgc
Formatting configuration is optional, but if using a format then the alignment option must be specified as well.
Overriding Attribute Titles
The label/title applied to an attribute is, by default, based on the configuration of that attribute in core Planview or, for some derived attributes (levels of structure, etc.), the name is initially set by Planview.
If required, this title can be overridden by creating an entry in the Attribute Title Overrides branch of the FastTrack Analytics Configuration alternate structure. The attribute ID and the “new”/revised title of the attribute should be added.
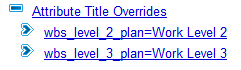
The ADM01 Report/Refresh Metadata = Y must be executed following any changes to Attribute Title Overrides.
Excluding Attributes
All enabled attributes are available in the FastTrack Framework for configuration into a report. Some attributes, however, are available for the end user to choose from (these are called “analyzable” attributes). This can result in a large list of unnecessary attributes in a report parameter dropdown list. Specific attributes can be hidden (but kept in the framework for administrative inclusion) by performing any of the following steps;
- Un-enabling the attribute in the alternate structure and field configuration (completely removed from the framework)
- For Alternate Structures, un-enabling the “Available in Configurable Charts” option on the Attribute Display Setting screen
- Creating an entry for the Attribute ID in the Hidden Attributes branch of the FastTrack Report Configuration alternate structure
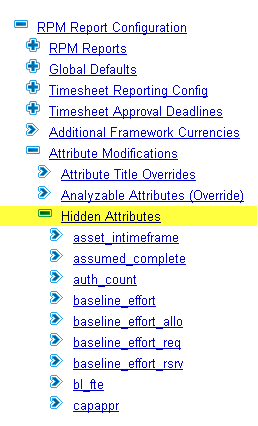
After any of these changes the ADM01 - FastTrack Report & Metadata Configuration Report must be executed with the Refresh Metadata Parameter set to 'Yes'.
Deleting Attributes
For large customers or those with a large number of attributes that don’t need to be available for reporting, you can identify attributes to be physically removed from the framework. The advantage of this method is that (for large customers) some query efficiency can be gained by reducing the number of attributes enumerated in the framework views. This should be done cautiously as it could cause reports to fail if they reference an attribute that has been marked for deletion

Enabling Attributes as Analyzable Dimensions
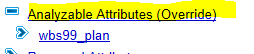
There are instances where an alternate structure is not “Available in Configurable Charts” in the Planview application, but should be available as a user selectable parameter in the FastTrack reports. An alternate structure such as this can be included in the FastTrack framework by adding an entry for the Attribute IDs to the “Analyzable Attributes (Override)” branch of the configuration structure:
Managing Attribute and Report Colors
By default, colors from a default color palette are used are used in the FastTrack Analytics. If required, these can be overridden to apply specific colors to specific attribute values. For example, to ensure that a status with values of Red, Amber/Yellow and Green is shows in the reports with the appropriate colors.
Colors can be applied to alternate structures (known as attribute charting colors) for when they are used as attributes in the FastTrack Analytics. These charting colors are used in charts and graphs, and can also be applied to an attribute when it is displayed as a table column in a report.
Custom color palettes can also be configured for use in report charts. These can be applied to specific reports as a global default override (this is useful for those reports which display charts but do not use alternate structures as attributes, and therefore cannot have charting colors applied. Examples of this include WRK32 - Work Portfolio Financial Burndown Comparison, STR32 - Strategic Portfolio Financial Performance, and OUT32 - Outcome Portfolio Revenue / Cost Performance, which are used to compare multiple versions of the financial plan).
The default color palette is configurable for all FastTrack reports in the "Global Defaults" branch of the FastTrack Report Configuration (RpmCfg) alternate structure- this is generally set to: "color_palette=Planview" (see below).

These colors are used, in order, by charts when a custom color palette is not assigned to a report or when a color is not explicitly assigned to the category/slicer/dimension. Colors can be assigned to alternate structure values only using the "Charting" link available on the Alternate Structure administration page.
If the "Planview" color palette has not been activated, the default color palette will be Microsoft's "BrightPastel". The color palette configuration value can be updated to any of the standard Microsoft color palette names, or alternatively any number of custom color palettes can be configured and used globally or for specific reports.
Adding a Custom Color Palette
Multiple custom color palettes can be configured, and can be applied to specific reports as a global default override. The process for adding a custom color palette is detailed below:
- Administration > Attributes and Column Sets > Alternate Structure > FastTrack Report Configuration (RpmCfg) > Show Deactivated Elements
- Reactivate Color Palettes
- Add Custom Color Palette (palette name should not include spaces and should be less than 30 characters long)
- Under the palette name, create entities using the color HEX code value. IMPORTANT: the order in which the colors are added will determine the order in which they are used for reports- it is recommended that a variety of distinct colors is used in the palette to ensure the readability / clarity of reports.
Example
Applying Custom Color Palettes to Reports
NOTE
Applying a custom color palette will only affect report charts (not table cell background colors etc. - see below for further details on how to apply specific attribute colors to alternate structure / report table columns).
To apply a custom color palette to a report:
- Administration > Attributes and Column Sets > Alternate Structure > FastTrack Report Configuration (RpmCfg) > expand options for relevant report
- Add a global default override for the report: "color_palette=PALETTENAME"
- Applying a custom color palette can help to improve the readability and clarity of a report chart. This is particularly true for those reports which display a chart but do not use alternate structures as attributes, and therefore cannot apply color charting to the attribute values.
- Examples of this include WRK32 - Work Portfolio Financial Burndown Comparison, STR32 - Strategic Portfolio Financial Performance, and OUT32 - Outcome Portfolio Revenue / Cost Performance which compare multiple versions of the financial plan in a clustered bar / line chart. To ensure that it is easy to distinguish between the bar / lines representing each financial plan version, it is recommended that a custom color palette (with a variety of distinct colors) is applied to the reports.
- Note, custom color charts cannot be used in any bubble charts (e.g. WRK01- Project Pipeline Matrix) - bubble charts will only respect the color charting of the alternate structures being displayed.
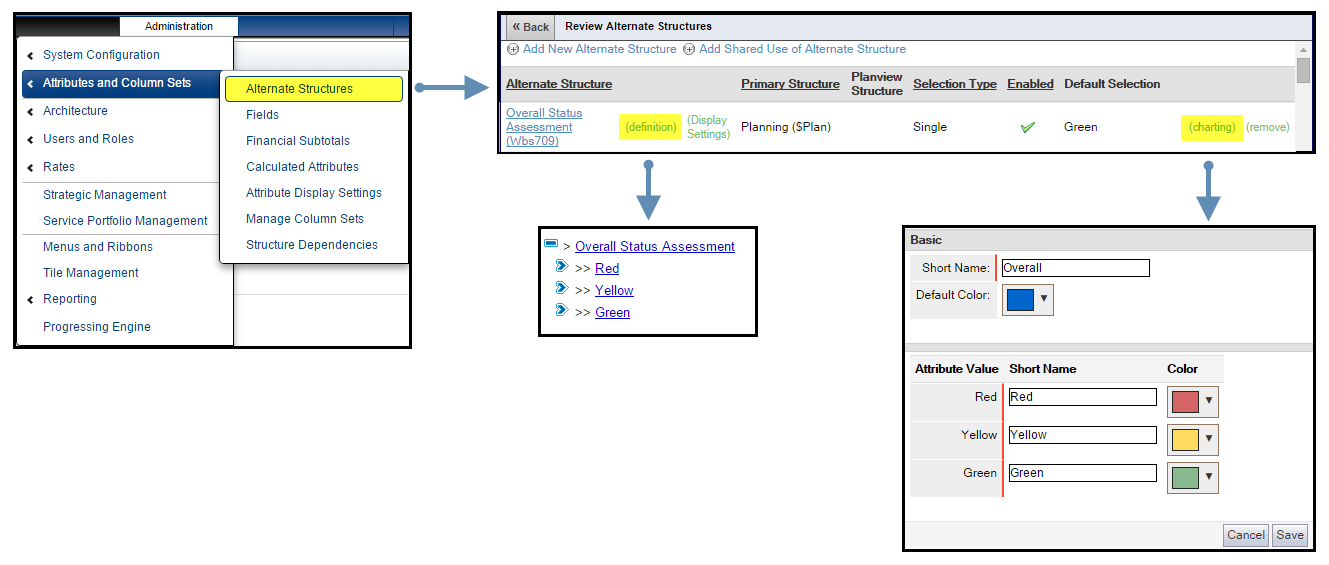
Applying Specific Attribute Colors - Alternate Structures
For alternate structures the default palette can be overwritten by using the attribute charting color configuration.
The example below shows how you might use this is to force specific values to show with logical colors. In Planview Enterprise 11.5 the range of colors was extended to include the corporate color palette and also to allow the entry of a specific HEX code value.
| Attribute: Overall Status Assessment | Charting Colors Assigned to Attribute Values | Charting Colors Appear in Report Output |
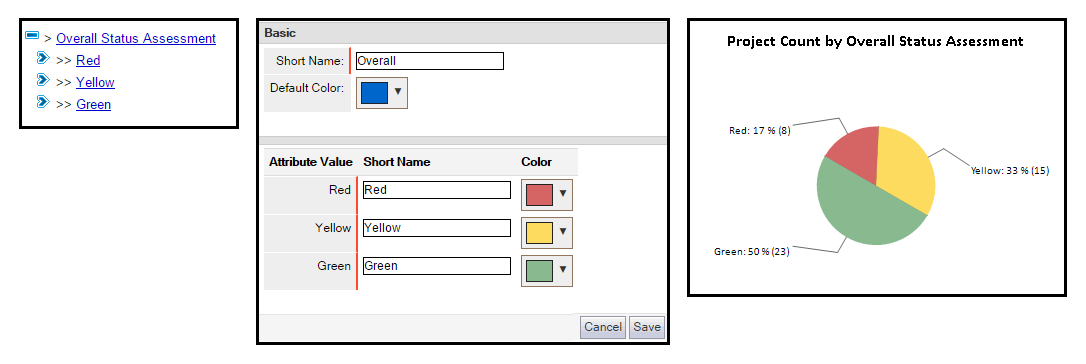 |
Assigning Charting Colors to an Attribute
| Administration > Attributes and Column Sets > Alternate Structures | Select 'Charting' against the structure you wish to assign colors | Select Charting Colors |
 |
Applying Specific Attribute Colors - Alternate Structures Used as Table Columns
Alternate structures displayed in table columns can be configured to display with the column background and/or text using the color defined in the Display Settings. This is done by modifying the table column configuration entry;
- |fc (font color)
- |bgc (background color)
These options are applicable to report such as WRK14 - Project Highlight Report (header section that lists attributes as table columns), WRK12 - Portfolio Project Health Report, and other reports where the detail table includes configurable table columns, excluding the following reports: FM31, FM32, FM33, and FM34.
For additional information refer to the Managing and Formatting Attributes topic.
Controlling Other Colors Used in Reports
The FastTrack Analytics utilize colors to visualize data types and conditions, Examples include: effort types (actual, allocation, reserve, requirement), and timesheet statuses (approved, overdue, disapproved, etc.).
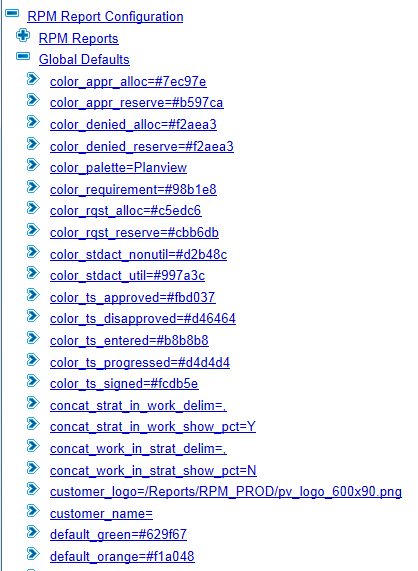
Configuration entries in the Global Defaults area of the FastTrack Configuration structure are used to control these colors. Default values are added through the installation process. For further detail on the different color controls options refer to the Global Defaults topic.
Global Defaults
The following global configuration settings are maintained in the Global Defaults branch of the FastTrack Report Config structure. They control the behavior and formatting of all reports. Each report has Global Default Overrides section where different report specific formatting can be defined, using the same conventions.
See the Look and Feel Configuration topic for the Global Options associated with the look, feel, and formatting of the reports.
Change, Risk, and Issue Global Options
| Change Requests Used? | Controls the display of the Change Requests table in various reports (WRK14, etc). | use_changes=Y |
| Risks Used? | Controls the display of the Risks section in various reports (WRK14, etc). | use_risks=Y |
| Issues Used? | Controls the display of the Issues table in various reports (WRK14, etc). | use_issues=Y |
Portfolio Auto Refresh
| Portfolio Auto Refresh Setting (Report Subscriptions) . |
Functionality that ensures that any reports that are executed through a report subscription do not use a "stale" portfolio. The contents of a portfolio are "refreshed" and cached in the database when the user navigates to, and opens, the portfolio. When a report is executed through a report subscription the portfolio is not refreshed. All RPM Analytics in v2.2 onwards will automatically execute the stored procedure that forces a portfolio refresh, ensuring that the portfolio is not stale. There is a new configuration option in the Global Defaults called “portfolio_auto_refresh_sec=”. This sets the threshold in seconds where a portfolio will be refreshed – the default installed value is 1 hour (portfolio_auto_refresh_sec=3600). If the portfolio has been refreshed within the last hour nothing else happens. If, however, the portfolio hasn’t been refreshed within that time it will first force a refresh of the portfolio (which could increase the time it takes to load the parameters – by how much will depend on the size of the customer’s DB). If the parameter is configured with a value of zero this check will be bypassed completely and the portfolio refresh will be left as it is today (only done by the application). The minimum value is 10 seconds; any non-zero value less than 10 will be treated as 10 by the procedure. Stale portfolios can also impact report execution through a Report Tile or Dashboard, if the user opens a portfolio, makes data updates that impact portfolio membership and then executes a report through a Report Tile. This option can be used to safeguard against this scenario, by entering a setting of, say, portfolio_auto_refresh_sec=300 (5 minutes). This does not apply to the execution of a single entity report, and only when ran against a portfolio of entities. |
portfolio_auto_refresh_sec=3600 |
| Portfolio Auto Refresh Setting (Daily Tables) |
A condition was occurring where scheduled effort changes were not always immediately reflected in a report. This was due to the fact that some daily table changes are updated in batch. RPM Analytics includes code in the core framework which automatically refreshes the daily scheduled effort when a report is run based on this parameter. |
For this to work, you must have the auto refresh option set to a value greater than 9. |
Query Logging
An administrator can configure how long to keep captured queries from the reports and framework.
This global default parameter option is configured using:
- query_capture_expiration=x
Where x is measured in days, meaning queries created x or more days ago will be deleted from when time ADM01 is run.
It’s important to note that the Refresh Metadata parameter does not have to be set to Yes when executing ADM01; this query logging deletion housekeeping will occur whenever ADM01 is executed
 Configuration Case Studies
A key feature and value of the FastTrack Analytics is the ability for Planview Portfolios Administrators to configure the reports, modifying the data points displayed on the report and controlling the behavior of the report including default parameters.
Here you can view case study examples of FastTrack Analytic report configurations and personas which illustrate the power and flexibility delivered through the configurability of the FastTrack analytics and provides ideas for new and creative ways of harnessing their value.
Configuration Case Study Examples
In this section you can view case study examples of FastTrack Analytic report configuration which illustrate the power and flexibility delivered through the configurability of the FastTrack analytics and provides ideas for new and creative ways of harnessing their value.
| Configuration Area | Preview | Core Report | Type |
|---|---|---|---|
| Expose Key Project Milestone Dates on Summary Reports Expose Project Kickoff and Go-Live project milestone dates in WRK14 Project Highlight Report Display Milestone Dates in the Key Summary Information Section, in a separate section under the heading Project Milestone Dates |
|
WRK13 WRK14 WRK16 STR16 |
Report Config |
| Display Lifecycle Stage Initiation Data and Duration Expose the first date that each lifecycle stage was initiated and the duration in days that it spent in that stage in WRK12 Project Health Report for each project in a portfolio. |
Add caption here |
WRK12 | Report Config |
Persona Case Study Examples
Completely new reports can be created through a configuration process called Report Personas. In this section you can view case study examples of FastTrack Analytic report personas which illustrate the power and flexibility delivered through the configurability of the FastTrack analytics and provides ideas for new and creative ways of harnessing their value.
| Persona and Topic Area | Preview | Core Report | Type |
|---|---|---|---|
| Portfolio Manager > Investment Dependencies A bubble chart showing investment dependencies between entities in a portfolio used to highlight areas of impact |
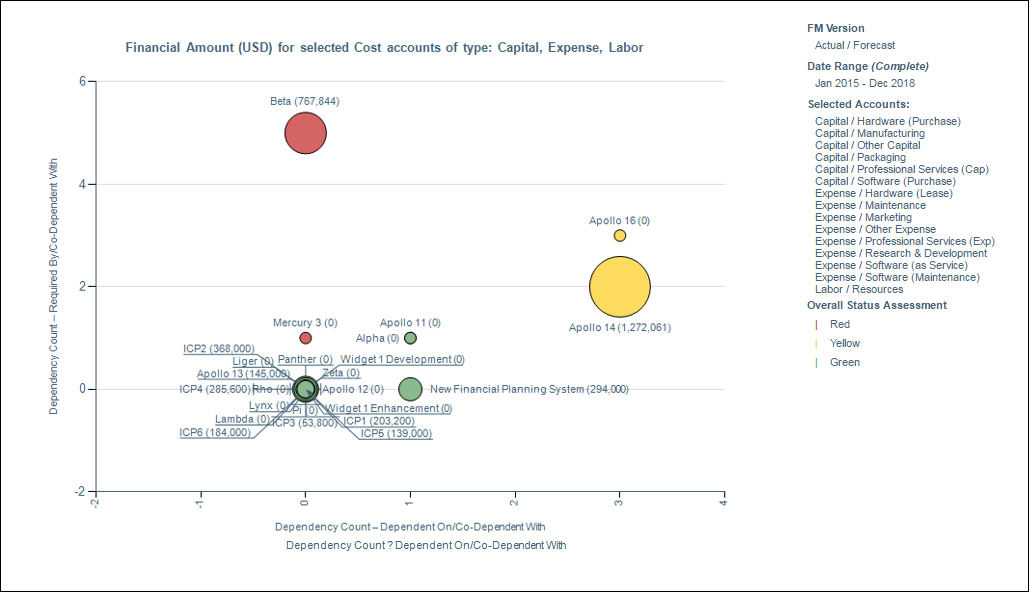
|
WRK33 STR33 OUT33 |
Report Persona |
| Resource Manager > What Projects are My Team are Working On A report showing resource assignments by project to provides a view of projects that have specific Resources assigned to them. |
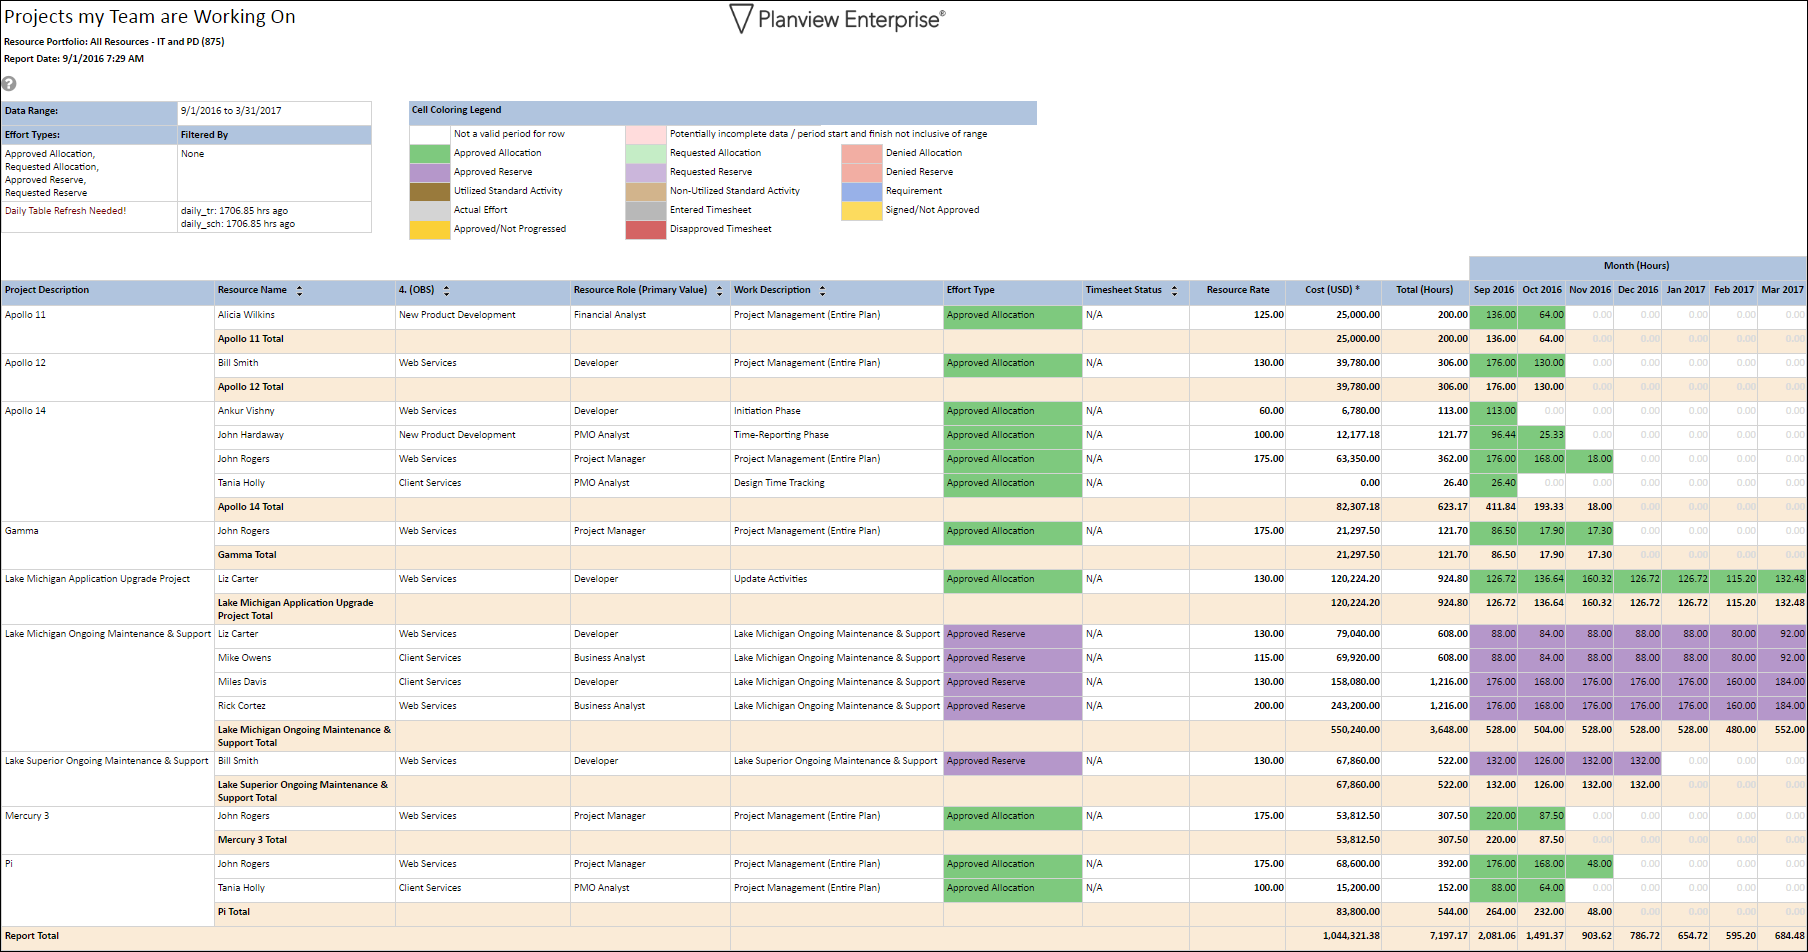 |
RES24 | Report Persona |
| Team Members > Timesheet Print Out for Contractors A report showing an extract of resource timesheets with audit information on approval. Ideal for use by contract resources to support invoices for payment. |
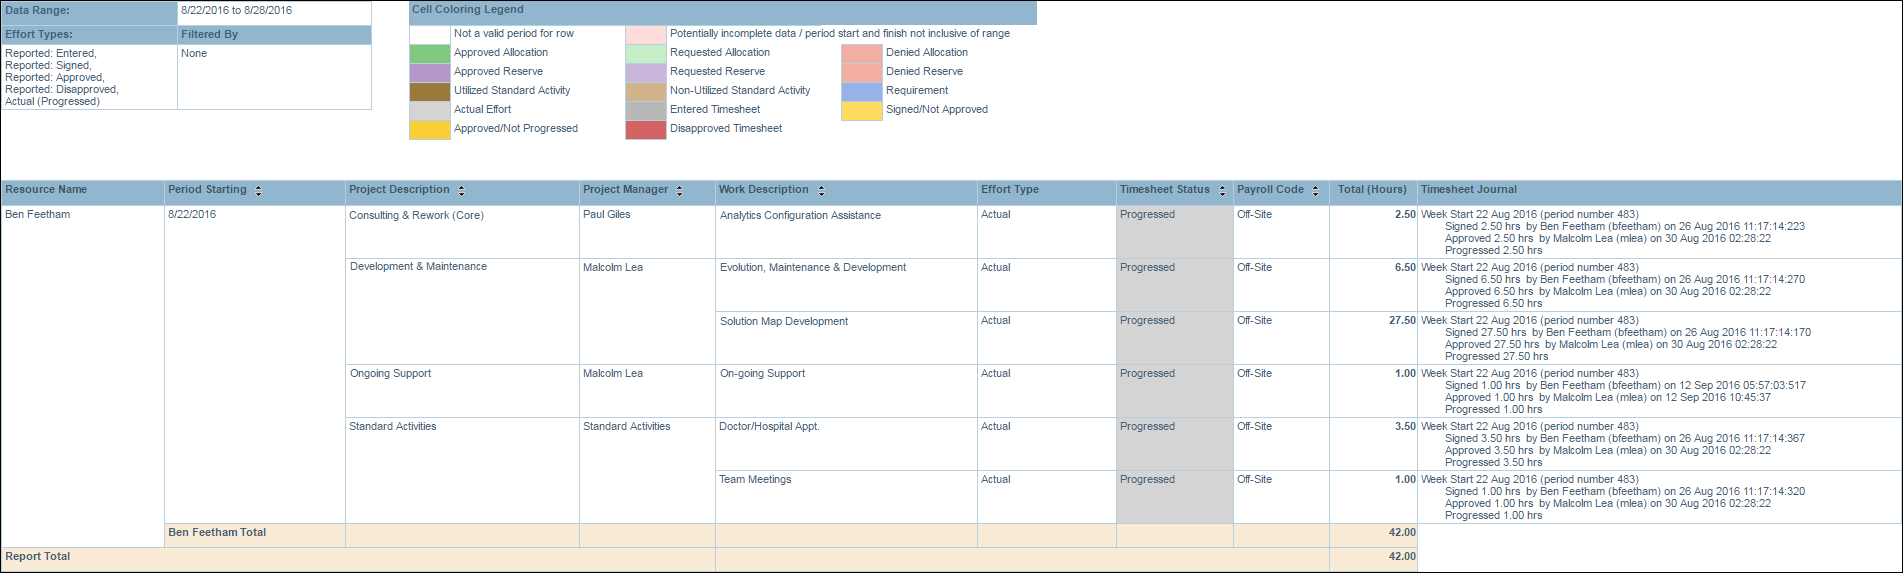 |
MY26 RES26 |
Report Persona |
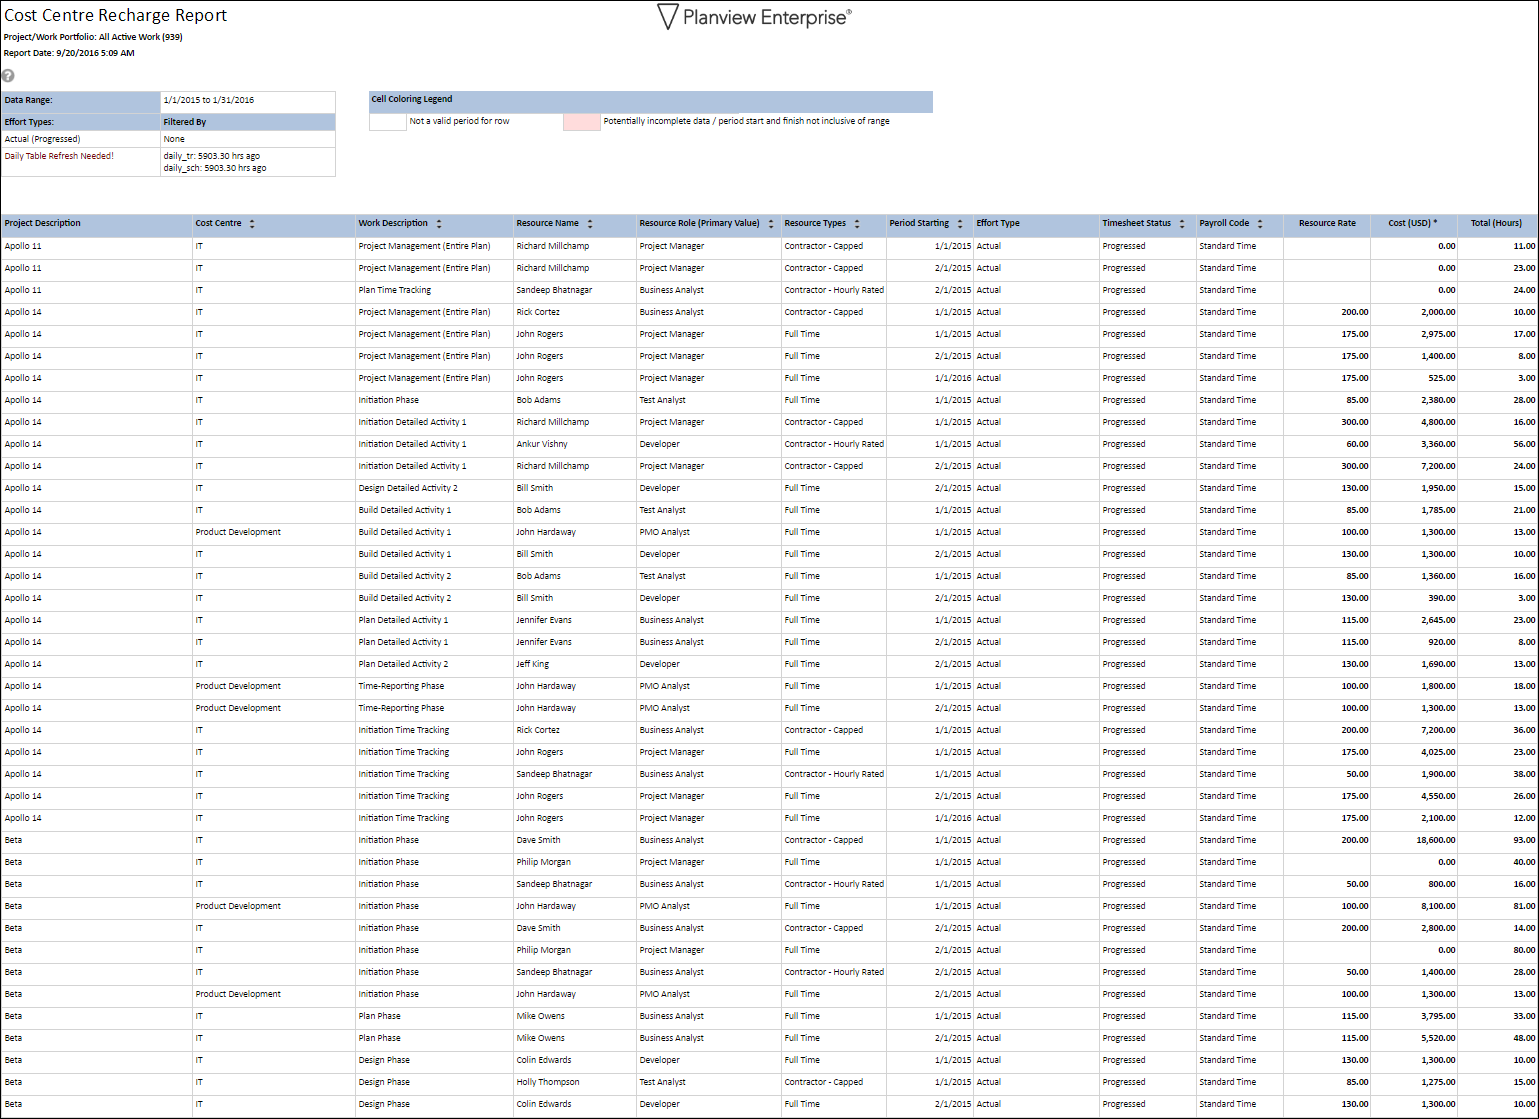
| Finance > Cost Centre Recharge Export This report is designed to be used as a Cost Center Recharge Report to extract costed effort information based on the organizational recharge rates rate set and the hours worked by resources. |
 |
WRK26 RES26 |
Report Persona |
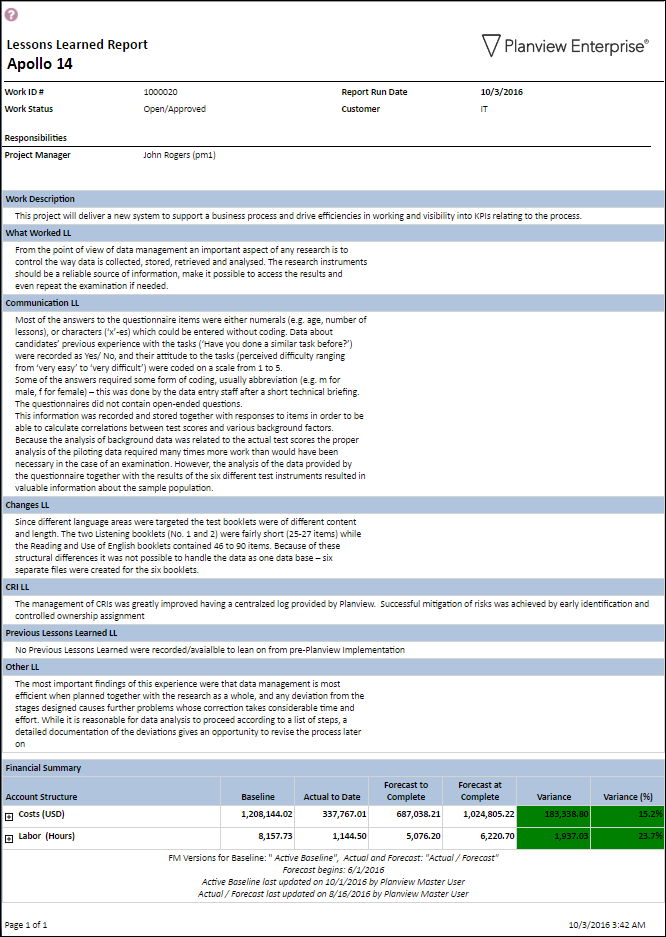
| Project Manager > Lessons Learned Report Report that provides an extract of Lessons Learned to provide future projects with a list of important lessons to share experiences of delivering projects. |
|
 Report Personas
The FastTrack Analytics configuration framework allows variant or “persona” reports to be created. A persona is a report that uses an existing report definition (RDL) but applies a different configuration to the report through the use of a Report ID (report_id) override. This allows the inclusion of different data points, different visualization settings and different default parameters to support the variety of reporting needs throughout the organization.
This section provides everything you need to know about Creating Report Personas.
Creating Report Personas
Introduction
The FastTrack Analytics configuration framework allows new variant or “persona” reports to be created. A persona is a new report that uses an existing report definition (RDL) but applies a different configuration to the report through the use of a Report ID (report_id) override. The overriding of the Report ID means that the report looks up to a different entry in the report Configuration structure in order to determine the configuration to be applied to the report. This allows the inclusion of different data points, different visualization settings and different default parameters.
Typical Use Cases for Persona Reports
- The WRK14 Project Highlight Report can be used to create persona status reports for different business units, each report containing different data
- The WRK14 Project Highlight Report can be used to create Stage Gate showing different, gate specific data, in each persona
- The WRK31 Work Portfolio FInancial Analysis Report can be configured with different parameter defaults, one to analyze costs and another to analyze benefits
- Financial management based reports can use personas to report on data from specific financial management models (rather than reporting from the default financial management model
- The WRK54 Work Portfolio Dashboard report can have personas that show different measures for different attributes
See Configuration Case Studies for more examples, including configuration advice, of the power and flexibility of harnessing report personas.
Persona Report Tiles
The following elements are utilized in the execution of an FastTrack report:
The below diagram shows the relationships between the various elements required to successfully create and run a report persona.
|
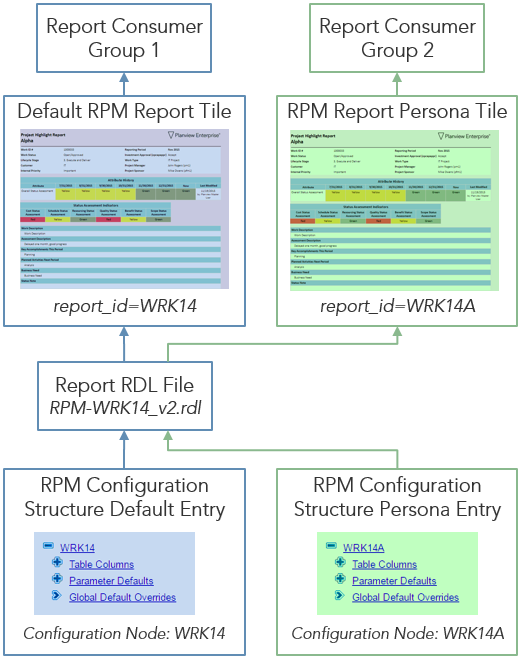
Creating a Report Persona Tile
The following five step process provides details on the creation and configuration of FastTrack report personas in Planview Enterprise.

The example information and screenshots below detail the creation of a WRK14 - Project Highlight report persona.
Step 1: Create Configuration Structure Entry for Persona
The first step is to create the configuration entry in the FastTrack Report Configuration Alternate Structure that the new report persona will reference.
This is most easily achieved by using the copy-paste function with in the structure on an existing entry and renaming the new entry. For this example we will copy and paste WRK14 and rename the new entry to be WRK14A.
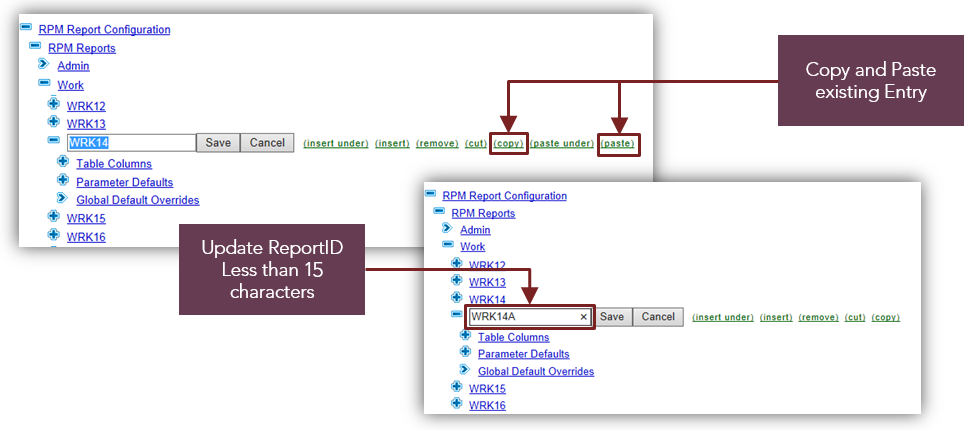
Creating WRK14a
NOTE
The Report ID (node name) must be less than 15 characters in length and must not contain spaces or special characters (such as &).
Step 2: Create New Report Tile for Persona and Set Report ID
Reports in Planview Portfolios are accessed using a Report Tile.
To create a new Persona Report Tile:
- Navigate to Administration > Tile Management > +New > Report
- Select the appropriate RDL file for the report you want to create a persona for
- Fill in the New Report Detail information
- Use the Custom Info attribute to override the Report ID as follows:
- report_id=Configuration Node Name
- Example: report_id=WRK14A
Overriding the Report ID (report_id) parameter of the RDL changes the configuration structure entry that the report tile is executed against, making the newly created report tile, execute against the newly created configuration node from step 1.
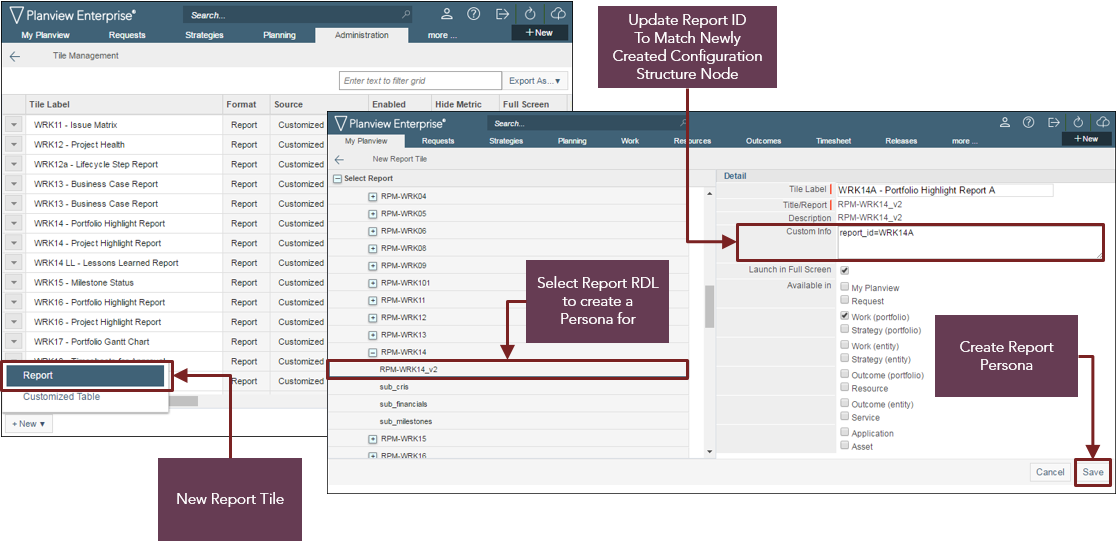
Creating a persona
The data entered into the Custom Info property is case sensitive. The ReportID parameter must be entered with a lower case syntax and the syntax of the Report ID (report_id) value must match the case of the Report ID entry in the FastTrack Report Configuration Structure. For example; to create a report tile that uses the WRK14RDL and applies the configuration defined in the WRK14A entry in the Report Configuration Structure enter the following text into the Custom Info property of the Report Tile.
WARNING
Exact match of text case required - report_id MUST be lower case
Step 3: Update Configuration Entry
You now have a new persona report tile executing against a separate, unique node in the report configuration structure.
The next step is to update the configuration structure with the appropriate changes, this will deviate the output of the new report tile from the default FastTrack report, thus creating a persona variation report, to meet the requirements of a separate group of report consumers.
See Configuration Principles to understand the basics of report configuration
For full details on the configuration options available for each of the FastTrack Analytics, please see the FastTrack Analytics Catalog administration guides.
Step 4: Set Tile Feature Controls (Optional)
It is possible to restrict the audience of the newly created persona tile using the Set Feature control functionality.
To limit the persona tile to a subset of users, you can set one feature that a user must have enabled on their role to access that tile.
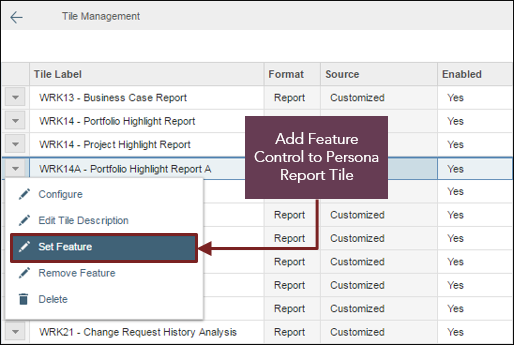
Using features to control who sees a tile
Step 5: Adding a New Persona Tile to a Ribbon (Optoinal)
The Ffinal Step is to share the report with the appropriate users:
- Ensure the new tile is enabled and available for use
- Add the Tile to the default ribbons for the appropriate entity types/roles
- Communicate to users that the tile is available for adding to their ribbons if required
The newly configured report persona tile can now be executed by the appropriate users.
TIP
Any Tile Report running as a persona with a Report ID override will show different colored Help (?) icon and the Report ID override value in the mouse over.
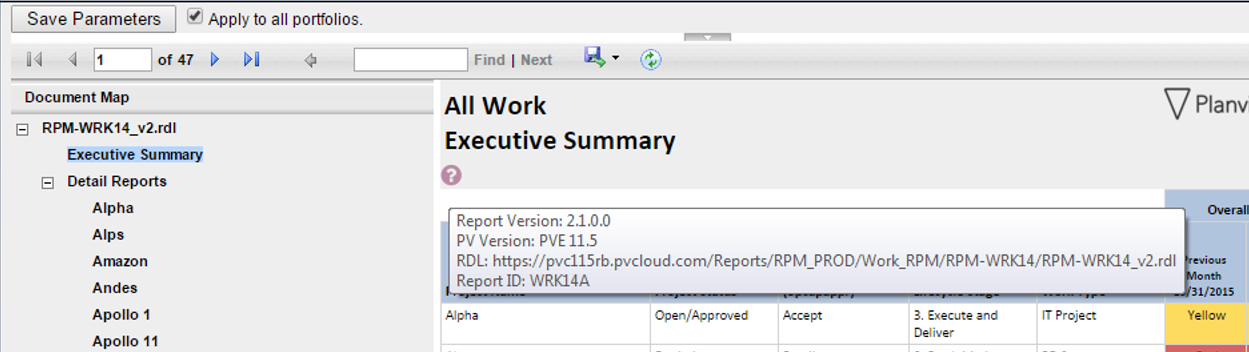
Mouseover example