
WRK41 - Project Process Analysis - Lifecycle Stage

Overview
Work portfolio report that can select cost or revenue/benefit based measures from the financial planning data to drive bubble size.
Process control analytic that can be used to measure and monitor governance processes and to drive improvements in process cycle times. This work portfolio report analyzes the project Lifecycle Stage attribute, providing insight into:
- Number of projects at each stage in the governance lifecycle
- Measurement of overall (end-to-end) process cycle times, the time taken to pass between governance gates
- Allow analysis of process cycle times by work attributes, such as work type, customer, work priority, etc
- Comparison to process cycle time targets and identification of items that are exceeding target cycle times
Through the monitoring of a process, bottlenecks and process inefficiencies can be identified and this information used to target and deliver improvements in process.
WRK41 example
Report Details
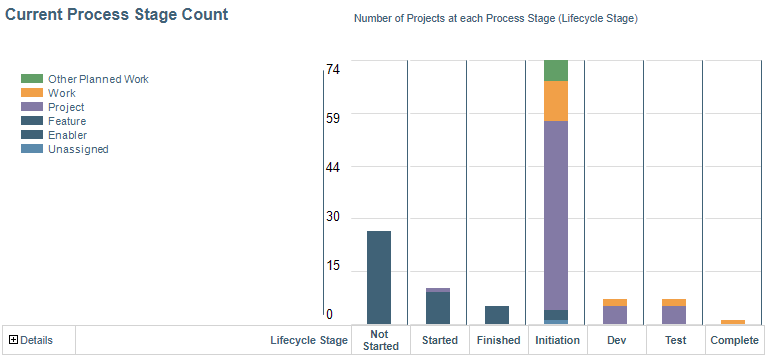
Current Process Stage Count
This chart visualizes the distribution of projects by the stage they are currently in, and provides a detailed listing, which can be configured to show key attributes, such as the project manager name.
User parameters allow analysis by any work classification attribute, such as work type, work priority, or customer, visualized as the stacked bars.
Current Process Stage Count
Total Process Stage Executions
This chart summarizes the total number of process stages/gates completed for a user specified time period, for example, the last month, the last quarter, the last year.
User parameters allow analysis by any work classification attribute, such as work type, work priority, or customer, visualized as the stacked bars.
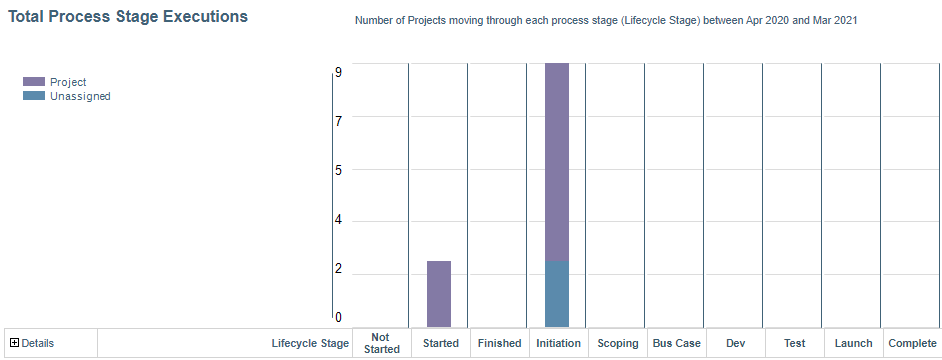
Total Process Stage Executions
Process Stage Throughput
This chart summarizes the total number of process stages/gates completed each month, across a user-specified time period.
The stacked bars indicate the count for each stage/gate in the process that have been completed each month.
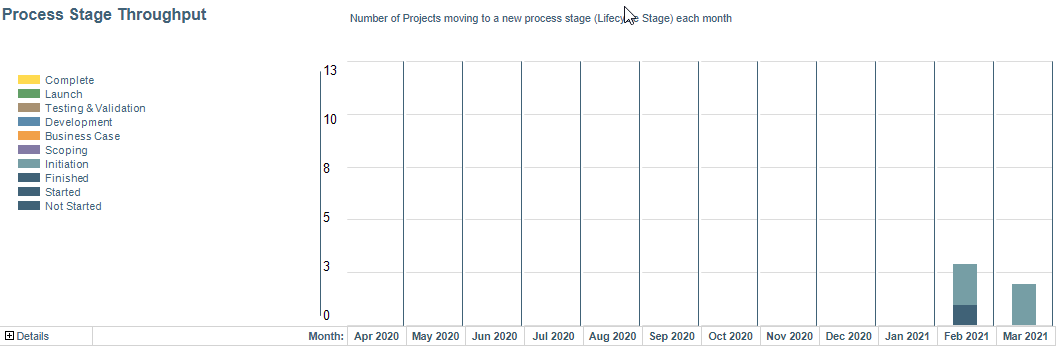
Process Stage Throughput
Process Stage Average Cycle Time
This chart provides an average cycle time (duration) for each stage in the process, based on the stages/gates completed across a user specified time period. Duration is based on the number of working days between each gate (based on the STANDARD calendar).
User parameters allow analysis by any work classification attribute, such as work type, work priority, or customer, visualized as the stacked bars.
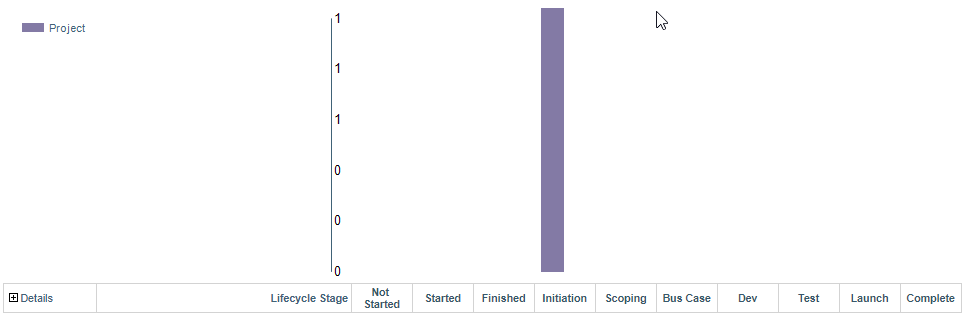
Process Stage Average Cycle Time