
WRK29 - Resource Utilization

Overview
This report provides insight into the utilization of resources assigned to work on a single project or portfolio of projects. It shows the capacity of the assigned resources, the utilization of these resources on work in the portfolio/project and (optionally) displays out-of-portfolio demand. Out-of-portfolio demand is assignments to work and standard activities that are not included in the selected work portfolio/project. The demand is based on requirements, reserves, and allocations in the project schedules. Data can be pivoted by different resource dimensions, time sliced in weeks or months, and displayed in hours, days or FTEs.
WRK29 example
Report Business Rules
- The data displayed by this report is determined by:
- Based on the work portfolio/project selected and time range parameters, determine all actual and scheduled (requirement, reserve and allocation) effort
- For the scheduled effort only, determine the resources/organizational resources working on the project
- Identify all other work scheduled (requirement, reserve, allocation, and standard activity) effort for these resources and organizational resources, this being the out-of-portfolio demand.
- To include and visualize capacity and utilization in the WRK29 report, you must set the Include Out of Portfolio Demand parameter to Yes. If you want to monitor utilization, Planview recommends you use the RES03 report instead.
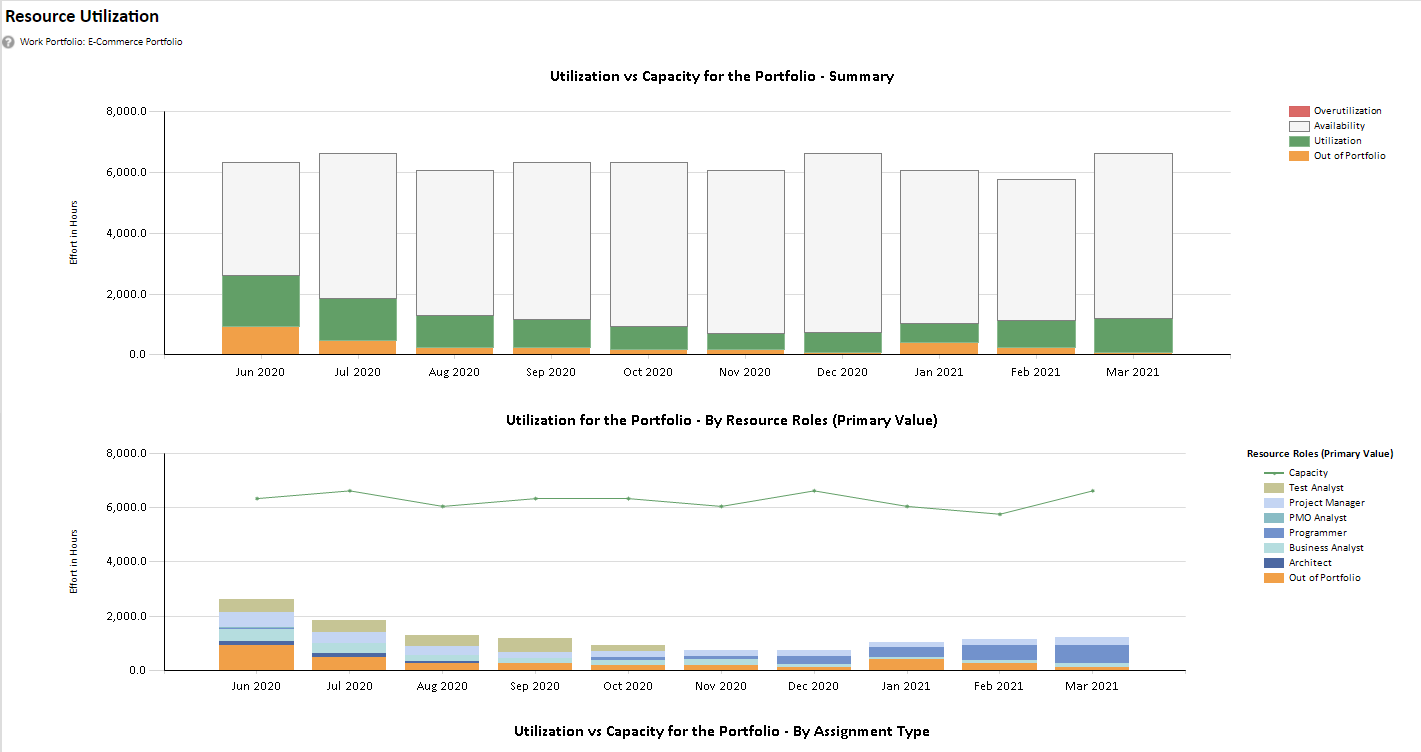
Chart 1
- Chart 1 - Utilization vs Capacity for the Portfolio - Summary:
- This chart provides a summary for the whole portfolio, showing out-of-portfolio demand (demand against projects/standard activities not in the selected work portfolio/project) and in-portfolio demand (utilization) compared to the capacity of all resources assigned to the work in the portfolio
- When the total demand (utilization) across out-of-portfolio and in-portfolio projects exceeds the capacity of the resources then overutilization is identified (red)
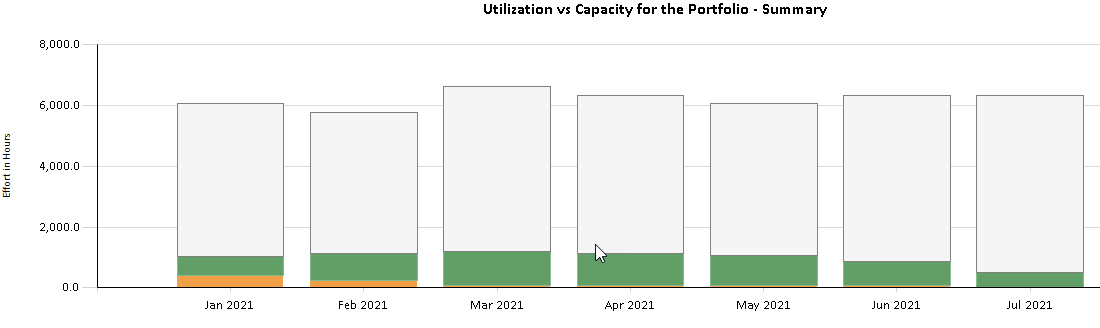
Chart 1
Chart 2
- Chart 2 - Utilization for the Portfolio - By <Selected Slicer>:
- This chart provides a portfolio level summary of demand (utilization) vs. capacity and uses the Slice By parameter to provide an analysis of the in-portfolio demand
- A capacity line is displayed, showing the capacity of all resources associated with the work in the selected portfolio/project
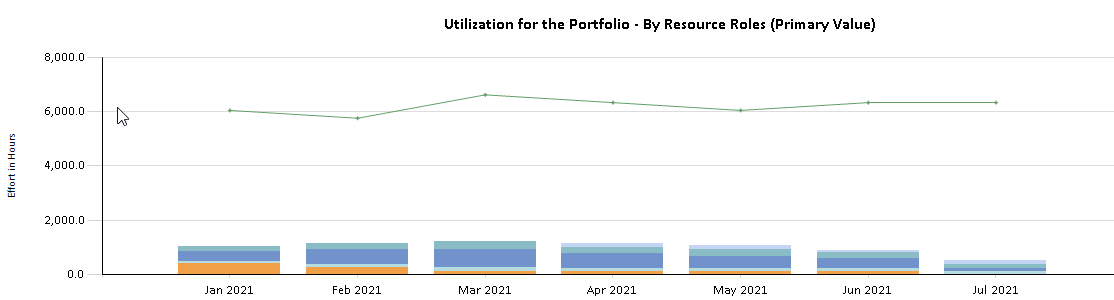
Chart 2
Chart 3
- Chart 3 - Utilization vs Capacity for the Portfolio - By Assignment Type:
- This chart provides an analysis of the in-portfolio demand by the Planview Portfolios assignment type; Requirement, Reserve, Allocation
- A capacity line is displayed, showing the capacity of all resources associated with the work in the selected portfolio/project
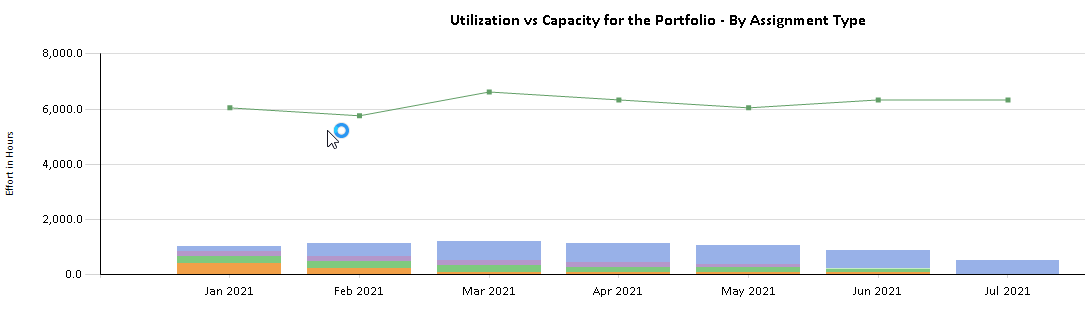
Chart 3
Chart 4
- Chart 4 - Utilization vs Capacity for <Selected Slicer>
- This section of the report provides one chart per value of the selected slicer
- Each chart shows the demand for each slicer value
- The charts only show a capacity line when the selected slicer is a resource attribute. It is not possible to slice capacity by a demand (work) only attribute
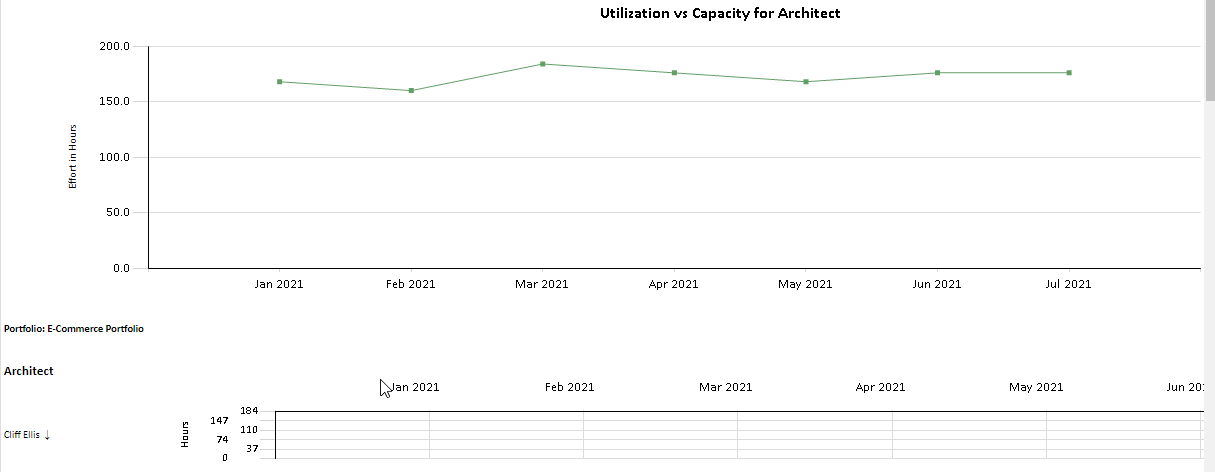
Chart 4
Report Parameters
| Parameters | Description |
|---|---|
| Slice By | A resource or work attribute can be selected as the attribute to analyze the demand (and where applicable) the capacity. |
| Approval States | Status of assignments that will be included in the demand. Options are:
|
| Effort Unit | Unit of measure used for effort. Options are:
|
| Breakdown Effort By | Breakdown by Week, Month, or Quarter time slices in chart or table. |
| Range Start/End | Date range that is used to determine demand and capacity returned. |
| Include Demand against "Unassigned" Org Res? | Determines whether unassigned demand is included in the report. Options are:
|
| Show | Controls which charts and tables are displayed in the report. 6 Options are available for selection:
|
| Include Out of Portfolio Demand | This option determines whether or not resource assignments to work and standard activities that are outside the selected work portfolio/project and considered as demand and plotted as out-of-portfolio utilization. Options are:
|
| Detail Table Format | This parameter determines the format of the detailed data table in the report. Users can select a formatted layout, with grouping either expanded or collapsed, or a plan, flat-table, format that is designed for use when exporting the report to Excel for further data analysis. Options are:
|