
WRK17 - Portfolio Gantt Chart
- Last updated
- Save as PDF
Overview
This work portfolio report provides a Gantt chart time visualization of the projects in a portfolio. User parameters allow control of the level of detail shown, which can include milestones, with the option to filter by milestone type, and project phases. Baseline dates can be visualized, together with the percentage completion.
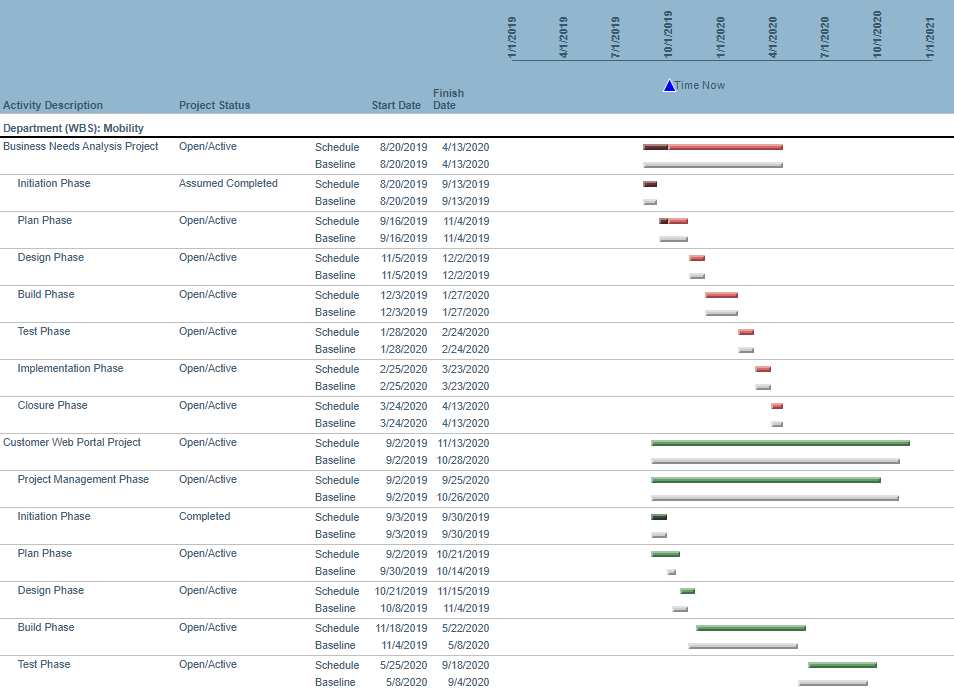
WRK17 example
Business Outcomes
- Visualization of project and portfolio timelines and key milestones.
- Identification of projects that are showing a slippage from their baseline.
- Ability to focus on key governance milestones and highlight ones that are reporting an adverse variance.
- Determination of periods of excessive change load on the organization.
Supporting Capabilities
- Project Planning and Scheduling
- Project Monitoring and Status
Report Performance
Due to technical constraints associated with the Microsoft Reporting Services platform that impact graphic rich reports, this report executes slowly and can time out if executed against a large dataset (portfolio and/or time range). Therefore it is recommended that this report is used against a "smaller" portfolio and the parameters are used to restrict the level of detail displayed when using "larger" portfolios.
Report Information
The report will sort milestones within each group on “structure order” (the order they appear in the WBS). This means that the work entities should show up in the same order that they do in the schedule. This is not configurable.
User Parameter Configuration (for Administrators)
| Parameters | Description | Configuration Options | Default/Example Settings |
| Highest work Level | Determine the highest level that should be displayed in the Gantt. |
Can be selected at any level >= Primary Planning Level (PPL) defined in Global Options. To identify the WBS level values then refer to the Work Primary Structure definition screen ( Administration > Architecture > Primary Structures > Work Structure (define levels). |
min_wbs_level=5 Defaults to PPL (recommended) |
| Lowest work Level | Determine the lowest level that should be displayed in the Gantt. If milestones are selected to appear, they will always appear and are not impacted by this parameter. |
Can be selected at any level >= Primary Planning Level (PPL) defined in Global Options. To identify the WBS level values then refer to the Work Primary Structure definition screen ( Administration > Architecture > Primary Structures > Work Structure (define levels). max_wbs_level=y where y = level in WBS (must be PPL or below) leave as blank to default to PPL+1 |
max_wbs_level=6 Defaults to PPL+1 |
| Baseline | Determine the baseline that should be displayed. | A default can be set using:
Replace X with relevant baseline numbers for any master baseline (created as part of a lifecycle step). |
bl_master_id=0 |
| Gantt Start | Start of the display. | horizon_start=x Where x = number of timeframes (see horizon_type) from today to start the gantt. A value of zero (0) with a horizon_type of “year” would represent the beginning of the current calendar year. A value of -1 with the horizon_type of “month” would represent a start date of the first of last month. Default value is zero (this year) |
horizon_start=0 (beginning of current horizon type) |
| Gantt Finish | Finish date of the display. | horizon_finish=x Where x = number of timeframes (see horizon_type) from today to end the Gantt. This follows the same construct as horizon_start. Default value is zero (this year). |
horizon_finish=0 (end of current horizon type) |
| Show Work Outside the Range? ☑ Added in v2.2.0.0 |
This attribute determines whether work where the schedule/actual dates of the work items fall outside of the Gantt range are included as rows on the report. | show_outside_work=Y|N
|
show_outside_work=Y |
| Attribute for Gantt color | Attribute used to determine the color in the Gantt Chart. | Any attribute with the colors defined can be selected. | bar_color_attribute=wbs709_plan |
| Filter milestones By | Determine which milestones should be displayed. | Options are:
Defaults are configured using:
|
ms_attrib_id=NONE |
| Milestone Filter Values | Determine which values of the selected alternate structure should be considered. |
This a multi select parameter, therefore create one or multiple entries using the SeqID of the required values of the filter attribute:
|
Example to filter on Open/Active and Requested milestones, create two entries: ms_filter=WBS20$OPEN |
| Milestone Shapes | Shape for the milestones. | Values are:
|
ms_shape=Fixed|diamond |
Hidden Parameter Configuration (for Administrators)
| Parameters | Description | Configuration Options | Default/Example Settings |
| Table Columns | 2 columns can be displayed. | It is highly recommended to put the work_description as the first column. | work_description wbs20_plan |
| Group Column | Determine by which attribute the Gantt should be organized. | Group_column=wbs_level_4_plan | |
| Horizon Type ☑ Added in RPM Analytics v2.2.0.0 |
This indicates the timeframe that is used to set the default range for the Gantt. | Used in conjunction with the Gantt start and Gantt Finish parameters, the Gantt start and finish dates are calculated. year|month|week| fiscal_month|fiscal_quarter|fiscal_year |
Horizon_type= (Defaults to Year) |
| Report Title | Configurable report title that appears at the top of the report. | report_title=Portfolio Gantt Report | |
| Baseline Bar Color | Colors for the baseline bar. | Baseline_bar_color=#cccccc | |
| Bar Style | Style of the Gantt bar. Possible values are: Emboss, Cylinder, LightToDark, Wedge | Bar_style=Emboss | |
| Report Title | Configurable report title that appears at the top of the report. | If a longer report title is required, create additional report_title=xxx entries. These will be concatenated together based on the order in which they are listed in the configuration structure. | report_title=Portfolio Gantt Chart |
Technical/Database Information
| Report (RDL) Location | …/Reports/FastTrack/Work/WRK17-PortfolioGantt/WRK17.rdl |
| Ribbon | This report tile can be used on the:
|
| Database | This report uses the transactional database and updates will be real-time. |