
WRK16 - Project (and Portfolio) Status Report
- Last updated
- Save as PDF
Overview
Summary of key information on the project into a “one page” report for project stakeholders and project review meetings. Includes project attributes and responsibility information, trend of project condition/RAG/RYG status, descriptive information, date and milestone information, financial summary, commentary and change request, risk and issue lists.
Report can be run for a single project, or across a portfolio of projects. Portfolio report includes an Executive Summary table on page 1 and each project in the portfolio on a new page.
Executive Summary
The first page of the report is a summary table, listing each project in the portfolio, with key information listed in configurable columns. The sort order and grouping of the projects in this table is configurable.
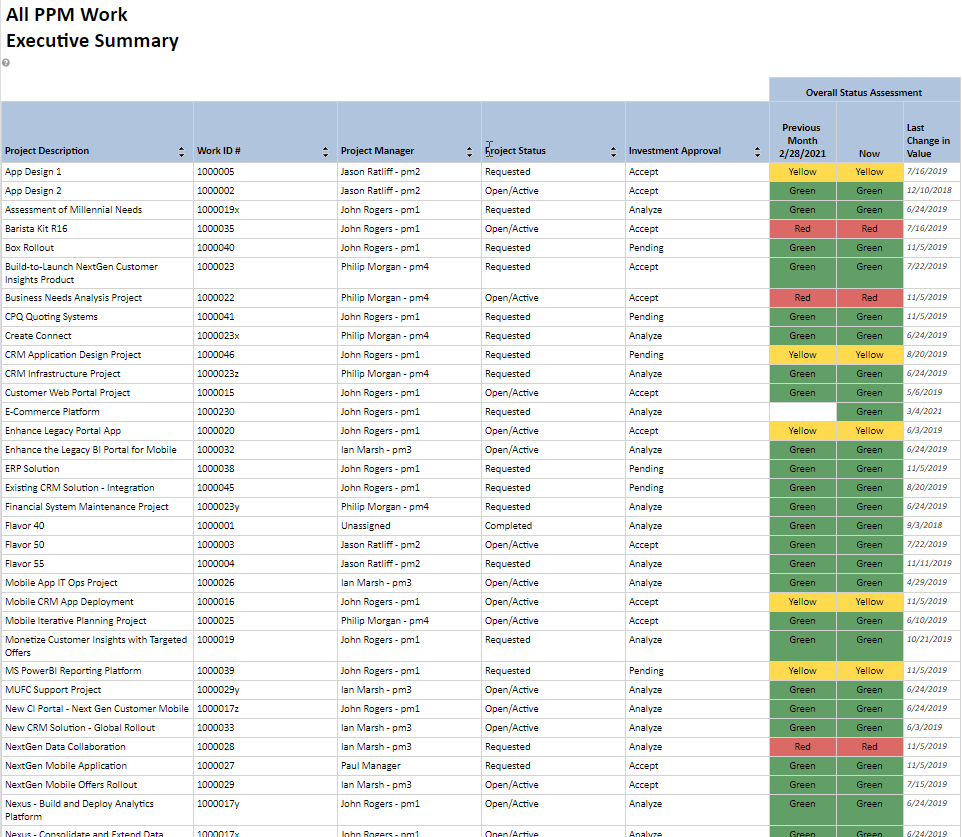
WRK16 Executive Summary
One-Page-per-Project Detail
From page 2 onwards there is a detailed page, one per project in the portfolio.
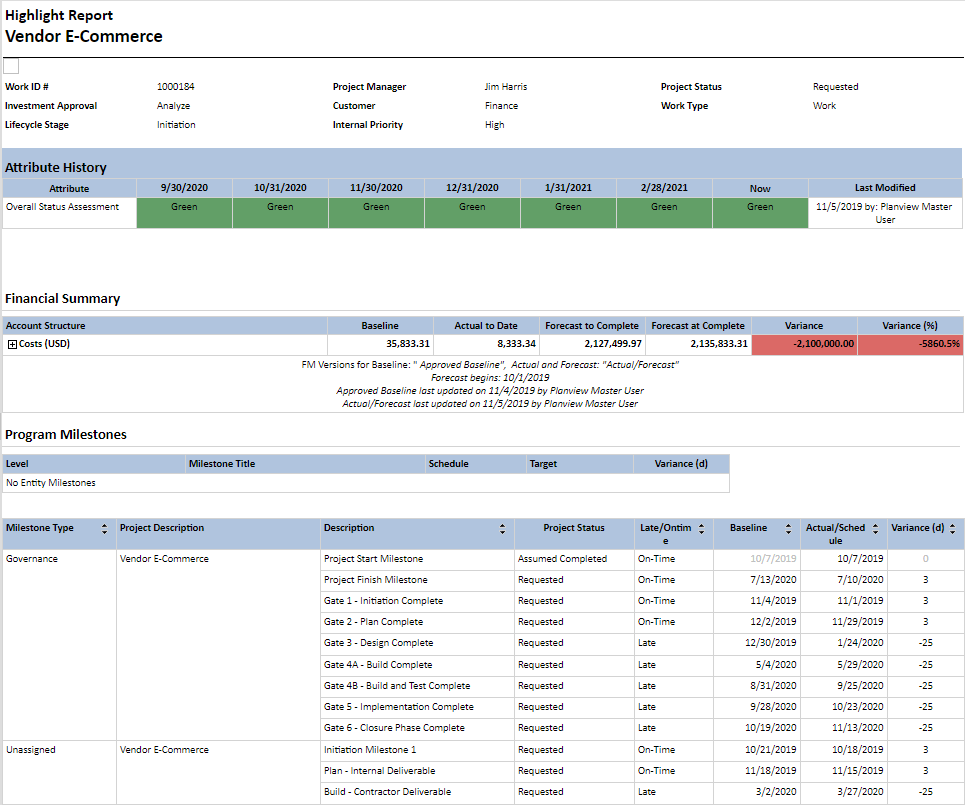
WRK16 Highlight Report
Business Outcomes
- Drive the discipline that Planview Portfolios will provide the single source of truth relating to project status.
- Provide visibility of project status to project stakeholders
- Rapidly and efficiently collate project status information, across the portfolio, allowing the production of steering committee/project board status report packs.
Supporting Capabilities
- Work Planning and Scheduling
- Project Monitoring and Status
- Financial Management
Report Detail
Key Summary Information
Section designed to highlights Key Project Information that can be configured to show any important project data points. Section breaks with headings and dividing lines can be added to separate groups of project attributes.
Attribute History Section
Provides the ability to plot time trended changes in project attributes such as RAG assessment indicators. Up to four can be configured to show in the report at any time. Charting colors provide visual representation of values, which is especially useful for highlighting the history of status assessment values.
Long Text Narrative
Narrative can be configured to show customer-specific long text fields or project level notes from Work and Assignments. Display up to 30 entries in the order they appear in the configuration structure.
Financial Summary Table
Financial Summary Table shows financial effort data from the financial plan. You have the option to show or hide the financial summary and the user parameter can be used to select different versions for financial summarization and comparison in the report output. The financial summary table is expandable and collapsible along the account structure, and the report config structure can be used to set the default for this preference when opening the report. A negative variance will display in red; a positive or no variance will display in green.
Changes, Risks, and Issues Tables
All associated changes, risks, and issues for the project are shown in this section of the report. Each CRI type can be turned on or off in the config structure for customer preference, and the tables are automatically hidden for instances where the CRI types are not in use
Logo
An image can be configured through the FastTrack Report Configuration Structure to show the customer’s own logo.
Reporting Period
This can display either an attribute or a date that is used to represent the status report date/reporting period.
Status Assessment Indicators
Can be configured to show the current value of up to nine additional RAG status assessment indicators for the project.
Project Schedule Table
Shows current scheduled or actuals dates and their variance to the selected baseline. The project schedule section of the report can be turned off in its entirety or configured to return any desired level of detail from the projects Work and Assignments schedule. The configuration structure can also be used to determine the work attribute that will appear next to the work description column.
Milestones
The Milestone section shows milestones from the schedule and is dependent upon the creation of a schedule baseline to determine variances. The configuration structure provides the ability to filter milestones based on one or more alternate structure values
Report Business Rules
This report is showing data from the Planview Portfolios transactional database, therefore updates made to project data will update "real-time" into the report, however there are dependencies on various batch processes and administrative tasks;
- The financial data and effort data displayed in the Financial Summary table is sourced from the Financial Planning Detail screen of the project
- The effort values are dependent upon the planning of resource effort in the Project Schedule (in Work and Assignments), on the submission of project timesheets, on execution of the Progressing Engine and on the load of effort from the schedule/timesheets (actuals) into the Financial Plan
- The Actuals to Date and Forecast to Complete values are dependent upon the Forecast Period setting in Financial Management. This is an Administrator controlled setting that determines which financial periods are Actual and which are Forecast.
- The Actuals to Date column in the Financial Summary shows the costs and effort expended to deliver the project so far, and is the sum of all values for financial periods prior to the Forecast Period.
- The Forecast to Complete column in the Financial Summary shows the costs and effort that are planned (forecasted) to complete the execution of the project, and is the sum of all values for financial periods including and after the Forecast Period.
- The Forecast at Complete column in the Financial Summary is the sum of the Actuals to Date and the Forecast to Complete columns.
- The Baseline values in the Financial Summary table are displaying the financial data held in the selected baseline Financial Management version.
- The Variance column shows the difference between the Baseline and the Forecast at Complete.
Printing and Exporting
This report is designed with with printing in mind. It is formatted to fit to Letter/A4 landscape size with the intention of being suitable for distribution in an easily readable format.
Recommended export formats are:
- Microsoft Word
To print to hard copy, a report must be exported to PDF format and the PDF file sent to the printer.
User Parameter Configuration (for Administrators)
| Parameters | Description | Configuration Options | Default/Example Settings |
| Portfolio Size Check |
Parameter shows number of projects in Portfolio and contains report logic that prevents the report from running automatically IF the number of projects in the portfolio exceeds a threshold. | A default can be set using:
If the amount of projects does not exceed the configured threshold, the report will execute as normal. It is IMPORTANT to note that configuring a higher value does not guarantee that the report will run with that number of projects. This configuration option is strictly for customers who have been able to successfully run the report with larger numbers of entities but would like to avoid the warning. This parameter is only applicable when run against a work portfolio. |
The default FastTrack configuration portfolio size check threshold is set to:
|
| Target Currency | In a multi-currency system the currency for the financial data can be selected. | Uses standard multi-currency exchange rates for conversions between currencies for financial consolidation. | Target currency is pulled from the user record. |
| History Period Timeframe | Time interval used for the attribute history intervals | Can be week, month or quarter breakdown_unit=week|month|quarter |
breakdown_unit=month |
| History Attribute | Provides a way to show an attributes history | Any work single select work alternate structure that has been enabled in Attribute properties to be Available in Analyze Charts, has Track History enabled, and has colors assigned can be configured to display in the Attribute History Section. Up to four history attributes can be displayed and are displayed in the order they appear in the configuration structure. The first configuration entry is used to set the default user parameter (the user can change only the first attribute). If you want this first attribute to appear regardless of the user parameter selection then add a duplicate configuration entry for it. (The duplicate will be ignored if the user doesn’t change from the default.) hist_attrib_id=none should be used when a customer doesn’t want to see the history attribute. This will make the history box disappear. (It takes the value from the last day of the period in the attributes history.) The History attribute uses the last day of the timeframe to determine the prevailing value. So, if you choose to breakdown by weeks it will use the last calendar day of each week. |
hist_attrib_id=wbs709_plan |
| FM: Baseline Version | Allows selection of two FM versions that are used for FM calculations. Defaults to marked and forecast and marked as baseline. Can be adjusted to compare to (for example) compare to a different baseline. | If zero (or not provided) the marked versions from the model will be used. Values provided are the version ID. Baselines are chosen from a list of master baselines for schedule variance calculations used in dates and milestones sections. Version IDs are listed in the ADM01 report. |
bl_version_id=0 |
| FM: Working Version | Allows selection of two FM versions that are used for FM calculations. Defaults to marked and forecast and marked as baseline. Can be adjusted to compare to (for example) compare to a different baseline. | If zero (or not provided) the marked versions from the model will be used. Values provided are the version ID. Baselines are chosen from a list of master baselines for schedule variance calculations used in dates and milestones sections. Version IDs are listed in the ADM01 report. |
fc_version_id=0 |
| Account Types for Financial Summary | Sets the default selections for what account types to include in the financial summary. | Values provided are the sequence ID of the account types. Note: If you configure one of the configuration entries to be: account_type=ACTP$CAP and “Capital” is not in the list of parameter values, nothing will default – even if the other configuration entries do exist. All account entires must be valid. |
account_type=ACTP$CAP account_type=ACTP$EXP account_type=ACTP$LAB |
| Financial Table View | The financial summary table is expandable and collapsible along the account structure. This entry sets the default value for whether the table is expanded or collapsed | Values are:
|
fm_tbl_view=collapsed |
| Filter Milestones |
This provides the ability to filter the milestones based on one or more alternate structure values. |
The viewer of the report can select the attribute values that the milestones are filtered on, but the list that the user sees in the parameter is ultimately determined administratively. Here are some scenarios to consider:
|
ms_filter_value=none Configuration Scenario Examples: Objective: Ability for user to filter by Work Status with default value as Open/Active only ms_filter_value=WBS20$OPEN Objective: Ability for user to filter by milestone type with no default ms_filter_value=Wbs712Root Objective: Ability to filter by Work Status and Milestone Type with defaults of: Work Status = Open/Approved Milestone Type = Governance or Deliverable ms_filter_value=WBS20$OPEN ms_filter_value=86 ms_filter_value=87 |
| Schedule Baseline | Ability to choose from a list of master baselines for schedule variance calculations used in dates and milestones sections. | Available values are active or baseline ID from the list of master baselines. Baseline IDs are shown in brackets next to the baseline name in drop down list. Baseline IDs are listed in the ADM01 report. |
sch_baseline_id=active |
| CRI Statuses | Include Change Request, Issue or Risks of only the selected CRI statuses | This parameter determines which statuses of CRI records are returned. The default returns all CRI records with the following statuses: Approved Awaiting Approval Disapproved Escalated Follow Through In Analysis Open The user can amend the statuses returned by adding or subtracting status values from the drop down list. |
Default can not be changed |
| Include Effort | Controls whether or not the “Effort” labor information appears in the Financial Summary | Yes/No | N/A |
Hidden Parameter Configuration (for Administrators)
| Parameters | Description | Configuration Options | Default/Example Settings |
|---|---|---|---|
| Show/Hide Executive Summary | This parameter allows the Executive Summary at the beginning of the report to be removed. | hide_exec_summary=Y or N If parameter is not included then Executive Summary will be shown |
hide_exec_summary=N |
| Executive Summary Columns | Provides ability for customers to override which columns appear in the executive summary. | The default is the first three (or four) table columns. However it is possible to manually override these columns with the following options: exec_sum_col1=attribute_id exec_sum_col2=attribute_id exec_sum_col3=attribute_id exec_sum_col4=attribute_id | exec_sum_col1=wbs20_plan exec_sum_col2=wbs709_plan |
| Executive Summary Grouping | The list of projects in the executive summary can be grouped by the attribute identified here. | This attribute should be an alternate structure (single or primary). If empty or not assigned then no grouping will take place (the default). | exec_sum_grp= |
| Executive Summary Grouping Order ☑ Added in RPM Analytics v2.2.0 |
This sets the sorting for the executive summary grouping. | Options are: alpha will sort the grouping attribute alphabetically structure will sort the grouping attribute by the structure order exec_sum_grp_sort=alpha|structure |
exec_sum_grp_sort=alpha Sorting prior to parameter addition in v2.2.0 will be alphabetical |
| Executive Summary Header ☑ Added in RPM Analytics v2.5.4 |
This parameter sets the header/title for the Executive Summary Heading Section. | The title can be set using:
|
The default FastTrack configuration for the parameter will display the title as:
|
| Show/Hide the Last Change Date column for the RAG Status Column |
This parameter controls the visibility of the Last Change in Value column in the Executive Summary section and the Last Modified column in the Highlight Report section. |
hide_rag_change_date=N|Y This parameter (default=N) turns the Last Change in Value column in the Executive Summary section and the Last Modified column in the Highlight Report section on or off. |
hide_rag_change_date=N |
| Report Header Attributes | Twenty-nine columns are available for display in the report header section. Executive Summary table on page 1 of the report (when run on a portfolio) includes the first four table columns. These Executive Summary columns can be separately configured. See below. |
Appear in the sequence in which they are placed in the structure. Minimum number of columns is seven columns. Recommendations – key project categorization, status and responsibility attributes. These attributes are configured in the Table Columns Section of the Report Config Structure. |
work_id lc_role_3_plan wbs20_plan opcapappr_plan wbs24_plan lc_role_250_plan wbs28_plan wbs26_plan |
| Section Break in Report Header Attributes ☑ Added in RPM Analytics v2.2.0 |
Provides ability to add a section break between report header data points. These breaks can be configured with a section heading and/or a fixed dividing line. For further information refer to the Attribute Details and Configuration Rules topic. |
Section breaks are a type of Report Header attribute inputted in the Table columns section of the report configuration structure. Available options for adding in to the report header are:
|
See above for defaults Examples: Add a Section Break with heading section_break1=section break heading section_break1 Add a Section Break with a Heading and Dividing Line section_break2=section break heading section_break2 Add a blank space section_break1 Ideal for adding space between sections or to end a section with an un even number of attributes so the next section break can be added horizontally. |
| Additional Assessment Indicator (RAG) entries | This report supports up to 9 additional RAG entries (without history). These will appear in a table immediately underneath the existing Attribute History Table. | Charting colors have to be assigned. The RAGs appear in the order that the structure entries are created: other_rag=attribute_id. Short Name entered on the charting colors screen is what will be shown against the RAG colors in the additional RAG boxes. |
other_rag=wbs721_plan other_rag=wbs722_plan other_rag=wbs723_plan other_rag=wbs724_plan other_rag=wbs725_plan other_rag=wbs726_plan |
| RAG Status Background Color | This parameter determines how the various RAG or history attributes are highlighted in both the executive summary and report. Background sets the cell's background color (font color is black). Foreground sets the font color and leaves the background to white. Off (or any other value) turns the highlighting off. This is especially useful for those who have difficulty seeing colors. | rag_highlight=background|foreground|off | rag_highlight=background |
| Attribute History Section Title |
This parameter sets the header/title for the Attribute History section. | The title can be set using:
|
The default FastTrack configuration for the parameter will display the title as:
|
| Status Assessment Indicators Section Title |
This parameter sets the section header for the status assessment (RAG) indicators. | The title can be set using:
|
The default FastTrack configuration for the parameter will display the title as:
|
|
Long Text Fields Section of Report |
Determines the list of long text fields near the top of the report Prior to RPM Analytics v2.2.1 the maximum number of fields that can be configured is 10. |
Entries can be either long text fields or project (PPL) level notes from Work and Assignments. No minimum required, maximum of 30 values. Fields will appear in the order in which they are listed in the configuration structure. long_text=Field ID |
long_text=pe01 long_text=assessment_descrip long_text=key_acc_this long_text=key_next_week long_text=PE02 |
| Long Text Fields Section Title |
This parameter sets the header/title for the Attribute History section. | The title can be set using:
|
The default FastTrack configuration for the parameter will display the title as:
|
| Hide Financial Table/Information | Controls whether or not the Financial Summary Table is displayed. | Values are Y or N. The account type configuration entry must be set to NA in order to disable financial information. | hide_financial_summary=N account_type=NA |
| Labor Account Structure | The financial summary table will display labor information to the level of detail determined by this hidden attribute. | The value determines the number of labor line attributes that appear as the account name separated by dashes (as it does in the Financial Plan). They appear in the order they are configured in. | max_labor_attributes=2 |
| Financial Summary View | The financial summary table is expandable and collapsible along the account structure. This entry sets the default value for whether the table is expanded or collapsed. | Values are:
|
fm_tbl_view=collapsed |
|
Financial Variance Background Formatting ☑ Enhanced in RPM Analytics v2.2.1 |
Provides the ability for the customer to configure the background coloring that’s used for the variance columns in the Financials section of the report. Previously the backgrounds were hard coded to be red (if the variance was “worse” than zero) or green (if the variance was 0 or “better”). Worse or better, directionally, depended on the “variance_calculation_type” configuration. That configuration still applies and simply determines if “good” variance (spending less than expected) results in a positive or negative value.
|
To support a wide variety of customer use cases, up to six “bands” that can be defined (a band is a rule and associated color). For instance a rule may be something like, “if the variance is less than or equal to -10% then the color should be red.” Using this as an example, a band defines a single rule which is composed of a threshold -0.10 (10%) and an operator <= which is used in the comparison to the variance value. Percentages are always entered as their float value (e.g., 25%=0.25). Since a rule only defines a single operation, the way multiple bands are supported is to use the first matching rule. So you may have the following rules defined:
In this case -25% technically matches the first two rules, but only the first one applies since it’s the first one in the list (the first one listed in the configuration structure). There MUST be at least two rules defined. To remove color completely, create two rules that both have the color value set to Transparent (or White). The color banding logic does not take into account the variance_calculation_type. Therefore ensure that thresholds are appropriate to the positive/negative outcome of your selected configuration. |
Nomenclature: Each rule is created using a parameter default called “fm_thresholds”. To the right of the equal sign are three pieces of information separated by the pipe character (“|”):the operator (<, <=, >=, >), the threshold value (entered as a floating point number), and the color (either as a Hex value or CSS color name). The prior example (three rules) would be entered as follows (and in this order): fm_thresholds=<=|0.10|#FF0000 fm_thresholds=<=|-0.05|#FFFF00 fm_thresholds=>|-0.05|#00FF00 |
| Variance Calculation Type | The report allows the administrator to determine how the financial variance is calculated | The options are:
|
variance_calculation_type=1 |
| Financial Model | Ability to control the financial model used for the Financial Planning data displayed in the report. For additional information refer to the FastTrack Analytics - Using Financial Management Data topic |
The financial model for this report can be changed from the Model marked as default default to a specific model ID. Model IDs are listed in the ADM01 report. Example: def_prj_model_id=3 |
No override exists as default |
| Hide Date Table ☒ Removed in v2.1.1.0 |
Controls whether or not the “Dates” section of the report is visible | Values are Y or N | hide_dates=N |
| Scheduled Dates Table ☑ Added in v2.1.1.0 |
Provides users with the ability to include WRM project schedule information in the report output | The table can be configured to control the depth of the WBS information returned and a single work attribute that will appear next to the work description column. Configuration entry 'sch_dates_depth=' defines the maximum depth of the WBS (starting at PPL) that should appear in the “Schedule Dates” section.
There is NO filtering available in this table |
sch_dates_depth=1 For customers upgrading from pre v2.1.1.0 The install script will automatically set the sch_dates_depth value to -1’ if their existing configuration has the Hide Dates option set to Y on the previous dates table (maintaining the existing preference to hide it). |
| Show Requested Dates ☑ Added in v2.3 |
This parameter allows the inclusion of requested dates information in the scheduled dates table to be turned on or off. |
A default can be set using:
|
The default FastTrack configuration for the parameter will:
|
| Milestone Type Attribute | The table of milestones can be grouped by a milestone type attribute. | This setting defines the attribute that is used. | milestone_type_id=wbs712_plan |
| Milestone Attribute | The milestone table has a column that can be used to display a single select activity level attribute. | This parameter sets the attribute used in the new column added to the milestones section. The default value (if not configured) is wbs20_plan (work status). ms_field=attribute_id |
ms_field=wbs20_plan |
| Hide Milestone | Provides the ability to hide the milestone section of the report |
Possible values;
|
hide_milestones=all |
| Milestone Range | Provides ability to set the time range of milestones returned | Provides ability to limit the time range of the milestones that are included in the report, based on the Actual/Scheduled date of each milestone. For example:
Blank is no limit. |
ms_range_min= ms_range_max= |
| Milestone Type Sorting ☑ Added in RPM Analytics v2.2.0. |
This parameter is a configuration option used for determining how milestones should sort: | Option available:
Note: If there is a milestone group - the sorting is done within the groups (the group will sort first). |
ms_sort_order=structure If no entry exists, config will default to structure |
| Project Milestones Section Title ☑ Added in v2.3 |
This parameter sets the header/title for the Project Milestones section. | The title can be set using:
|
The default FastTrack configuration for the parameter will display the title as:
|
| Filter on CRI Attribute ☑ Added in RPM Analytics v2.3.2 |
This configuration entry identifies the attribute that is to be used in the filter. | The configuration entry value is:
|
cri_filter_attrib= The default/unconfigured value is none (no filtering) |
| CRI Filter Attribute Value ☑ Added in RPM Analytics v2.3.2 |
This configuration entry identifies the structure_code/sequence ID or user_name of the value to be filtered on (included). | The configuration entry value is:
|
cri_filter_value= The default/unconfigured value is none (no filtering) |
| Hide CRI Tables | Ability to Include/Hide Change Request, Issue or Risk Tables in Report | This parameter determines whether the CRI summary tables are included. If set to Y and a project has no C/R/I, static text is shown saying there are no associated C/R/I. These controls can be made report specific by making entries in the report specific Config in the Global Default Overrides node. If CRI is not being used in global defaults in the FastTrack Configuration Structure, the CRI status parameter is pre-populated and pre-selected to Not Applicable, and the CRI section of the report is completely hidden. | use_changes=Y use_risks=Y use_issues=Y |
| CRI Description Column ☑ Added in RPM Analytics v2.2.2 |
Ability to control what displays in the description column of the CRI tables. | This parameter determines whether or not the CRI’s long description is appended to the CRI title in the first column of the CRI tables.
|
cri_concat_long_desc=Y |
| Issue Table Columns ☑ Added in RPM Analytics v2.2.2 |
Ability to configure the issue table columns in the CRI section of the report. | This parameter determines what CRI attributes display as columns in the Issue table in the CRI section. Up to five columns can be configured away from the default values. issue_col1= issue_col2= issue_col3= issue_col4= issue_col5= issue_col6= Columns will display between the CRI description and Long Text columns. |
issue_col1=cri1_cri issue_col2=cri3_cri issue_col3=cri2_cri issue_col4=initiated_on_cri issue_col5= cri_targetdate issue_col6= Note: If no entries exist in the structure, these values will still show as the defaults when the report executes. |
| Issue Table Long Text |
Determine long text field in Issue section. Note that the first column "Description" column in the table shows the short name/title of the issue concatenated with the long description of the issue. |
The only configurable element of the table of issues included in the report is the final long text column. This is controlled by this parameter. | issue_text_field=cri_acplan |
| Risk Table Columns ☑ Added in RPM Analytics v2.2.2 |
Ability to configure the risk table columns in the CRI section of the report. | This parameter determines what CRI attributes display as columns in the Risk table in the CRI section. Up to five columns can be configured away from the default values. risk_col1= risk_col2= risk_col3= risk_col4= risk_col5= risk_col6= Columns will display between the CRI description and Long Text columns. |
risk_col1=cri1_cri risk_col2=cri3_cri risk_col3=cri2_cri risk_col4=initiated_on_cri risk_col5= cri_targetdate risk_col6= Note: If no entries exist in the structure, these values will still show as the defaults when the report executes. |
| Risk Table Long Text | Determine long text field in Risk section. Note that the first column "Description" column in the table shows the short name/title of the risk concatenated with the long description of the risk. |
The only configurable element of the table of risks included in the report is the final long text column. This is controlled by this parameter. | risk_text_field=risk_plan |
| Change Table Columns ☑ Added in RPM Analytics v2.2.2 |
Ability to configure the change table columns in the CRI section of the report. | This parameter determines what CRI attributes display as columns in the Change table in the CRI section. Up to six columns can be configured away from the default values. change_col1= change_col2= change_col3= change_col4= change_col5= change_col6= Columns will display between the CRI description and Long Text columns. |
change_col1=cri1_cri change_col2=cri3_cri change_col3=cri2_cri change_col4=initiated_on_cri change_col5= cri_targetdate change_col6= NB: If no entries exist in the structure, these values will still show as the defaults when the report executes. |
| Change Request Table Long Text | Determine long text field in Change section. Note that the first column "Description" column in the table shows the short name/title of the change request concatenated with the long description of the change request. |
The only configurable element of the table of change requests included in the report is the final long text column. This is controlled by this parameter. | change_text_field=ch_benifit |
| Configurable Sorting | This allows the customer to choose three sort criteria prior to sorting by project name. | report_sort1=xyz, report_sort2=xyz, report_sort3=xyz, where xyz is the attribute to sort on. The attribute does not have to be a visible table column. | report_sort1=project_description |
| Customer Logo | Ability to change the report logo | The Global Default Parameter defines the location/filename of the logo shown at the top of the report. A report-specific logo can be used by making an entry in the Global Default Overrides section of the WRK14 node. |
customer_logo=/Reports/RPM_PROD/pv_logo_600x90.png |
| Report Title | Configurable report title that appears at the top of the report. | If a longer report title is required, create additional report_title=xxx entries. These will be concatenated together based on the order in which they are listed in the configuration structure. | report_title=Portfolio Highlight Report |
Technical/Database Information
| Report (RDL) Location | …/Reports/FastTrack/Mixed_Use/STATUS16-LandscapeEntityStatus/STATUS16.rdl |
| Dashboard | The same RDL is used in both Work Portfolio and Work Project dashboard. |
| Database | This report uses the transactional database and updates will be real-time. |