
WRK04 – Project Financial Health
- Last updated
- Save as PDF
Overview
Based on an approved financial baseline and the current forecast to complete, this exception-based analytic identifies projects in a portfolio that are financially out of tolerance and are forecasting an over or under run on approved baseline budget.
WRK04 example
Business Outcomes
- Identify projects that are starting to forecast a financial exception and take mitigating actions.
- Establish robust baselining and forecasting processes to ensure that project budgets can be controlled.
- Identify projects that are forecasting a cost under run and determine whether this funding may be leveraged elsewhere.
Supporting Capabilities
- Project Planning and Scheduling
- Financial Management
User Guide
This report is only available as a portfolio report. It is not available as a single project report.
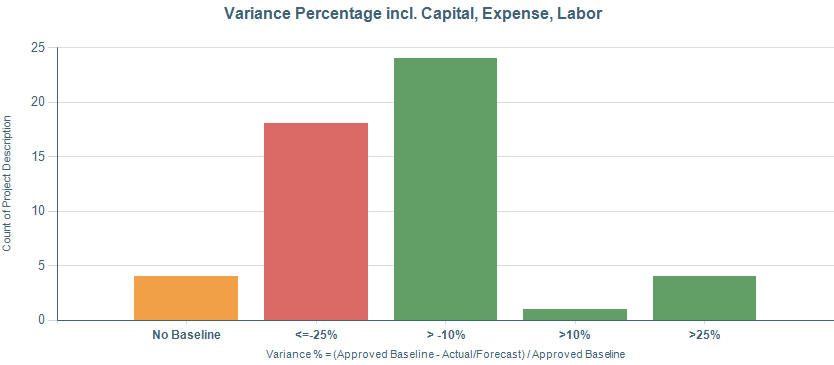
The Variance Percentage Chart provides a count of projects in the portfolio, grouped by their financial performance, which are reporting and out of tolerance variations against their baselines.
Each project's financial performance is calculated as a variance between their approved financial baseline costs and the current forecast to complete costs. A financial performance percentage is then calculated based on what percentage over or under budget that project is.
All projects in the portfolio over or under budget by 10% will be included in the report. Projects not matching this criteria (less than 10% over or under budget) will be ignored).
The chart groups the returned projects in to the following groups:
- No Baseline (Orange) - These projects do not contain an approved financial baseline.
- <=-25 (Red) - Projects where the financial performance variance percentage is less than - 25% (Project is 25% Over budget)
- <=-10 (Yellow) - Projects where the financial performance variance percentage is less than - 10% (Project is 10% Over budget)
- >=10 (Green) - Projects where the financial performance variance percentage is greater than 10% (Project is 10% Under budget)
- >=25 (Green) - Projects where the financial performance variance percentage is greater than 25% (Project is 25% Under budget)
These thresholds are not configurable. If no projects meet one of the criteria above, the bar chart column will not appear on the report.
The bar chart should be used to quickly identify projects that are financially out of tolerance and are forecasting an over or under forecast against their approved baseline budget.
User Parameter Configuration (for Administrators)
| Parameters | Description | Configuration Options | Default/Example Settings |
| Start/Finish Period: | Parameters used to determine the data returned based on the fiscal calendar periods |
The fiscal time period range used in the financial summarization depends on the user parameters for the Start and Finish Periods. | Default is always first/last available period respectively |
| Separate Projects with No Baseline? | Option to include, or include in a separate table, projects that don’t yet have a financial Plan baseline (Baseline version value =0) | Default for positioning of projects with no baseline. Options are: Bottom, Top, No |
separate_no_baseline=Bottom |
| Select Target Currency | Display currency | Can only be changed in a multi-currency environment. | Default will be the User’s currency as defined in (User menu > Preferences > Financial and Investment Planning > Currency). If no preference is set, then it will use the system default currency. For all versions prior, it will use the system default currency. |
| Financial Category: | Ability to choose between financial categories | Defaults is Cost. | Defaults can not be changed |
| Account Types: | Options to set the default account types that are selected. Each selection is a separate entry in the configuration structure | Options are the sequence ID of the account type (ACTP$BEN, ACTP$CAP, etc.). You cannot mix benefit accounts and cost accounts. | account_type=ACTP$CAP account_type=ACTP$EXP account_type=ACTP$LAB |
| Working/Baseline Versions: | Option to select financial versions for comparison | By default this report uses the Primary Work Financial Model and the Forecast and Baseline version flags. Users can select different versions. | Defaults can not be changed |
Hidden Parameter Configuration (for Administrators)
| Parameters | Description | Configuration Options | Default/Example Settings |
| Table Columns | Two grouped columns before the project name. Four optional columns after the project name. |
It is recommended that WBS parent levels are used in the first two columns. It is recommended that the later four columns are used for key status and/or responsibility attributes. |
wbs_level_2_plan wbs_level_3_plan wbs20_plan opcapappr_plan lc_role_3_plan wbs709_plan|Center|bgc |
| Alternate Financial Plan ☒ Removed on v2.2.0 |
It is possible to show data from an alternative financial model through the global default overrides section of the FastTrack Report Configuration structure. | By default this report will use the work financial plan model that is marked as primary. This behavior can be overridden by creating an entry in the Global Default Overrides section for an alternative financial plan model ID. | Global Default Overrides section of the FastTrack Report Configuration structure
def_prj_model_id=xx where xx = the model ID |
| Override Financial Model ☑ Added on v2.2.0 |
Ability to override the default financial model for the report. | To override the financial model simply add the syntax under parameter defaults: model_id=x (where x is the id of the model) |
Report will reference financial data from the default model until the syntax is specifically added. |
| Report Title | Configurable report title that appears at the top of the report. | If a longer report title is required, create additional report_title=xxx entries. These will be concatenated together based on the order in which they are listed in the configuration structure. | report_title=Project Financial Health Analysis |
Additional Information
The data displayed is from the work financial plan and is therefore dependent upon the financial plan load process and all upstream processes, such as progression and daily tables.
Technical/Database Configuration
| Report (RDL) Location | …/Reports/FastTrack/Mixed_Use/FM04-FinancialHealth/FM04.rdl |
| Database | This report uses the transactional database and updates will be real-time. |