
STR51 - Strategy Portfolio Associated Work Matrix
- Last updated
- Save as PDF
Overview
A strategy portfolio based report that shows status and data on the projects associated to the programs and initiatives in the portfolio. Report is equivalent to WRK01, but is based on a strategic portfolio.
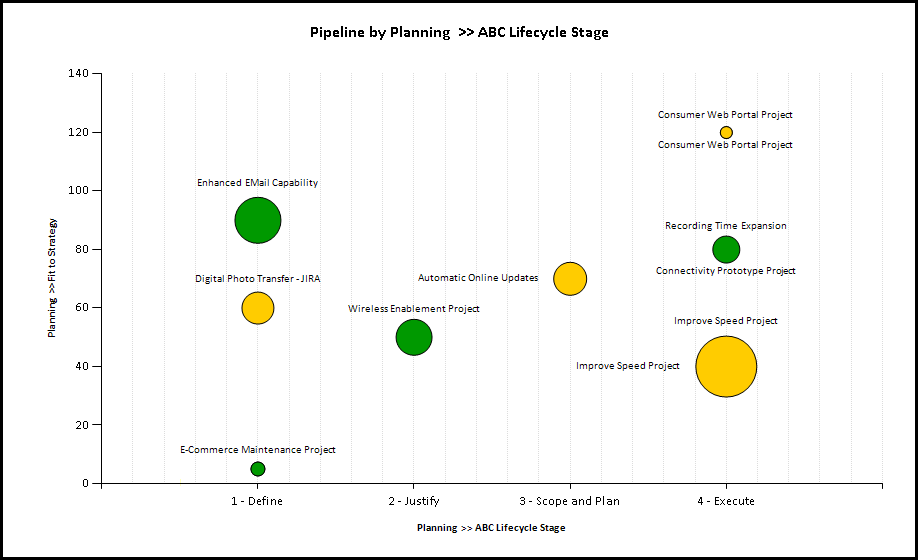
Strategy Portfolio Associated Work Matrix example
Business Outcomes
- Supports the tracking of performance of projects associated with Programs.
- Program Managers can analyze and understand project metadata in the context of the potential impact on strategic programs.
- Provides data to support the efficient managing of programs.
Supporting Capabilities
- Strategic Planning
- Strategic Financial Planning
User Guide
Coming soon.
Administration: User Parameter Configuration
| Parameters | Description | Configuration Options | Default/Example Settings |
| Show Bubble Label: | Determine whether the bubbles have an associated label. | Options are; none = None export = Export both = Browser & Export |
show_bubble_label=both |
| Size Attribute: | Measure used to size the bubble. |
The available measures include; Any numeric attribute that is enabled for “Use in Configurable Charts” in the attribute display setting, including standard numeric fields, custom numeric fields, effort, duration and currency. |
bubble_size=grs_fm_fcst_cos_dflt_plan |
| Color Attribute: | Attribute that will be used to color the bubbles representing each strategy. | Any single select strategic attribute. Must have charting (color) options configured. Color plotted will be based on this config. | bubble_color=wbs709_plan |
| Y-Axis Attribute: | Attribute that will be plotted on the Y-Axis | Same as the size attribute, plus any date attribute. | x_axis=none |
| X-Axis Attribute: | Primary plot on the X-Axis | Same as the size attribute, plus any date attribute. | y_axis=score1 |
| X-Axis Grouping: | Grouping (by an attribute) within the X Axis range. | Any single select strategic alternate structure (enabled for Analyze Charts) plus Lifecycle Roles. Lifecycle stage recommended | x_axis_group=wbs28_plan |
| Sort X Axis Grouping: | Define the sorting order for the X-Axis Grouping (if defined) | Two options: Alphabetical (default) Structure Order |
Default cannot be changed |
Administration: Hidden Parameter Configuration
| Parameters | Description | Configuration Options | Default/Example Settings |
| Table Columns | Report supports 3 required/grouped columns plus 3 optional columns. | strat_name wbs_level_4_plan project_description wbs20_plan lc_role_3_plan |
|
| Bubble Label | Determine which attribute is used for the bubble label | Recommend Strategy Name or Strategy ID | label_attribute=project_description |
| Depth Restriction | Sets the level of the structure that is reported on | A value of zero (0) removes such limit. | restrict_depth=5 |
| Table Format | Defines how the detail table at the bottom is formatted | The value “sectiongroup” renders a table with grouping, whereas “plain” renders a table that’s good for analysis in Excel. Neither of these apply when the report view is “Dashboard” because the table is hidden. | table_format=grouped |
| Report Title | Configurable report title that appears at the top of the report. | If a longer report title is required, then create additional report_title=xxx entries and these will be concatenated together based on the order in which they are listed in the configuration structure. | report_title=Strategy Portfolio Associated Work Matrix |
Additional Information
- The measures (Size attribute, X-Axis and Y-Axis) include derived financial plan based columns, for each financial planning account type, baseline version, forecast version actuals and forecast cost version forecast and forecast version total.
- Financial management sub-total or calculated columns are not available as measure attributes. These can be added through a reporting attribute data model extension. Please refer to Global Reporting Services.
- The chart will plot projects with a zero value on the bubble size attribute – they are shown with a very small (minimum size) bubble. The tool tip hover on the bubble shows the values being plotted.
Technical/Database Information
| Report (RDL) Location | …/Reports/RPM/Strategy_RPM/RPM-STR51/RPM-STR51_v2.rdl |
| Database | This report uses the transactional database and updates will be real-time. |
| Report Developer Info | RPM-STR51_v2 RDL is a derivative of the BUBBLE01 RDL |