
STR16 - Program Highlight Report
- Last updated
- Save as PDF

Overview
Summary of key information relating to the execution of a program into a “one page” report for program stakeholders and strategic review meetings. Includes program attributes and responsibility information, trend of program condition/RAG/RYG status, descriptive information, date and milestone information, financial summary, commentary and change request, risk and issue lists, plus key information on the associated projects that are delivering the program.
Report can be run for a single program, or across a strategic program portfolio. Portfolio report includes an Executive Summary table on page 1 and each program in the portfolio on a new page.
Executive Summary
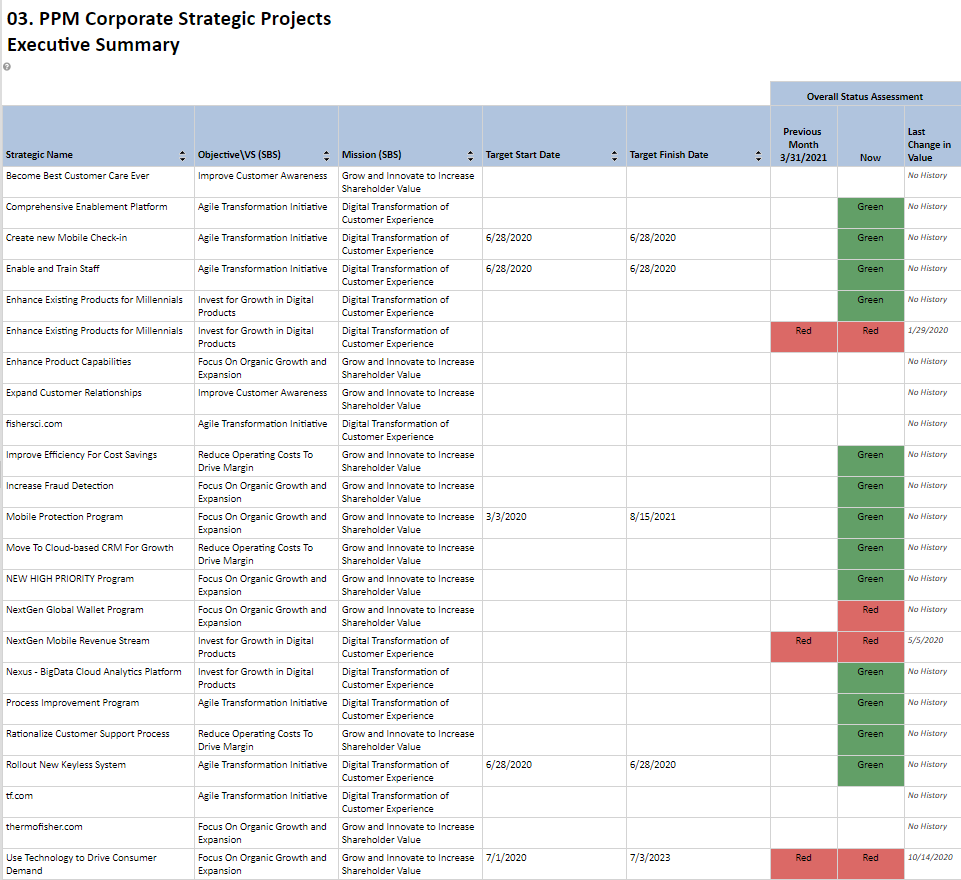
Executive Summary table example
One-Page-per-Program Detail
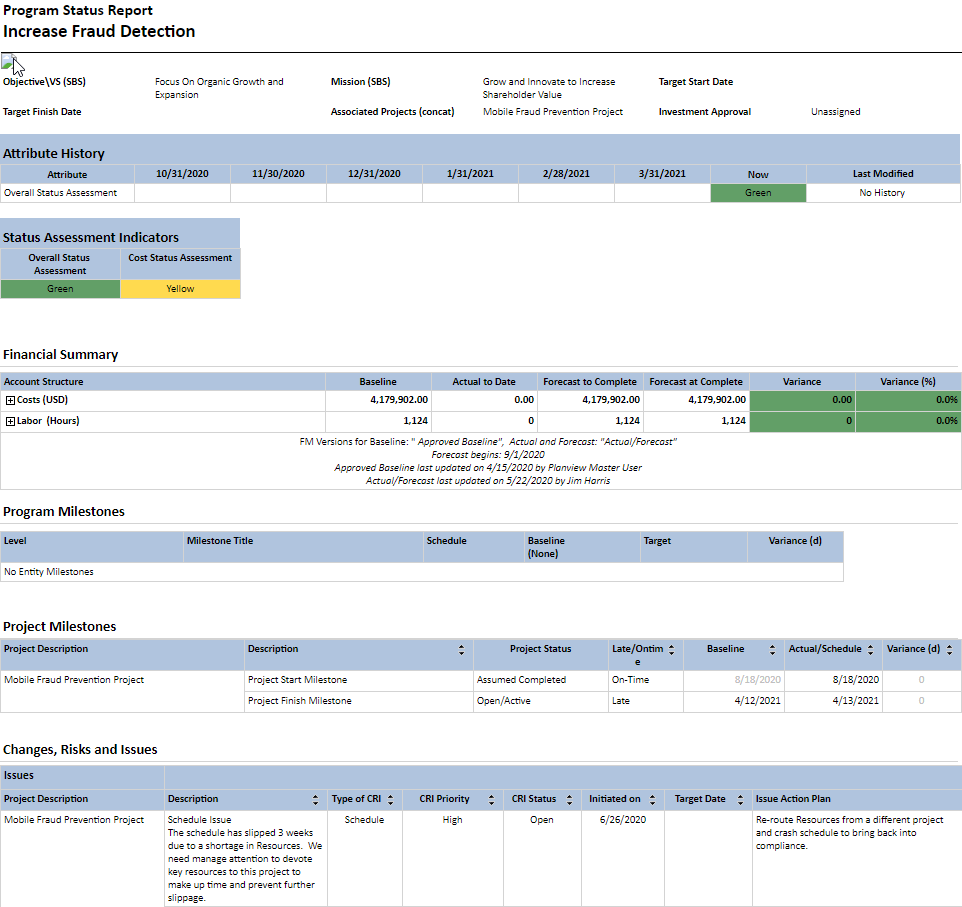
One-page-per-program detail example
Business Outcomes
- Drive the discipline that Planview Portfolios will provide the single source of truth relating to program execution status.
- Visibility of program status to stakeholders.
- Rapid and efficient collation of program status information, across the portfolio, allowing the production of steering committee/program board status report packs.
Supporting Capabilities
- Program and Project Monitoring
Report Detail
|
Key Summary Information Logo Reporting Period |
Status Assessment Indicators Associated Project Milestones |
Report Business Rules
This report is showing data from the Planview Portfolios transactional database, therefore updates made to programs or project data will update "real-time" into the report, however there are dependencies on various batch processes and administrative tasks;
- The financial data and effort data displayed in the Financial Summary table is sourced from the Financial Planning Detail screen of the program.
- The effort values are dependent upon the planning of resource effort in the Project Schedule (in Work and Assignments), on the submission of project timesheets, on execution of the Progressing Engine and on the load of effort from the schedule/timesheets (actuals) into the Financial Plan
- The Actuals to Date and Forecast to Complete values are dependent upon the Forecast Period setting in Financial Management. This is an Administrator controlled setting that determines which financial periods are Actual and which are Forecast.
- The Actuals to Date column in the Financial Summary shows the costs and effort expended to deliver the program so far, and is the sum of all values for financial periods prior to the Forecast Period.
- The Forecast to Complete column in the Financial Summary shows the costs and effort that are planned (forecasted) to complete the execution of the program, and is the sum of all values for financial periods including and after the Forecast Period.
- The Forecast at Complete column in the Financial Summary is the sum of the Actuals to Date and the Forecast to Complete columns
- The Baseline values in the Financial Summary table are displaying the financial data held in the selected baseline Financial Management version.
- The Variance column shows the difference between the Baseline and the Forecast at Complete.
- Milestone Type Attribute can only be Work attributes.
Printing and Exporting
This report is designed with with printing in mind. It is formatted to fit to Letter/A4 landscape size with the intention of being suitable for distribution in an easily readable format.
Recommended export formats are:
- Word
In order to print to hardcopy a report must be exported to PDF format and the PDF file sent to the printer.
Report Parameters
| Parameters | Description |
| Portfolio Size Check | Parameter shows number of programs in Portfolio and contains report logic that prevents the report from running automatically IF the number of projects in the portfolio exceeds a threshold. Only applicable when run against a portfolio of projects. Threshold < 100 projects |
| Target Currency | In a multi-currency system the currency for the financial data can be selected. |
| History Period Timeframe | Time interval used for the attribute history intervals |
| History Attribute | Provides a way to show an attributes history Any work single select work alternate structure that has been enabled in Attribute properties to be “Available in Analyze Charts” and has “Track History” enabled and has colors assigned can be configured to display in the Attribute History Section. |
| FM: Baseline Version | Allows selection of two FM versions that are used for FM calculations. Defaults to marked and forecast and marked as baseline. Can be adjusted to compare to (for example) compare to a different baseline. |
| FM: Working Version | Allows selection of two FM versions that are used for FM calculations. Defaults to marked and forecast and marked as baseline. Can be adjusted to compare to (for example) compare to a different baseline. |
| Account Types for Financial Summary | Sets the default selections for what account types to include in the financial summary. |
| Financial Table View | The financial summary table is expandable and collapsible along the account structure. This entry sets the default value for whether the table is expanded or collapsed. Values are:
|
| Filter Milestones |
This provides the ability to filter the milestones based on one or more alternate structure values. |
| Project Schedule Baseline | Ability to choose from a list of master baselines for schedule variance calculations used in dates and milestones sections. |
| CRI Statuses | This parameter determines which statuses of CRI records are returned. The default values of the statuses are based on status rules. The report will show all CRI Status values that are enabled and (by status rule) active. The user can amend the status values returned by adding or subtracting status values from the drop down list in the user parameters. Typical active statuses include:
|
| Strategy Baseline | This parameter allows the admin to specify which strategic baseline to use (STR16 only) in the Milestone portion of the report. Available values for selection are:
|
| Include Effort | Controls whether or not the “Effort” labor information appears in the Financial Summary Options are:
|