
PLN32 - Planning Portfolio Financial Burndown Comparison
- Last updated
- Save as PDF

Overview
- Planning report that allows the comparison of one/many versions of financial plan data, including effort (FTEs/Days/Hours) or financial data (Cost/Benefit/Revenue). Includes a burn down chart for the whole portfolio and for each project.
- The report includes;
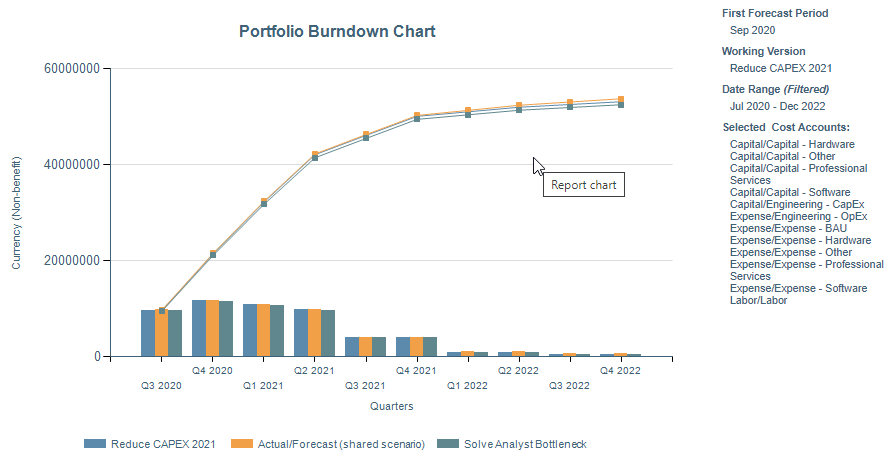
- Portfolio based summary time phased chart showing the financial profile (based on one/many financial plan versions) across the whole portfolio (example shown in first image)
- Project level time phased chart showing the financial profile (based on one/many financial plan versions) for each project (example shown in second image)
- Detailed data tables
PLN32 example
Business Outcomes
- Tracking of actual burn and forecast burn to ensure that spend/effort/revenue/benefits are in line with projections.
- Enable comparisons between stage gate baselines/snapshots to track variances in project cost and revenue profiles as project moves through the stage gate lifecycle, driving improvements in forecast accuracy.
- Identify investments that are performing badly as they move through execution so that they can be considered for a Go/Kill decision at stage gates.
Supporting Capabilities
- Initiative Planning
- Capacity and Demand Balancing
Additional Information
Details of the attributes, data types and parameters available for each report dimension:
- X Axis – Time Periods; these periods are based on the Enterprise and Fiscal Calendar.
- Y Axis – Financial Value; the y axis shows data from the financial plan. The following parameters are used to determine what is shown;
- Currency; if Planview Enterprise is configured to support multi-currency then this parameter allows selection of the currency to display the financial values in. Standard currency conversions are used.
- Working Scenario; this lists the Shared Scenario (the Financial Management version selected in the portfolio definition) plus any portfolio specific scenarios that have been created in the portfolio. The selection made here determines the primary financial data that is displayed the report
- Compare to Scenarios(s); this lists the Shared Scenario (the Financial Management version selected in the portfolio definition) plus any portfolio specific scenarios that have been created in the portfolio. Selection of a Compare to Scenario is optional and one or many alternative scenarios can be selected which will then be displayed in the report and that will be compared to the main (working) scenario.
- Financial Measure; financial planning can be used to store financial, effort and unit data. Only one measure type can be selected, to ensure that different data types are not aggregated.
- Financial Category; selections are either “Cost” or “Revenue/Benefit”. These are determined by the financial management account configuration.
- Account Types; Capital/Expense/Labor; based on the financial management account configuration, this parameter allows further filtering of the financial data that is aggregated for the Y Axis.
- Accounts; this list is dynamically built based on the prior selections and shows the hierarchy of all accounts configured in the model that fit the Category and Account Type selections.
- Max Line Attributes; this determines how the data is displayed in the table, specifically how many line attributes
Report Parameters
| Parameters | Description |
| Working Scenario | This parameter lists the Shared Scenario (the Financial Management version selected in the portfolio definition) plus any portfolio specific scenarios that have been created in the portfolio. The selection made here determines the primary financial data that is displayed the report |
| Compare to scenario(s) | This parameter lists the Shared Scenario (the Financial Management version selected in the portfolio definition) plus any portfolio specific scenarios that have been created in the portfolio. Selection of a Compare to Scenario is optional and one or many alternative scenarios can be selected which will then be displayed in the report and that will be compared to the main (working) scenario. |
| Financial Measure | This parameter controls the unit of measure to display in the report Options for selection will depend on what's been configured for the chosen financial model. Possible options include:
the Cost from the financials. Currency (Benefit) will show the benefit or revenue from the financials. Units will show the unit value of the financial account. |
| Currency | Currency in which the amounts should be displayed |
| Account Types | Specify the account types that should be considered. This is multi select parameter, values for selection are:
Benefit can only be selected if the financial configuration includes Benefit |
| Accounts | This is a multi select parameter to specify the accounts that should be considered. The values for selection will be the financial accounts configured for the account types selected in the previous parameter. |
| Include Entities with Zero Financials? | This parameter determines whether the report should return entities with no financial data. These entities refer to work, strategy or outcomes depending on the configuration of the current portfolio selection. |
| Max Line Attributes | This parameter determines how many line attributes are displayed in the table |
| Period/Ending Starting | Starting/Finishing Month for the interval |
| Chart Detail Metric By | Timescale to use for the trend chart Values for selection are:
|
| Table Format | This parameter determines the format of the detailed data table in the report. Users can select a formatted layout, with grouping either expanded or collapsed, or a plan, flat-table, format that is designed for use when exporting the report to Excel for further data analysis. Options for selection are:
|