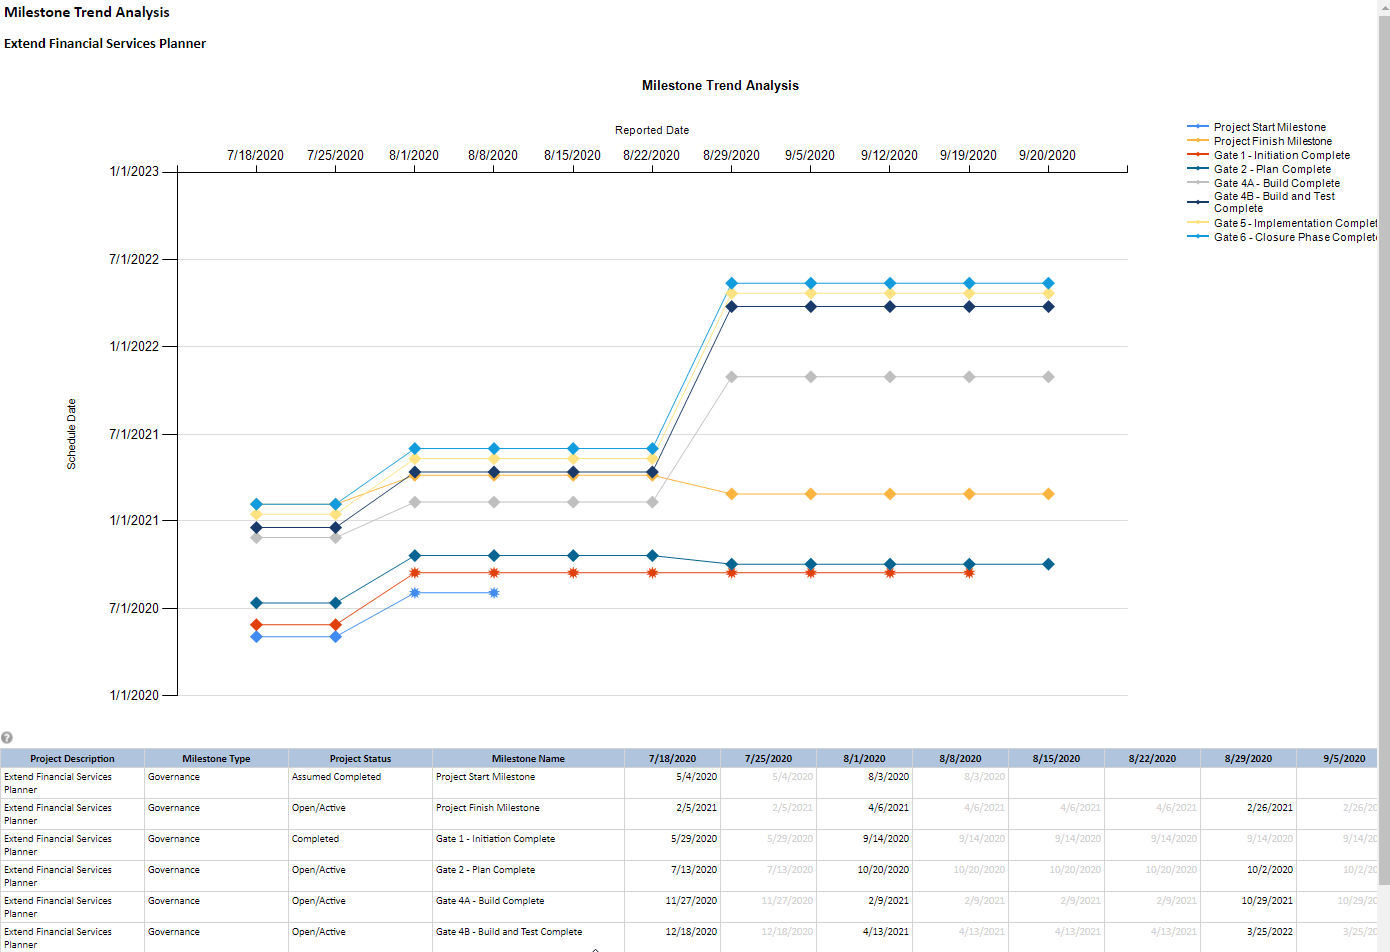
The milestone trend analytic provides insight into schedule (planned) date changes on milestones in project schedules associated with Outcomes. Changes in the schedule date for milestones are snapshotted (normally every week) by the Progressing Engine. Each milestone is plotted as a single line.
A horizontal line indicates that the schedule date of the milestone is not changing
A line that trends downwards indicates a milestone that is trending towards an earlier date
A line that trends upwards indicates a milestone that is being delayed and trending towards a later schedule date
As soon as a milestone has an actual date the plotting of the line stops
This analytic requires the Progressing Engine v2.1 or higher as the functionality to snapshot the schedule date was introduced in this version.
OUT35 example
Business Outcomes
Assists in driving on-time project delivery and improved time to market.
Performance monitoring of the planning and delivery of projects, based on the different types of milestones.
Supporting Capabilities
Project Planning and Scheduling
Project Monitoring and Status
Report Business Rules
This analytic requires the Progressing Engine v2.1 or higher as the functionality to snapshot the schedule date was introduced in this version.
The snapshotting of schedule dates will only occur after installation of the Progressing Engine v2.1. No data will be available for time periods prior to the installation of this version of the progressing engine and report will not return any data for these periods.
The time range displayed on the X and Y axes will cover the whole actual/schedule start to actual/schedule finish dates for the project.
The Y axis is the schedule (or actual) date of the milestone.
The X axis is the date (period ending) that the snapshot of the milestone was taken.
The report is available as both a work portfolio and single project report tile. When run against a portfolio there is a user parameter to determine whether all milestones in the portfolio are plotted on a single chart, or whether one chart per project in the portfolio is displayed. The portfolio chart option is only suitable for use when there is a small number of milestones on the portfolio and it is therefore recommended that it is executed against a small portfolio, or milestone filtering, via the user parameter, is applied.
When viewing the report in a report tile, a mouse over/tooltip is provided on the chart lines, showing the milestone name, schedule date and snapshot (report) date. This information is not available when the report is exported.
Report Parameters
Parameters
Description
Time Interval for Analysis
This parameter controls the time interval used for plotting data in the report. Options for selection are:
week - displays the schedule date that was in place at the end of each week
month - displays the schedule date that was in place at the end of each month
quarter - displays the schedule date that was in place at the end of each quarter
The availability of a date for plotting depends on execution of the Progressing Engine within the specified time interval. Customers executing the Progressing Engine once per month will not be able to view data at the week level; of granularity.
For projects of a long duration using the week time slicing can result in overlapping text on the X axis label and therefore monthly time slicing is recommended.
Milestones:
This parameter allows the selection of values to include/filter the milestones that are displayed in the report. The attribute used for filtering is controlled by your Administrator.
Chart Data By:
This parameter determines if a chart is displayed for each project within the portfolio, or a single chart plotting all milestones for the projects within the portfolio.
Options for selection are:
Outcome - one chart per Product/Asset/Application is displayed
Outcome Portfolio - a single chart is displayed, displaying all relevant milestones for projects associated with the outcomes on the portfolio.
It is important to consider the volume of data and subsequent readability issues that can result from using the Chart Data By Portfolio option. This option may only be appropriate for a small portfolio of related projects where milestones are being filter down.