
Manage Environment – KPIs Dashboard
Environment KPIs Dashboard allows users to track key metrics across Environments.
TIP
Ask Release & Verify's Support to make the Environment KPIs Dashboard appear in your navigation menu

Location
To locate the Environment KPIs Dashboard:
- Request Release & Verify's Support to add Environment KPIs Dashboard to your navigation menu.
- Go to Environment > Environment KPIs.
Layout
The Environment KPIs Dashboard displays the following:
- Date Filters:

- Set the start date (left) and end date (right).
- Other Filters:

- The left sidebar of the Environment KPIs Dashboard allows the user to filter the data in the rest of the dashboard by:
- Portfolio:
- Select by Portfolio Association.
- Systems:
- Select by System.
- Environment Group:
- Select by Environment Group.
- Environment:
- Select by Environment.
- TECR Status:
- Select by TECR Status.
- TEBR Status:
- Select by TEBR Status.
- Booking Status:
- Select by booking status.
- Portfolio:
- The left sidebar of the Environment KPIs Dashboard allows the user to filter the data in the rest of the dashboard by:
- Widgets:
- Each widget shows a different KPI, including:
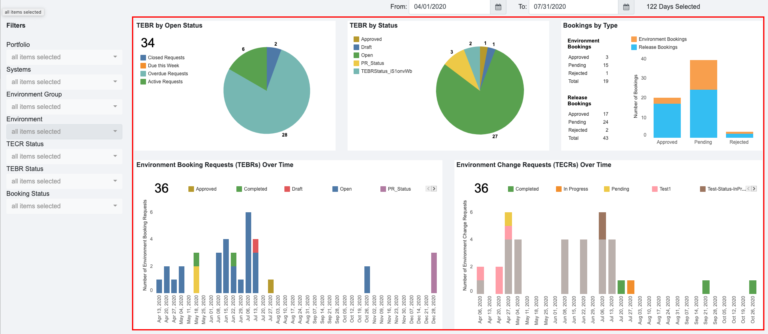
- TEBR by Open Status:
- Statuses are Active, Overdue, Due This Week, and Closed based on the End Date/Time.
- Open requests are Active + Overdue.
- The total (34 in the screenshot above) is the number of Open requests.
- TEBR by Status:
- Data from the TEBR Status Customization.
- Bookings by Type:
- Approved, Pending, or Rejected bookings showing the count of Environment Bookings (TEBRs without a Release) and Release Bookings (TEBRs with a Release or Environments booked in an Enterprise, Project, or Independent Release).
- Environment Booking Requests (TEBRs) Over Time:
- TEBRs with a duration that falls within the selected dates.
- The TEBR Status of those TEBRs is displayed by color.
- Click + or – to see the data monthly, quarterly, or yearly.
- Environment Change Requests (TECRs) Over Time:
- TECRs with a duration that falls within the selected dates.
- The TECR Status of those TECRs is displayed by color.
- Click + or – to see the data monthly, quarterly, or yearly.
- Environments by Portfolio:
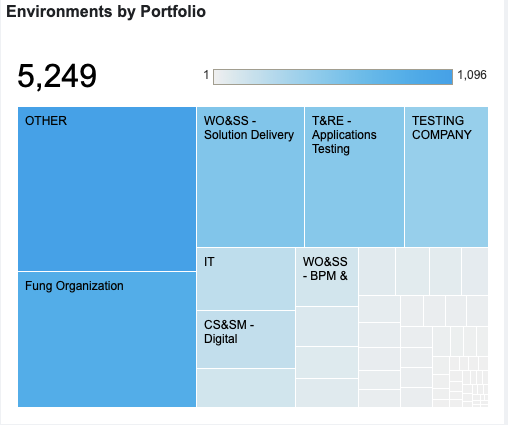
- A tree map showing Portfolio Associations associated with Environments.
- The total (5,249 in the screenshot above) is the number of Environments in the application.
- The gradient bar shows the number of Portfolio Associations represented by the color of each square, the darker the color, the larger the number.
- Click or hover over on each square to see the number of Environments in that Portfolio Association.
- Environment Utilization:

- The utilization for each Environment across the selected dates.
- Based on the number of hours each Environment can be booked for the selected dates, versus the actual hours booked.
- Blue is booked and gray is idle. Percentages for each are shown.
- Environment Conflicts:

- Environments or Environment groups are listed, with the TEBR or Release they are booked with.
- In the timeline, the blue bars represent the conflicts.
- TEBR by Open Status:
- Click on the sections of each widget graph to display a breakdown of the data in that section. Click again to display all the data.

- Each widget shows a different KPI, including:
