
Manage Deployment – KPIs Dashboard
Deployment KPIs Dashboard allows users to track key metrics across Deployment Plans.
TIP
Ask Release & Verify's Support to make the Deployment KPIs Dashboard appear in your navigation menu.

Location
To locate the Deployment KPIs Dashboard:
- Request Release & Verify's Support to add Deployment KPIs Dashboard to your navigation menu.
- Go to Deployment > Deployment KPIs.
Layout
The Deployment KPIs Dashboard displays the following:
- Date Filters:

- Set the start date (left) and end date (right).
- Other Filters:
- The left sidebar of the Deployment KPIs Dashboard allows the user to filter the data in the rest of the dashboard by:
- Portfolio:
- Select by Portfolio Association.
- Release Name:
- Select by Release Name.
- Deployment Plan:
- Select by Deployment Plan.
- Environment:
- Select by Environment.
- Activity Set:
- Select by Deployment Plan Activity Set.
- Deployment Activity Status:
- Select by Deployment Activity Status.
- Portfolio:
- The left sidebar of the Deployment KPIs Dashboard allows the user to filter the data in the rest of the dashboard by:
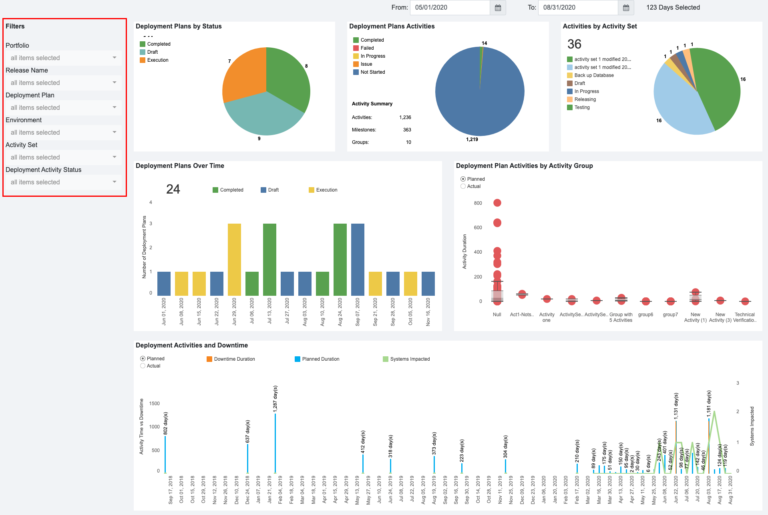
- Widgets:

- Each widget shows a different KPI, including:
- Deployment Plans by Status:
- Statuses (or Modes) are Completed, Draft, Approved, and Execution.
- Deployment Plans Activities:
- Deployment Plan Activities statuses are Not Started, In Progress, Issue, Failed, and Completed.
- Groups are Activity Groups.
- Activities by Activity Set:
- The Activity Sets from all filtered Master Deployment Plans.
- This widget will be empty if there are no filtered Master Deployment Plans.
- Deployment Plans Over Time:
- Deployment Plans with Activities that have a duration falling within the selected dates.
- The Deployment Plan Status (or Mode) is displayed by color.
- Click + or – to see the data daily, weekly, monthly, quarterly, or yearly.
- Deployment Plan Activities by Activity Group:
- A box and whisker plot showing Deployment Plan Activities with a duration that falls within the selected dates, organized by Activity Group.
- The data is displayed as:
- Upper Whisker: The upper extreme of the data.
- Upper Hinge (top box): The upper quartile or Q1.
- Median (the line between the boxes): Data median.
- Lower Hinge (lower box): The lower quartile or Q3.
- Lower Whisker: The lower extreme of the data.
- Deployment Plan Activities that lack an Activity Group are placed in the Null group.
- Filter by the widget radio buttons:
- Planned: Planned deployment dates.
- Actual: Actual deployment dates once the Activities are completed.
- Deployment Activities and Downtime:
- Deployment Plan Activity Downtimes.
- Filter by the widget radio buttons:
- Planned: Planned deployment dates.
- Actual: Actual deployment dates once the Activities are completed.
- The right-hand Y axis and green line show the number of Systems associated with the filtered Deployment Plans.
- Click + or – to see the data daily, weekly, monthly, quarterly, or yearly.
- Deployment Plans by Status:
- Click on the sections of each widget graph to display a breakdown of the data in that section. Click again to display all the data.

- Each widget shows a different KPI, including:
