
WRK02 - Work Portfolio Balance
- WRK01 - Project Pipeline Matrix
- WRK02 - Work Portfolio Balance
- WRK03 - Project Health Trend Analysis
- WRK04 – Project Financial Health
- WRK05 - Schedule and Effort Variance
- WRK06 - Work Effort Analysis (Scheduled and Actual)
- WRK12 - Project Health
- WRK15 - Milestone Status
- WRK17 - Portfolio Gantt Chart
- WRK24 - Project Scheduled Effort Detail
- WRK25 - Project Timesheets Monthly Summary
- WRK26 - Project Timesheets Weekly Detail
- WRK28 - Project/Portfolio Scheduled vs Actual Effort Analysis
- WRK28 - Project/Portfolio Scheduled vs Actual Effort Analysis (Administration)
- WRK29 - Resource Utilization
- WRK29 - Resource Utilization (Administration)
- WRK35 - Milestone Trend Analysis
- WRK35 - Milestone Trend Analysis (Administration)
Project Plan Management: For More Information
step 2 of 18
- Last updated
- Save as PDF
Overview
Project or work portfolio based report that provides project count analysis of projects in the portfolio by a primary and secondary work attribute.
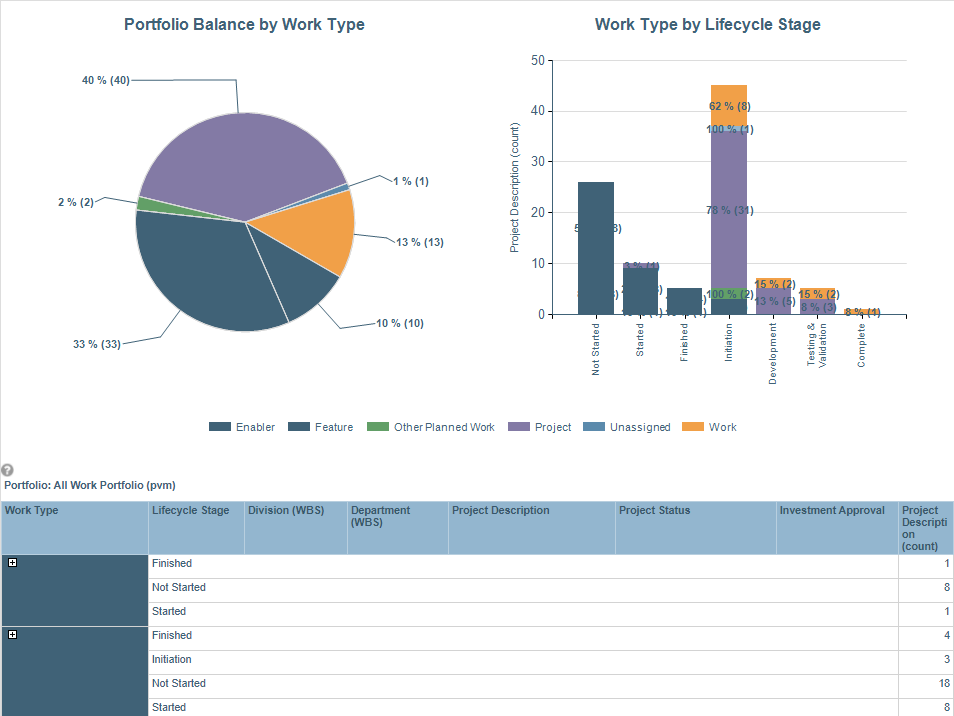
WRK02 example
Business Outcomes
- Drive data quality through data auditing
- Ensure a balanced portfolio by identifying when a portfolio is disproportionately balanced, based on dynamically selectable attributes
- Identify where adjustments should be made to portfolios, based upon shifting organizational priorities
Supporting Capabilities
- Project Monitoring and Status
- Project Planning and Scheduling
- Analysis and Prioritization
User Parameter Configuration (for Administrators)
| Parameters | Description | Configuration Options | Default/Example Settings |
| Primary Attribute (Pie Attribute) | The primary attribute to use for the pie and the stacked bars | This can be any work, single select alternates structure that has been enabled to be “Available in Analyze Charts” (set in Attribute properties) or any level of the work primary structure. The Pie Attribute parameter selection will determine the default primary (pie chart) attribute that is selected when the report is executed. This should be set to a key attribute. The charts colors will be based on the attribute charting options for the selected alternate structure. |
pie_attribute=wbs22_plan |
| Bar Chart Grouping | Attribute to use for the X axis in the bar chart | Any work single-select work alternate structure that has been enabled in Attribute properties to be “Available in Analyze Charts”. The Bar Category entry will determine the default bar chart stack attribute that is selected when the dashboard and report open. Set this to a key attribute. |
bar_category=wbs28_plan |
Hidden Parameter Configuration (for Administrators)
| Parameters | Description | Configuration Options | Default/Example Settings |
| Table Columns | The selected primary attribute and grouping attribute in the parameter selection will automatically be displayed as the first two columns in the table. The values in the config structure define the two columns before project name, and two columns after project name |
Two columns are available before the project name. It is recommended that WBS parent levels are used in these columns. Two columns are available after the project name. It is recommended to use key status and/or responsibility attributes. |
wbs_level_3_plan wbs_level_4_plan wbs20_plan wbs28_plan |
| Report Title | Configurable report title that appears at the top of the report. | If a longer report title is required, create additional report_title=xxx entries. These will be concatenated together based on the order in which they are listed in the configuration structure. | report_title=Portfolio Balance - Project Count |
Technical Database Information
| Report (RDL) Location | …/Reports/FastTrack/Mixed_Use/CHART02-PortfolioBalance/CHART02.rdl |
| Database | This report uses the transactional database and updates will be real-time. |