
FastTrack Analytics - Managing Chart and Attribute Colors in Reports
| Default Color Palette |
|---|
| ☑ Added in RPM Analytics 2.2. The default color palette is configurable for all FastTrack reports in the "Global Defaults" branch of the FastTrack Report Configuration (RpmCfg) alternate structure- this is generally set to: "color_palette=Planview" (see below).
These colors are used, in order, by charts when a custom color palette is not assigned to a report or when a color is not explicitly assigned to the category/slicer/dimension. Colors can be assigned to alternate structure values only using the "Charting" link available on the Alternate Structure administration page. If the "Planview" color palette has not been activated, the default color palette will be Microsoft's "BrightPastel". The color palette configuration value can be updated to any of the standard Microsoft color palette names, or alternatively any number of custom color palettes can be configured and used globally or for specific reports. |

| Adding a Custom Color Palette |
|---|
|
☑ Added in RPM Analytics 2.2. Multiple custom color palettes can be configured, and can be applied to specific reports as a global default override. The process for adding a custom color palette is detailed below:
|
| Applying Custom Color Palettes to Reports |
|---|
|
Note: Applying a custom color palette will only affect report charts (not table cell background colors etc. - see below for further details on how to apply specific attribute colors to alternate structure / report table columns). To apply a custom color palette to a report:
|
|
|
|
| Applying Specific Attribute Colors - Alternate Structures |
|---|
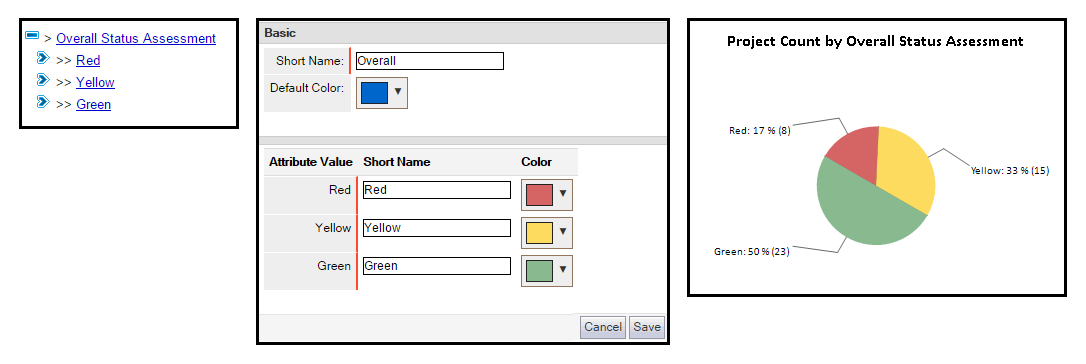
| For alternate structures the default palette can be overwritten by using the attribute charting color configuration. The example below shows how you might use this is to force specific values to show with logical colors. In Planview Enterprise 11.5 the range of colors was extended to include the corporate color palette and also to allow the entry of a specific HEX code value. |
| Attribute: Overall Status Assessment | Charting Colors Assigned to Attribute Values | Charting Colors Appear in Report Output |
 |
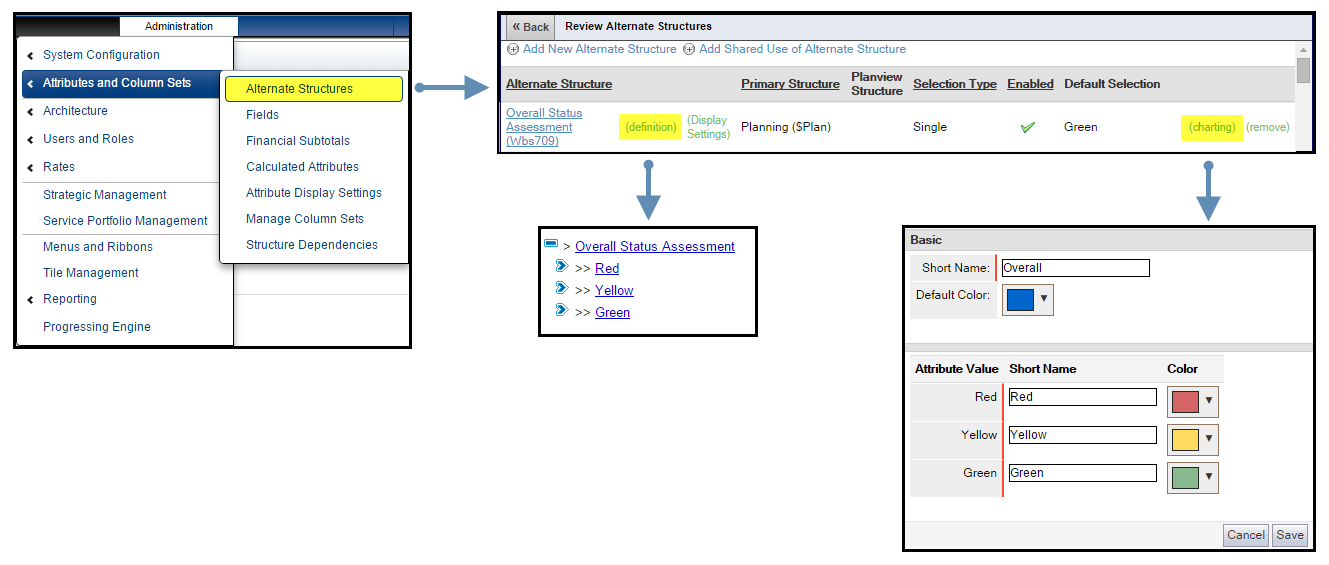
| Assigning Charting Colors to an Attribute |
|---|
| Administration > Attributes and Column Sets > Alternate Structures | Select 'Charting' against the structure you wish to assign colors | Select Charting Colors |
 |
| Applying Specific Attribute Colors - Alternate Structures Used as Table Columns |
|---|
Alternate structures displayed in table columns can be configured to display with the column background and/or text using the color defined in the Display Settings. This is done by modifying the table column configuration entry;
For additional information refer to the Managing and Formatting Attributes topic. |
| Controlling Other Colors Used in Reports |
|---|
| The FastTrack Analytics utilize colors to visualize data types and conditions, Examples include: effort types (actual, allocation, reserve, requirement), and timesheet statuses (approved, overdue, disapproved, etc.). ☑ Added in RPM Analytics 2.2. Configuration entries in the Global Defaults area of the FastTrack Configuration structure are used to control these colors. Default values are added through the installation process. For further detail on the different color controls options refer to the Global Defaults topic. |