
AST41 - Asset Process Analysis - Lifecycle Stage
| RPM Analytics Catalog ▲ | RPM Assets Analytics ▲ | RPM Analytic AST41 ▼ |
|---|
| Overview |
|---|
Process control analytic that can be used to measure and monitor governance processes and to drive improvements in process cycle times. This asset portfolio report analyzes the Asset Lifecycle Stage attribute, providing insight into;
Through the monitoring of a process, bottlenecks and process inefficiencies can be identified and this information used to target and deliver improvements in process. |
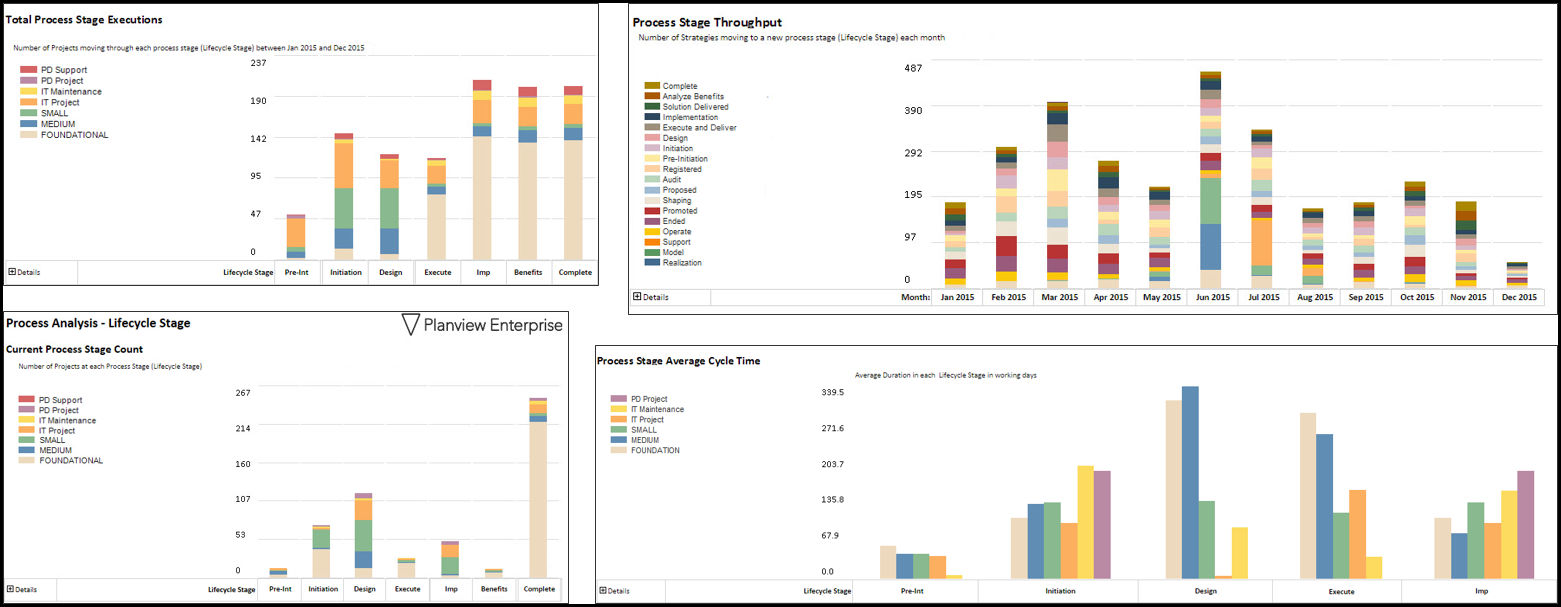
NOTE – Screenshots show the equivalent work based report
| Business Outcomes | Supporting Capabilities |
|---|---|
|
|
| Report Detail |
|---|
| See WRK41 - Project Process Analysis - Lifecycle Stage for more extensive report detail information |
| User Parameter Configuration (Information for Planview Administrators) | |||
|---|---|---|---|
| Parameters | Description | Configuration Options | Default/Example Settings |
| Report View | Determines the default view of the report. | A value of 0 (Dashboard) will show the charts but will collapse all the details. A value of 1 (Chart + Summary) will expand the summaries but keep the details collapsed. A value of 2 (Chart + Details) will render a fully expanded report. The “Dashboard” selection (report_view=0) will also hide the detail table. | report_view=0 |
| Table Format | Defines how the detail table at the bottom is formatted | The value “sectiongroup” renders a table with grouping, whereas “plain” renders a table that’s good for analysis in Excel. Neither of these apply when the report view is “Dashboard” because the table is hidden. | table_format=sectiongroup |
| Range start | This parameter determines the start of the range of dates that are preselected | The value represents the number of months from the current month. So a value of zero (0) represents the current month. A value of -11 would be 12 months ago. | horizon_start=-11 |
| Range end | This parameter determines the Finish of the range of dates that are preselected | The value represents the number of months from the current month. So a value of zero (0) represents the current month. A value of -11 would be 12 months ago. | horizon_finish=0 |
| Attribute for Grouping | Attribute used for slicing in the report | Only alternate structure attributes in the framework, marked as analyzable and that have charting colors assigned can be used for slicing in the report. | slicer=asst701_asset |
| Hidden Parameter Configuration (Information for Planview Administrators) | |||
|---|---|---|---|
| Parameters | Description | Configuration Options | Default/Example Settings |
| Table Columns | Report supports 3 required/grouped columns plus 3 optional columns. | First three configurable values display grouped columns | abs_level_2_asset abs_level_3_asset asst1_asset |
| Analyze attribute | Attribute for which process cycle times are being measured. | analyze_attribute=asst5_asset | |
| Filtered Attribute | Configured value defines structure codes of analyzable attribute values (leaf entries) that are to be included in the analysis. | Multiple entries are expected; one for each value to be included. A blank entry means all values are analyzed | The default configuration is a single, blank entry |
| Report Title | Configurable report title that appears at the top of the report. | If a longer report title is required, then create additional report_title=xxx entries and these will be concatenated together based on the order in which they are listed in the configuration structure. | report_title=Lifecycle Stage Process Analysis |
| Additional Information |
|---|
| The short names associated with charting colors for the attribute of lifecycle role drives the abbreviated value used in the charts. |
| Technical/Database Information | |
|---|---|
| Report (RDL) Location | …/Reports/RPM_PROD/Asset_RPM/RPM-AST41/RPM-AST41_v2.rd |
| Database | This report uses the transactional database and updates will be real-time. |
| Report Developer Info: | RPM-AST41_v2 RDL is a derivative of the PROCESS01 RDL |