
Assets and Applications
| ID | Description | Preview | Type |
|---|---|---|---|
| AST01 | Application/Asset Portfolio Details Application portfolio analytic that summarizes key data points relating to IT Applications and Assets. The report can be configured to show specific attributes, fields, dates and financial plan measures associated with application or asset. |
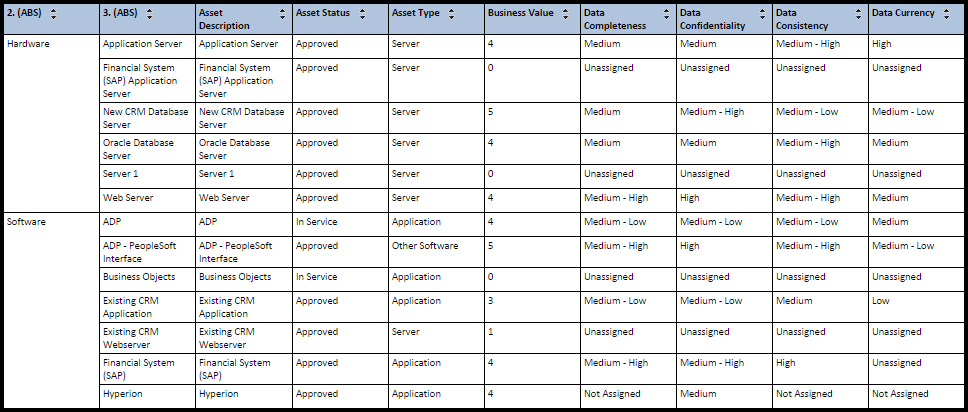 |
Report |
| AST02 | Application/Asset Portfolio Balance Provides count of the applications in a portfolio, allowing analysis by a primary and secondary attribute. |
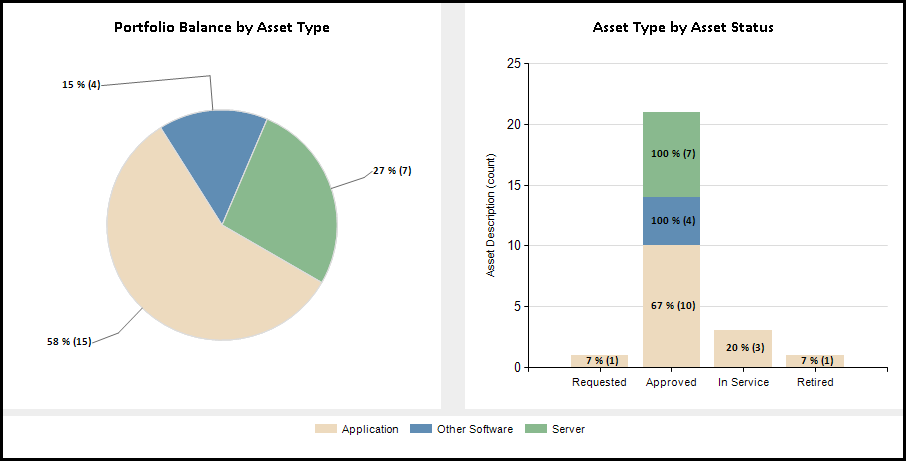 |
Report |
| AST03 | Application/Asset Portfolio Prioritization Matrix Bubble chart that allows Prioritization, cost and effort measures be plotted against application status dimensions (such as application lifecycle stage and business value providing a value vs. cost visualization of the portfolio. |
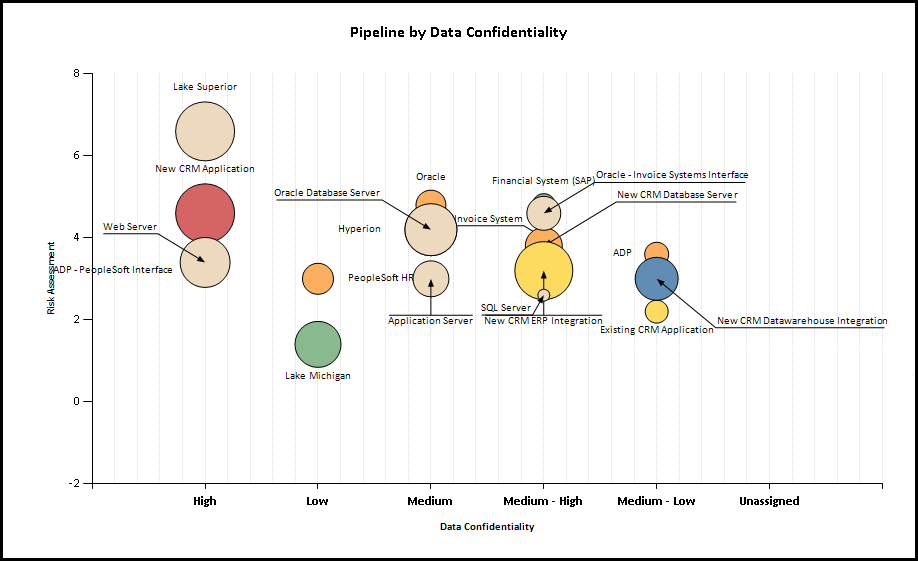 |
Report |
| AST04 | Application/Asset Financial Health Based on an approved financial baseline and the current forecast to complete, this exception based analytic identifies assets that are financially out of tolerance and are forecasting an over or under run on approved baseline budget. |
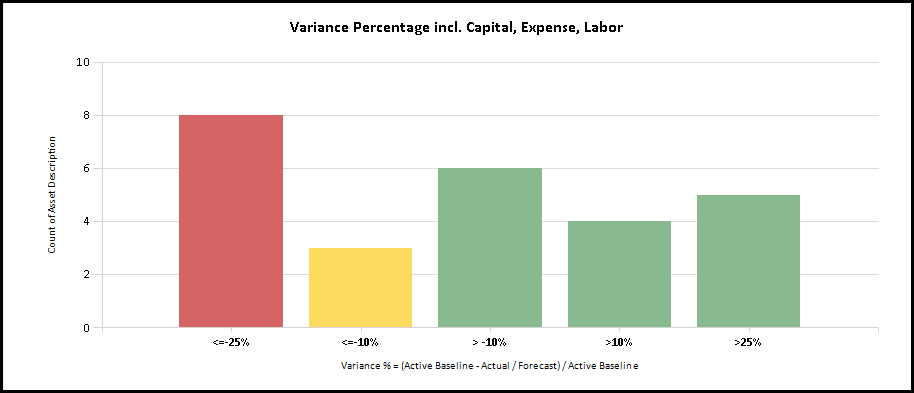 |
Report |
| AST31 | Application/Asset Portfolio Cost Analysis Application portfolio report that allows the analysis of application and summarized portfolio financial plan data, including effort (FTEs/Days/Hours) or financial data (Cost/Benefit/Revenue). A single financial planning version is selected and the data type selected based on type and/or specific accounts(s). The slicer can be any strategy alternate structure or a line attribute of the selected accounts. |
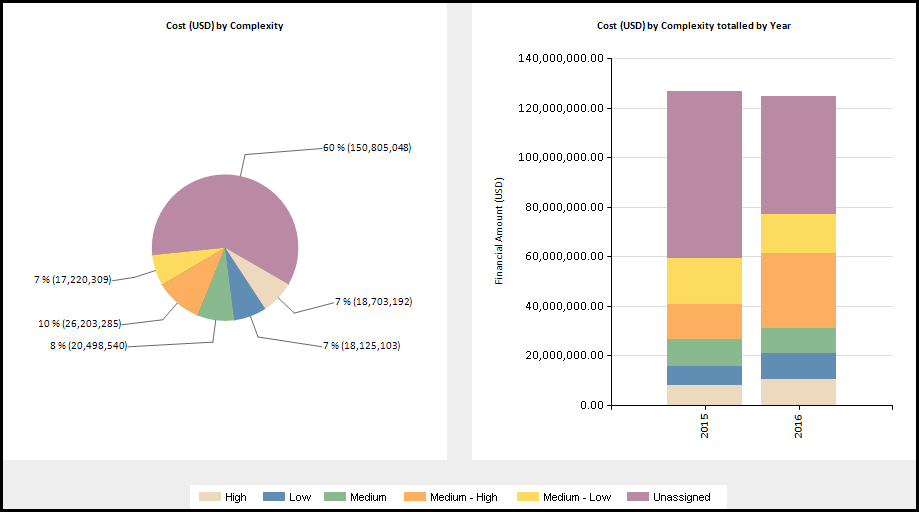 |
Report |
| AST32 | Application/Asset Portfolio Cost Forecast Comparison Application portfolio report that allows the comparison of one/many versions of application and summarized portfolio financial plan data, including effort (FTEs/Days/Hours) or financial data (Cost/Revenue). Includes a burn down chart for the whole portfolio and for each application. |
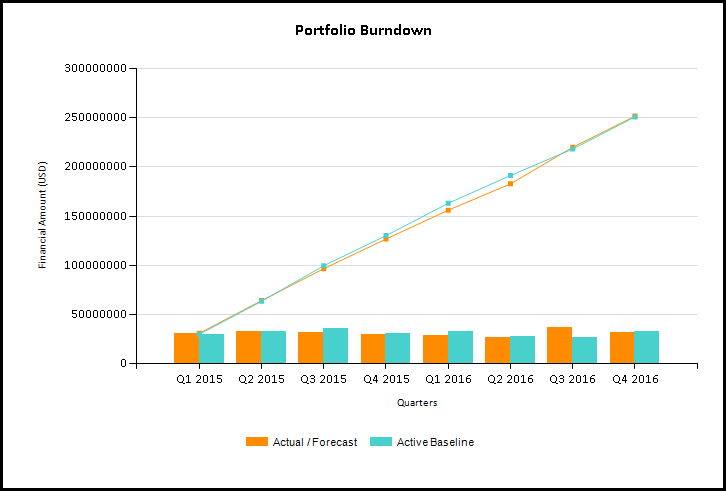 |
Report |
| AST33 | Application/Asset Portfolio Business Value Cost Matrix Application portfolio report that can select cost or revenue based measures from the financial planning data to drive bubble size and visualize the pipeline of applications. |
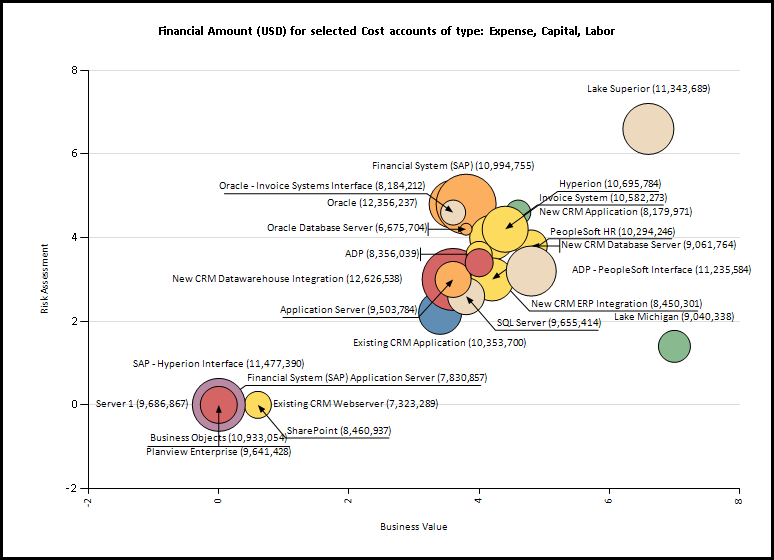 |
Report |
| AST41 | Application/Asset Process Analysis - Lifecycle Stage An application portfolio report showing data on application lifecycles to aid analysis of throughput, volume and cycle time for the application lifecycle process. Allows further analysis based on application attributes. |
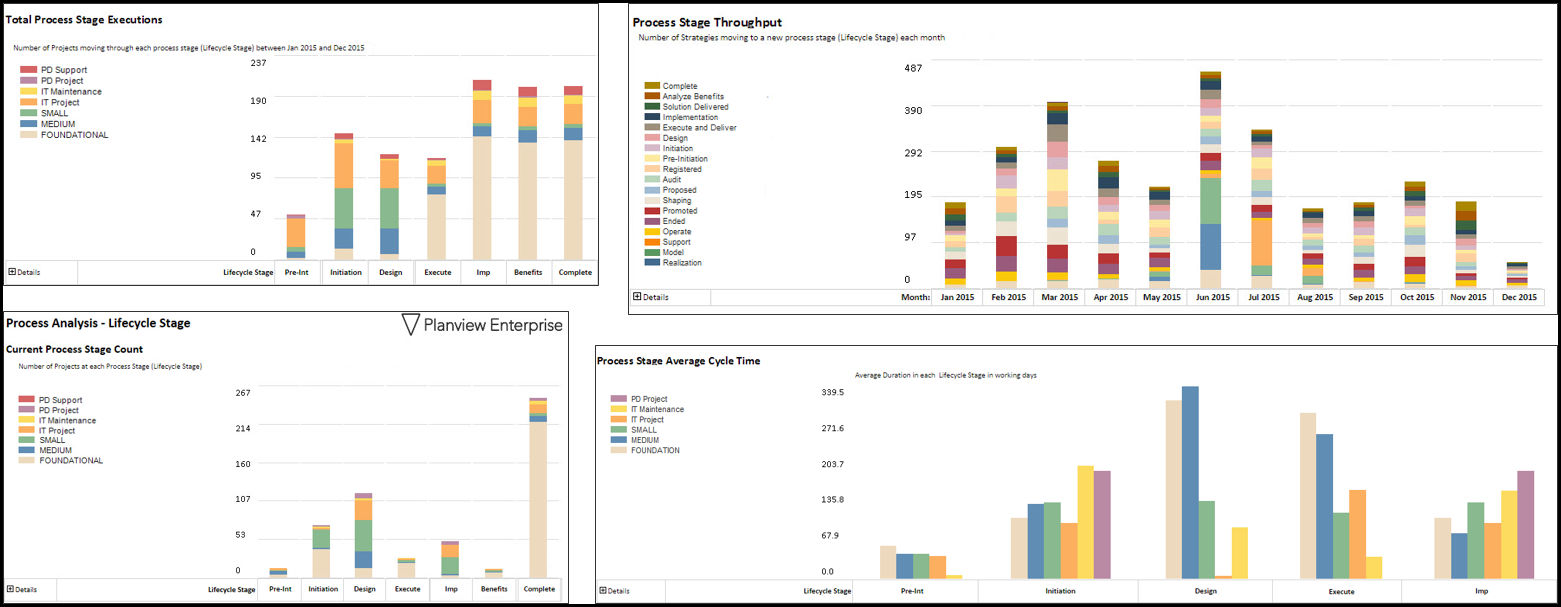 NOTE – Screenshots show the equivalent work based report |
Report |
| AST42 | Application/Asset Disposition Process Analysis An application portfolio report analyzing changes in application disposition status to aid analysis on throughput, volume and cycle time. Allows further analysis based on application attributes. |
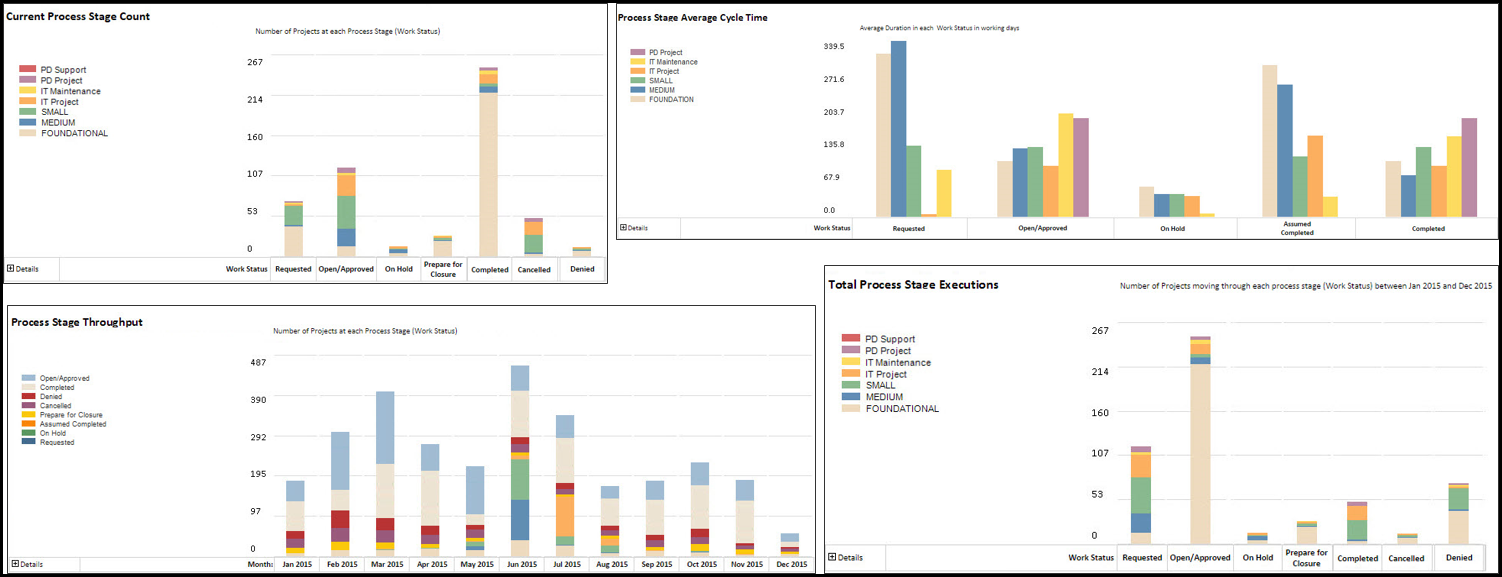 NOTE – Screenshots show the equivalent work based report |
Report |
| AST53 | Application/Asset Portfolio Balance Dashboard An application portfolio dashboard providing a count of applications in the portfolio based on different application attributes to aid analysis on portfolio balance. |
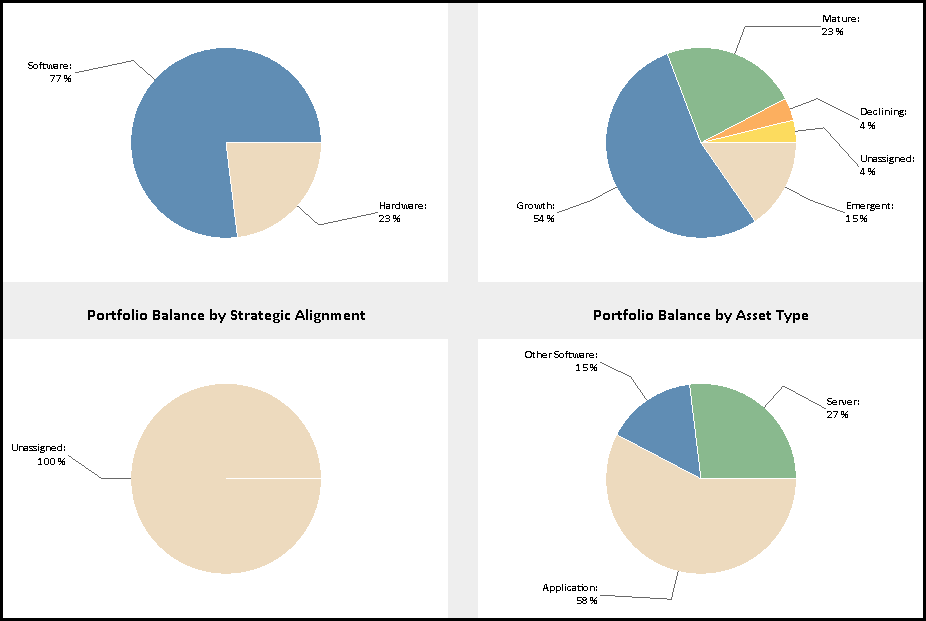 |
Report |
| AST54 | Application/Asset Portfolio Dashboard An application/asset portfolio report comparing data on portfolio measures, such as cost and effort to aid analysis on portfolio balance. Report can be run against and sliced by different application/asset attributes. |
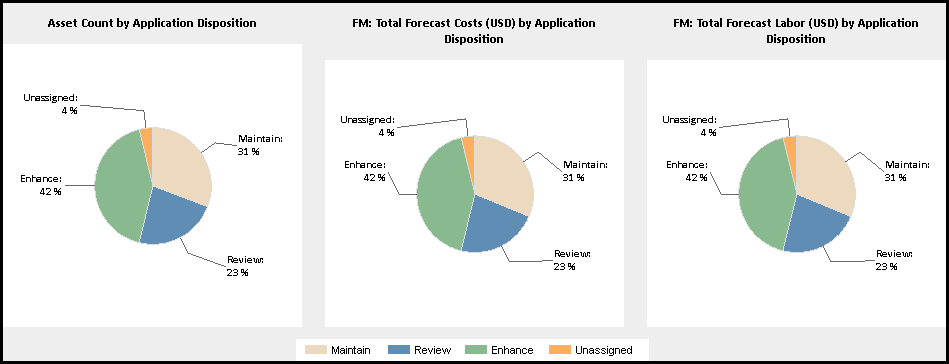 |
Report |
Please sign in to see this content.