
RPM Dashboard WRK101 - Gated Project Detail

Overview |
|---|
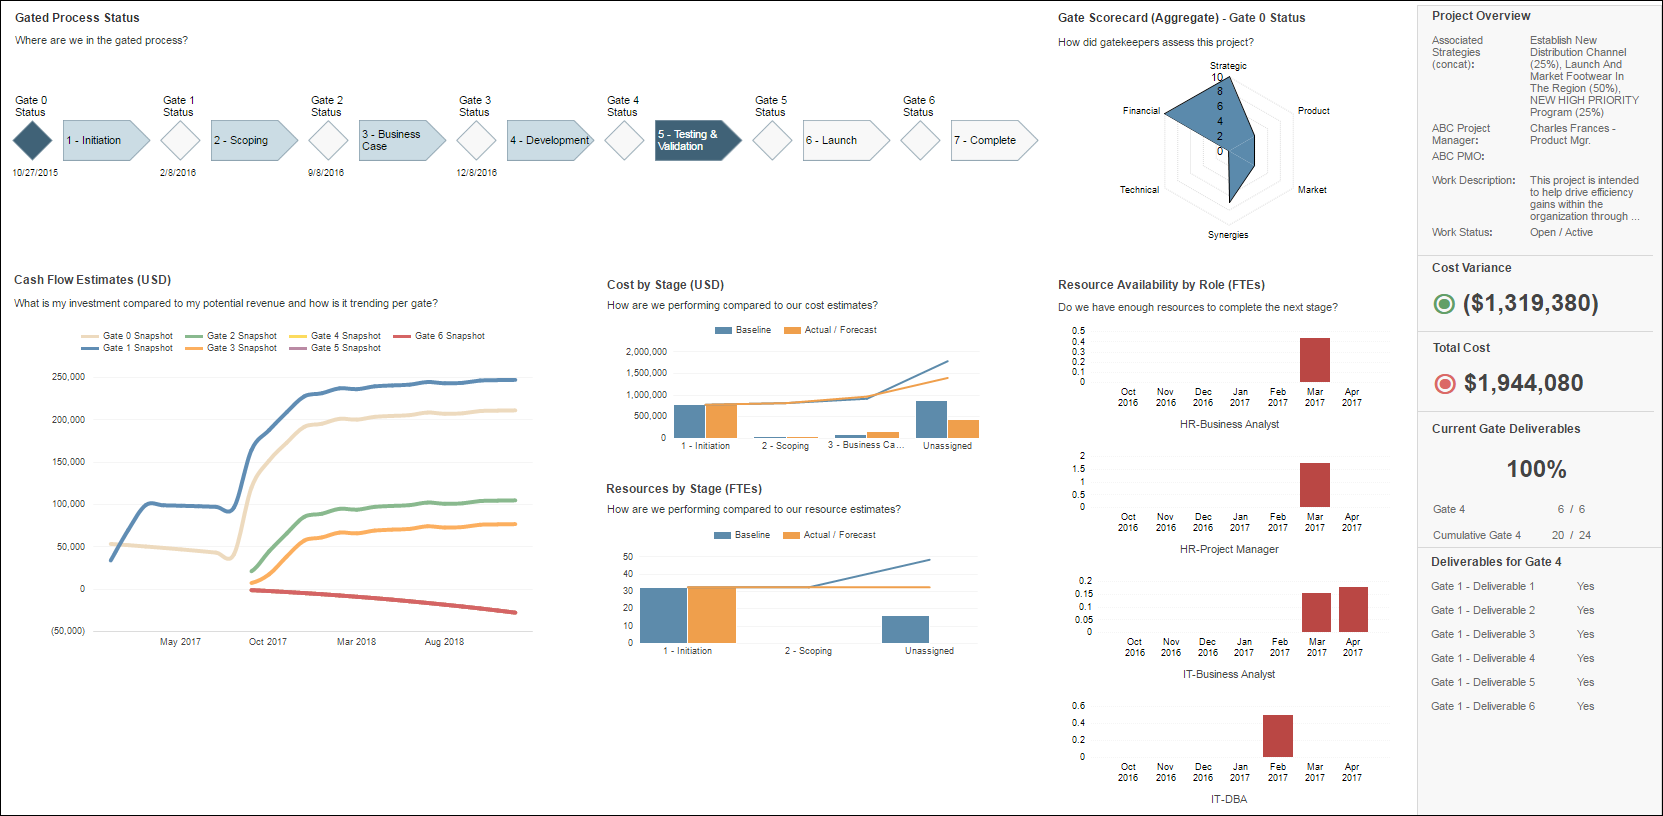
| The Gated Project dashboard provides an interactive view of project progress and performance through the organization’s stage gate process, whether for IT or Product Development. Project managers, product managers, and gate keepers can visualize and investigate status, scoring and financial performance by gate to understand progress and trends. The dashboard gives insight into resource availability to identify bottlenecks ahead of time, progress on deliverables and key performance metrics. Managers can answer questions such as:
|
| Click on a section of the example screenshot to view detail |
| Business Outcomes | Supporting Capabilities |
|---|---|
|
|
Gated Process Status Visual |
Back to Top ↑ |
|---|---|
| The Stage Gate Progress section of the dashboard visualizes the organizations delivery lifecycle and allows users to navigate to relevant associated project stage or gate information by clicking on the appropriate icon.
|
|
| Analytic Detail | |
| The project governance lifecycle is used to control and determine the stage and gate statuses. These will be mapped to mirror your organizational stage gate process. A Gate Date field is used to set the planned and/or actual dates of the project gates and appear under each of the gate diamond symbols. The Current Gate Attribute is used to manage the current gate, which will subsequently determine the default gate selection when the report is executed. This may be incremented automatically by selections made during your lifecycle process to ensure the current gate is selected by default. Active Risks will display as a red flag under the relevant stage process phase. In order for this to manifest, the attribute used to define the stages must be used shared with CRI and the risks given a value for the stage process |
|
Gate Scorecard Criteria |
Back to Top ↑ |
|---|---|
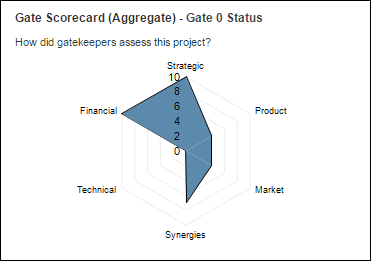
| The Current Gate Scorecard section is used to plot the project scoring assessments captured at each gate in the project lifecycle. These values are displayed in spider web visualization chart for the selected gate.
|
|
| Analytic Detail | |
| Each assessment criteria for every gate refers to one alternate structure in Planview allowing the storage of historical assessments from previous gates. The values for each assessment criteria on each gate are numerical integers populated through configured screens in the gate lifecycle process. The default assessment criteria scorings are:
|
|
Cash Flow Estimates |
Back to Top ↑ |
|---|---|
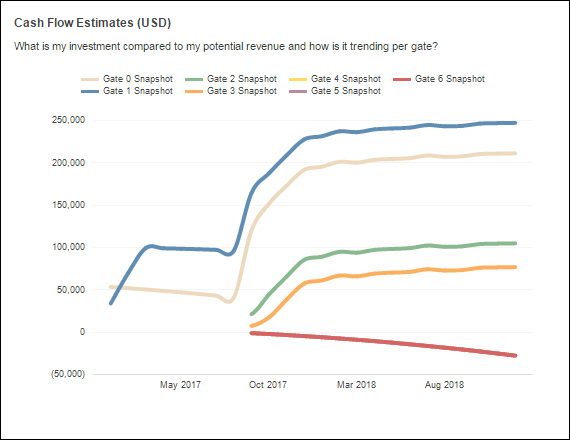
| The Cash Flow Estimates analytic shows the investment compared to the potential revenue and how it is trending by each gate in the project lifecycle.
|
|
| Analytic Detail | |
| The chart displays financial planning data from the gate snapshot financial versions captured through the various project gates. The gate financial versions are captured automatically after each Gate Go Decision as a baseline snapshot of the actual/forecast version. |
|
Cost and Resources by Stage |
Back to Top ↑ |
|---|---|
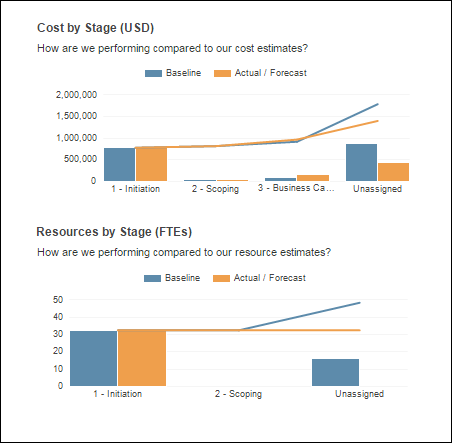
| The Cost and Resources by Stage analytic is made up of two charts comparing the actual/forecast and baseline financial planning data of the project for each gate in the lifecycle process.
|
|
| Cost by Stage The Cost by Stage chart shows the costs to deliver the project for each stage in the project lifecycle and plots the accumulative total, along side the baseline information to allow users to analyze the variance from a previous financial version. This analytic is showing data from costs and resources accounts in financial planning detail for the project sliced by the stages in the lifecycle The financial versions used for comparison in the analytic are driven by the selection of the user parameters:
This report is dependent on a number of core Planview configuration points required in conjunction to drive this analytic. Please see the configuration page to understand the core configuration dependencies of this report. |
Resources By Stage The Resources by Stage chart shows the effort to deliver the project for each stage in the project lifecycle and plots the accumulative total, along side the baseline information to allow users to analyze the variance from a previous financial version. This analytic is showing effort data from the Resource account in financial planning detail for the project sliced by the stages in the lifecycle. The financial versions used for comparison in the analytic are driven by the selection of the user parameters:
This report is dependent on a number of core Planview configuration points required in conjunction to drive this analytic. Please see the configuration page to understand the core configuration dependencies of this report. |
Resource Availability by Role |
Back to Top ↑ |
|---|---|
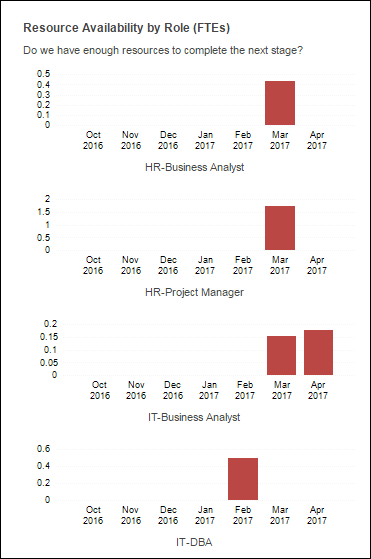
| The Resources Availability by Role Analytic shows the total Capacity (by aggregated effort, month, Quarter, Year, etc.) of the projects resources by role (org-res) and indicates the overall organizational utilization of each role in the context of their wider commitments to other work. The bar chart shows capacity, totaled for individual organizational resource roles is a sum of requirements, reserves and allocations for each time column.
|
|
| Analytic Detail | |
| This analytic will always display information looking forwards from the earliest scheduled effort on the project. This will therefore reply on progression to expire old scheduled effort appropriately. The bar charts will display color coded based on utilization, where red means the org-res is over utilized, inclusive of this project and the demand from other work commitments. The aggregated effort columns that display in this analytic is driven by the selection of the user parameter:
|
|
Project Overview |
Back to Top ↑ |
|---|---|
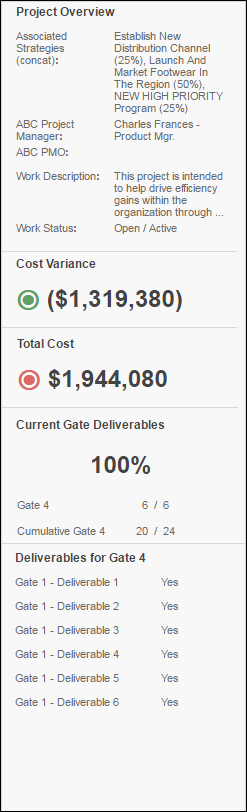
| The project overview section highlights Key Project information and performance indexes and summarizes the deliverables of the current gate. |
|
| Project Information | |
| The project information section displays key project data points of importance. The attributes can be configured by an administrator to show any important project data points, such as:
|
|
| KPIs | |
| The Key Performance Indicators highlight key effort or cost dimensions of the project from financial planning. The indicators can reference any financial planning effort or currency columns or subtotals in Planview and be configured with parameter thresholds to determine the display color of the ⦿ symbol. A typical example would include Cost Variance showing as green if it is greater than the project budget, and Red if it is less than, showing an overspend on what was originally forecast. |
|
| Deliverables Summary | |
| The deliverables section of the project overview table displays a list of the deliverables for the selected gate along with the value, a Yes / No value for determining if they are complete. These attributes are derived from a Gate Checklist screen associated with each gate, and will be automatically populated in to the project overview deliverables section along with the appropriate status value, based on the order they appear in the configured screen.
|
Report User Parameters |
|
|---|---|
| The Report should execute with default User Parameters values configured by the administrator. To change a default value, select the 'Show Parameters' Click View Report to re-run the report with the new selection. |
|
| Parameters | Description |
| Currency Code | This parameter controls the display currency of the report. The selection will show only the defined system currencies. Defaults to users currency in Financial preferences It is only possible to change currencies in a multi-currency environment. |
| Forecast Version Baseline Version |
Analytic allows selection of two FM versions that are used for calculations. Modify these parameters to compare different versions in the report output. |
| Effort Unit: | This parameter selects the Unit of measure used for effort to controls how effort is displayed in resource focused analytics. This parameter will impact the Resource Availability and Resources by Role analytics y-axis scale Options for selection are:
|
| Aggregate Effort By: | This paramer defines the time period used to slice analytics in the dashboard. This parameter will impact the x-axis scale of all time sliced analytics in the dashboard. Configuration options are
|
| Accounts | This parameter is used to specify the accounts that should be considered in the analysis. Accounts will be prefixed by their associated account type. e.g. Labor / Resources The list of values returned is customer specific depending on the financial planning configuration. |