
RPM Dashboard WRK101 - Gated Project (Administration)

| Functional Prerequisites for Using this Dashboard |
|---|
|
The Gated Project dashboard is a single project dashboard that has the following Planview Enterprise functional and data prerequisites:
It is recommended that customers seek assistance from Planview Consulting to provide assistance in preparing and deploying the essential prerequisite configuration and to apply the customer specific dashboard configuration required to enable the dashboard. For information on the configuration process refer to the FastTrack Analytics - Report Configuration topic. |
| Overall Configuration Rules |
|---|
|
The report layout is not customer configurable - all dashboard widgets must be used, specific widgets cannot be removed or moved within the dashboard. |
User Parameter Configuration (Information for Planview Administrators) |
|||
|---|---|---|---|
| Parameters | Description | Configuration Options | Default/Example Settings |
| Currency Code | Display currency | It is only possible to change currencies in a multi-currency environment. Currency selection is manual via the parameter drop down. |
Defaults to users currency in Financial preferences |
| Forecast Version | Analytic allows selection of two FM versions that are used for calculations. Parameter can be adjusted to compare different versions. |
Defaults to versions marked as forecast for the selected model (see financial model) if syntax equals zero, is empty, or no syntax entry is provided. To change the forecast version add the below syntax followed by the version ID
|
By default this parameter doesn't exist in the configure structure but can be added to override the forecast version. Until overridden, the version will default to version marked as forecast for the financial model selected. |
| Baseline Version | Analytic allows selection of two FM versions that are used for calculations. Defaults to versions marked as forecast and marked as baseline. Can be adjusted to compare to (for example) compare to a different baseline. |
Defaults to versions marked as baseline for the selected model (see financial model) if syntax equals zero, is empty, or no syntax entry is provided. To change the baseline version add the below syntax followed by the version ID
|
By default this parameter doesn't exist in the configure structure but can be added to override the baseline version. Until overridden, the version will default to version marked as baseline for the financial model select. |
| Effort Unit: | Unit of measure used for effort. This parameter is used to control how effort is displayed in resource focused analytics. |
Configuration options are
|
effort_unit=hours |
| Aggregate Effort By: | Unit of time used for time slicing. Defines the time period used to slice analytics in the dashboard. |
Configuration options are
|
breakdown_by=month |
| Accounts | Specify the accounts that should be considered in the analysis |
This is a multi select parameter, showing a list of accounts for each account type used in financial planning. Accounts will be prefixed by their associated account type. The list of values returned is customer specific depending on the financial planning configuration. Typical Values are:
|
Defaults to all selected. Manually de-select any accounts you want to ignore from analysis. |
General Parameter Configuration (Information for Planview Administrators) |
|||
|---|---|---|---|
| Parameters | Description | Configuration Options | Default/Example Settings |
| Financial Model | Ability to control the financial model used for the Financial Planning data displayed in the report. For additional information refer to the Using Financial Management Data in RPM Analytics topic |
The financial model for this report can be changed from the default work Model to a specific model ID. Model IDs are listed in the ADM01 report. model_id=Model ID |
By default this parameters doesn't exist in the configure structure but can be added to override the financial model Until overridden, the model will default to the work model. |
Gated Process Status Visual |
|---|
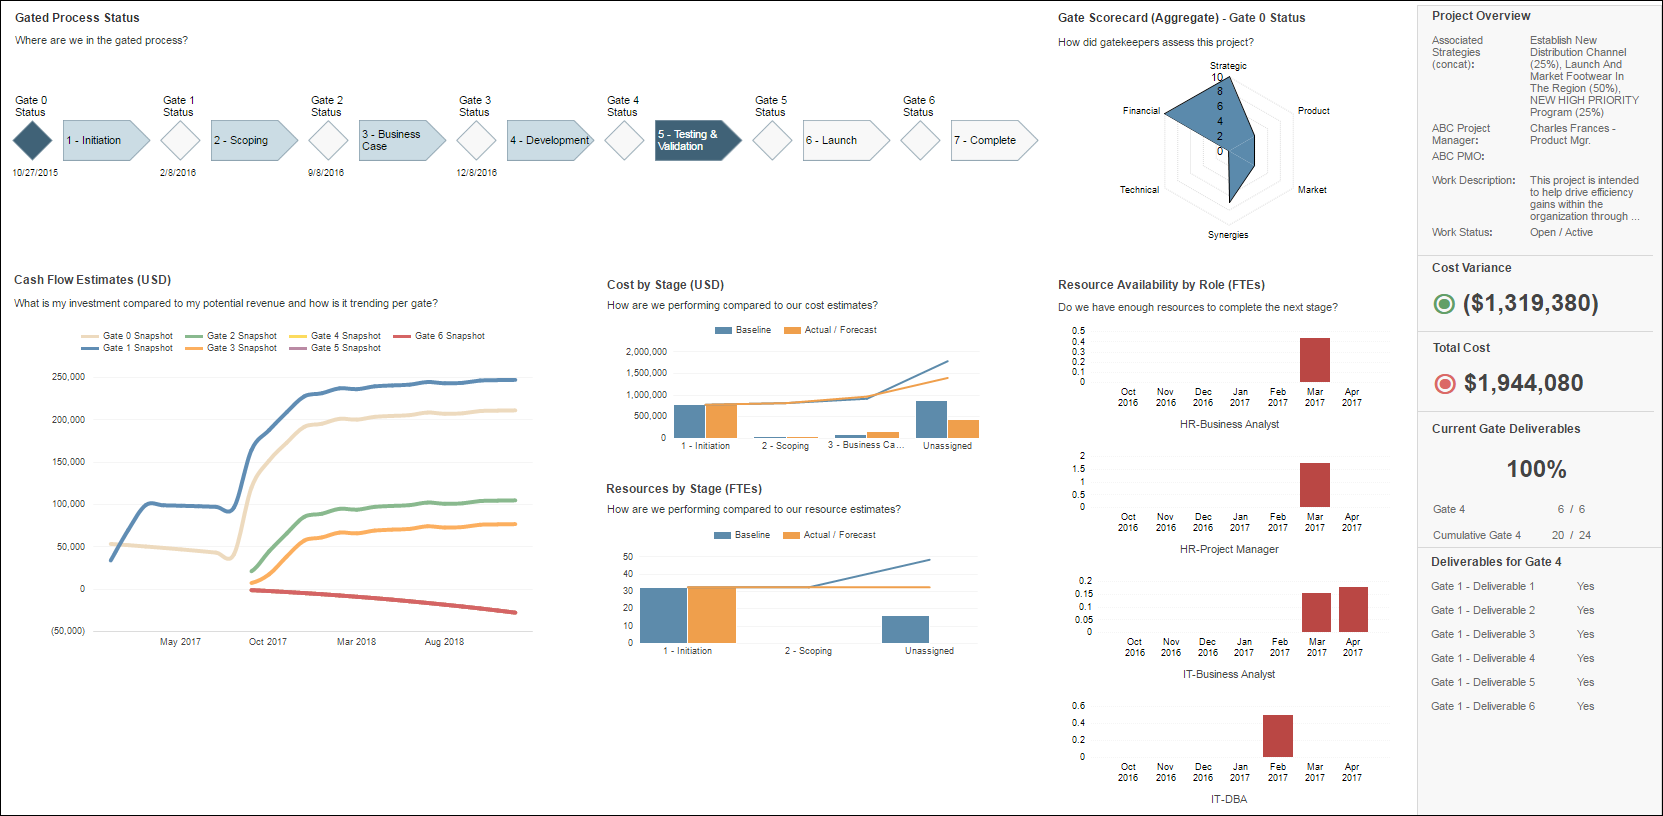
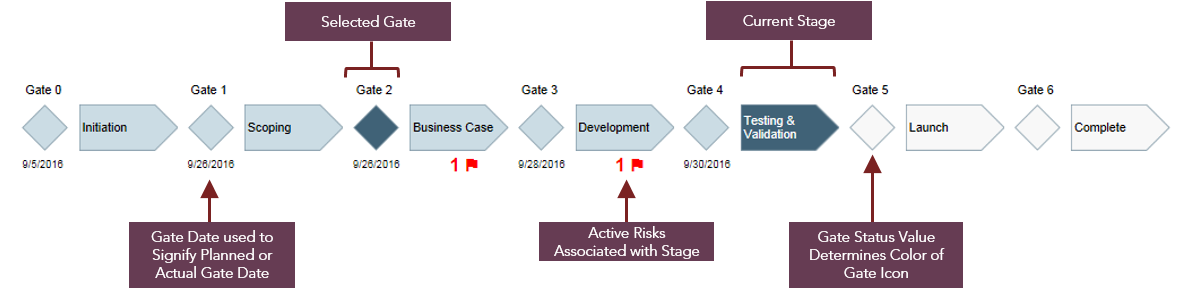
| The Stage Gate Progress section of the dashboard visualizes the organizations delivery lifecycle and allows users to navigate to relevant associated project stage or gate information by clicking on the appropriate icon.
Risks appearing on the visual is achieved by the lifecycle stage attribute alternate structure being shared on to either CRIs or risks. This should then be added to the CRI screens to allow risks to be flagged with an associated lifecycle stage. All Active Risks associated with a stage will display with a flag and a count under the visual as shown above. |
| Parameter Configuration (Information for Planview Administrators) | |||
|---|---|---|---|
| Parameters | Description | Configuration Options | Default/Example Settings |
| Lifecycle Stages Attribute | Alternate Structure used to define stages in the process lifecycle visualization. The list of values in the alternate structure used will control the labels displayed/used for each stage. The current selection of this attribute for the project will also determine the current gate marked in blue on the visualization. |
Lifecycle Stage attribute can be configured with any single select alternate structure using the syntax:
Stages will appear by place order within the structure. A maximum of 8 Stages can be added. |
The default value is:
|
| Stage Values to include | This parameter allows you to restrict the stage values (stage_attrib_ppl) that appear in the stage gate process so as not to contain every value. | If no entires exist, then all values from stage_attrib_ppl= will be included. To restrict the list of values, add a syntax for each required value using the Seq ID of each value prefixed by the below syntax:
|
By default the stage_values= parameter is blank and so all values of the stage_attrib_ppl= alternate structure will display as stages in the process visualization. |
| Current Gate Attribute | This parameter sets the alternate structure for determining the current gate of the project. The scripted dialogs executed after the gate decision screens should automatically increment this attribute to reflect the current gate.
|
Use the following syntax to set the alternate structure for the Current Gate attribute:
The Gate Index Identifier mapping will display the name of each gate in the visualization with the name of the mapped value. If a short name is defined in the charting options for the mapped structure entry value, this will be used instead to appear on the visualization. This is a recommended approach to shorten long gate names. |
A default Current Gate alternate structure is included in the RPM Showcase and Foundation databases using the example value defined:
|
| Gate Index Identifier | This parameter identifies which structure entry from the current date attribute is associated to each specific gate index eg: Gate 1 is Initiation, G2 is Design, etc. The visualization will display the name of the mapped structure entry for each gate. |
One entry for each gate can be entered using the Current Gate Attribute Structure value SEQ-ID followed by the syntax:
SEQ ID for structure values can be identified by clicking the 'Show SEQ-ID' in the top right of the structure entry screen |
The example default in the RPM showcase database includes a gate 0 so they sytaxes are as follows:
|
| Gate Status | This parameter is used to manage the status of each gate. The value of the attribute for each gate will determine the color of the gate symbol (diamond) in the process visualization |
Multiple alternate structures should be used as the attributes for gate status with each one containing the same values. It is recommended practice that the values in these attributes should be updated by scripted dialogs following gate screens. Example Showcase Default:
Use the following syntaxes to assign the alternate structures to the gate statuses.
|
Default Gate Status alternate structures are included in the RPM Showcase and Foundation databases using the example values defined, and associated with each gate using the following default configuration structure entires.
|
| Gate Date Field | Date field defined to signify the planned or actual date under each Gate in the process visualization | Gate Dates should be configured to reference a custom date field for each date that are used to signify the planned or actual date of the corresponding gate. One date field is defined for each date using the following syntaxes.
|
Default gate date fields are included in the RPM Showcase and Foundation databases and associated with each gate using the following default configuration structure entires.
|
Gate Scorecard |
|---|
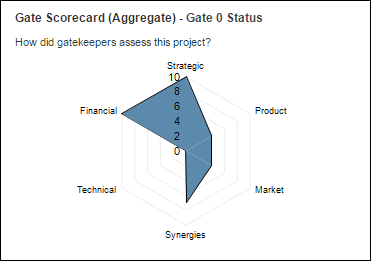
| The Current Gate Scoring section is used to plot various scoring assessments captured at each gate in the project lifecycle. These values are displayed in spider web visualization chart for the selected gate.
|
| Parameter Configuration (Information for Planview Administrators) | |||
|---|---|---|---|
| Parameters | Description | Configuration Options | Default/Example Settings |
| Assessment Criteria | Determines Criteria attributes used in Current Gate Scoring spider-web chart. Each set of scoring criteria for each gate is taken from a configured screen defined by this parameter. |
The parameters below will be set with the Screen ID from which the scoring attributes for that specific gate should be determined.
The assessment screens used must be configured so that all of the desired scoring criteria are in the left column and any other non-deliverable attributes are in the right column. A numerical scoring value must be entered under the Short Name value in the each alternate structures charting colors, this will become the value used in the chart. NB: It is possible to have alphanumerical values for the assessment criteria values as long as the short name in charting is a numerical value.
|
Our RPM showcase and Foundation databases will come with a list of premade assessment criteria screens, one for each gate which can be customized for each customer:
|
Cash Flow Estimates |
|---|
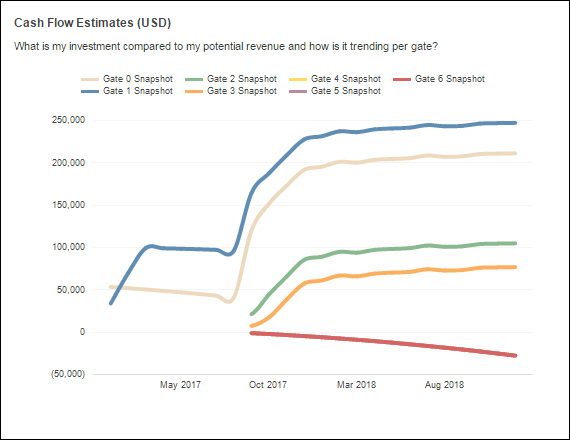
| The Cash Flow Estimates analytic shows the investment compared to the potential revenue and how it is trending by each gate in the project lifecycle.
|
| Parameter Configuration (Information for Planview Administrators) | |||
|---|---|---|---|
| Parameters | Description | Configuration Options | Default/Example Settings |
| Gate Snapshot FM Version | This parameter defines FM Versions used to drive the Cost Flow graphic. One FM version should be captured via the lifecycle after each Gate Go Decision, and subsequently associated with the gate using this parameter. The Cash flow Estimates visual will then plot the various gate FM versions for analysis. |
RPM Config structure entries determine the versions used for each gate
|
g1_ver=5 g2_ver=6 g3_ver=7 g4_ver=8 g5_ver=9 g6_ver=10 g7_ver= g8_ver= |
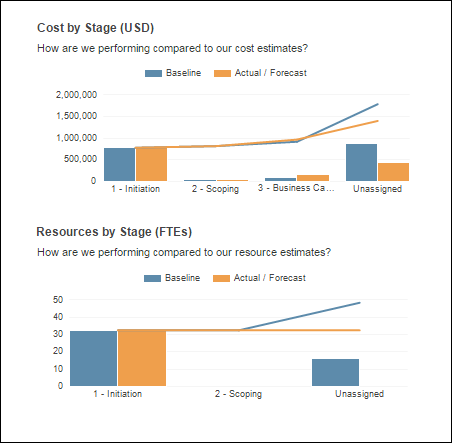
Cost and Resources by Stage |
|
|---|---|
The Baseline & Benefits vs Actual/Forecasted Costs is made up of two analytics outlining the financial health of the project for each project gate.
This analytic is showing data from costs and resources accounts in financial planning detail for the project sliced by the stages in the lifecycle The financial versions used for comparison in the analytic are driven by the selection of the user parameters:
|
| Parameter Configuration (Information for Planview Administrators) | |||
|---|---|---|---|
| Parameters | Description | Configuration Options | Default/Example Settings |
| Stages Attribute | This parameter allows the association of data below PPL with the lifecycle stages of the gated process. This allows cost and effort data from financial planning (optionally via WRM) to display in the analytics above, sliced by the stage of the gated process. This parameter is dependent on a number of core Planview configuration points required in conjunction to drive this analytic. |
The attribute used for the 'Lifecycle Stages Attribute' parameter (stage_attrib_ppl=) should be an exact match of the attribute used for the Stages attribute parameter (stage_fm_attrib=) except for one distinct difference. The attribute used for Lifecycle Stages Attribute should have 'Display Only at PPL' selected. Example default in Showcase & Foundation
Stages is used to associate a stage to information under PPL in WRM and financial planning. Planview Core Configuration Dependency
In order to associate financial plan data with the relevant stages, the Stages attribute must be added as a line detail attribute in financial planning for all Cost and Resources Accounts. Any financial planning lines that are added without association to the line detail attribute will show on the analytic under the column unassigned.
This is best achieved by adding Stages to column sets in WRM so it can be selected as a value for the appropriate lines. Loading Effort and/or expenditures will then display the costs associated with the relevant stage line detail attribute. |
Our RPM showcase and Foundation databases will include the attributes:
The Stages Attribute default will point towards the Stage Attribute using the syntax:
|
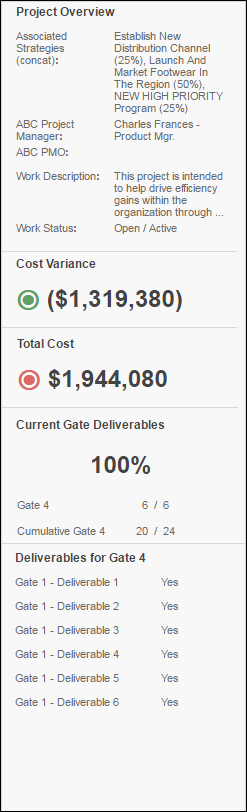
Project Overview |
|---|
| The project overview section highlights Key Project information and performance indexes and summarizes the deliverables of the current gate.
|
| Parameter Configuration (Information for Planview Administrators) | |||
|---|---|---|---|
| Parameters | Description | Configuration Options | Default/Example Settings |
| Project Information Attributes | The project information section of the Project overview widget displays key data points of the project. The attributes that can be added include:
|
The attributes will display in the order they appear in the configuration structure and will not change depending on the stage/gate selection. Prefix each attribute with the syntax:
|
po_attrib=lc_role_3_plan po_attrib=lc_role_4_plan po_attrib=wbs20_plan po_attrib=pe01 po_attrib=assoc_strategy_plan po_attrib= po_attrib= po_attrib= po_attrib= |
| Key Performance Indicators | The Key Performance Indicators highlight key effort or cost dimensions of the project from financial planning.
|
The key performance indicators can reference any financial planning effort or currency columns or subtotals in Planview using the syntaxes:
The available attribute IDs are listed in the attributes section of the ADM01 report. |
Defaults are set to reference the financial planning column Cost Variance and the RPM standard subtotals Total Costs
FV = Forecast Version |
| Key Performance Indicator Color | Selects the color of the indicator icon for each KPI dependent upon configurable thresholds Indicator Icon shown as ⦿ |
Determine the color thresholds for each KPI using the kpi1_alert= syntax followed by a mathematical relation then the corresponding color: Example syntaxes for showing a negative value as Red and a positive value as green:
|
Default values exist for cost variance but not total costs.
If no value is selected then KPI icon will show as black ⦿ regardless of its value |
| Define the list of deliverables for each stage gate | The deliverables section of the project overview table displays a list of the deliverables for the selected gate. These attributes are derived from a configured screen associated with each gate, and will automatically be populated in to this list along with the appropriate status value.
|
The parameters below will be set with the Screen ID from which the attributes for that specific gate should be determined.
The screens selected must be configured so that all of the desired deliverables are in the left column and any other non-deliverable attributes are in the right column. Screen IDs are listed in the ADM04 report. Configuration Use Cases:
By default, deliverables structures will be null (no selection). The deliverables list (and Gate and Cumulative deliverable totals) will only include the deliverables that have had a value selected (any value but null). The PM simply updates deliverables with a value and they will be added to the list.
|
Our RPM showcase and Foundation databases will come with a list of premade deliverable screens, one for each gate which can be customized for each customer.
|
| Deliverable Complete Value | This parameter determines what value for the deliverable attributes (derived from the left hand column of the configured screens defined above) count as completed in the deliverables completion progress and percentage. | This configuration parameter allows flexibility in the use of values for status for deliverables: deliverable_complete_value= A configuration example of deliverable attribute values could be:
deliverable_complete_value=Finished All attributes that match the deliverable complete value will increment the total of outcomes completed and update the percentage complete accordingly. |
Currently our RPM deliverable status value defaults are:
deliverable_complete_value=Yes All deliverables that match the deliverable complete value (have the status of Yes) will increment the total of outcomes completed and update the percentage complete accordingly. |
| Technical/Database Information | |
|---|---|
| Report (RDL) Location | …/Reports/RPM_PROD/Work_RPM/RPM_PROD/WRK101.rdl |
| Report Tile | The RDL is used in a Work Project report tile. |
| Database | This report uses the transactional database and updates will be real-time. |