
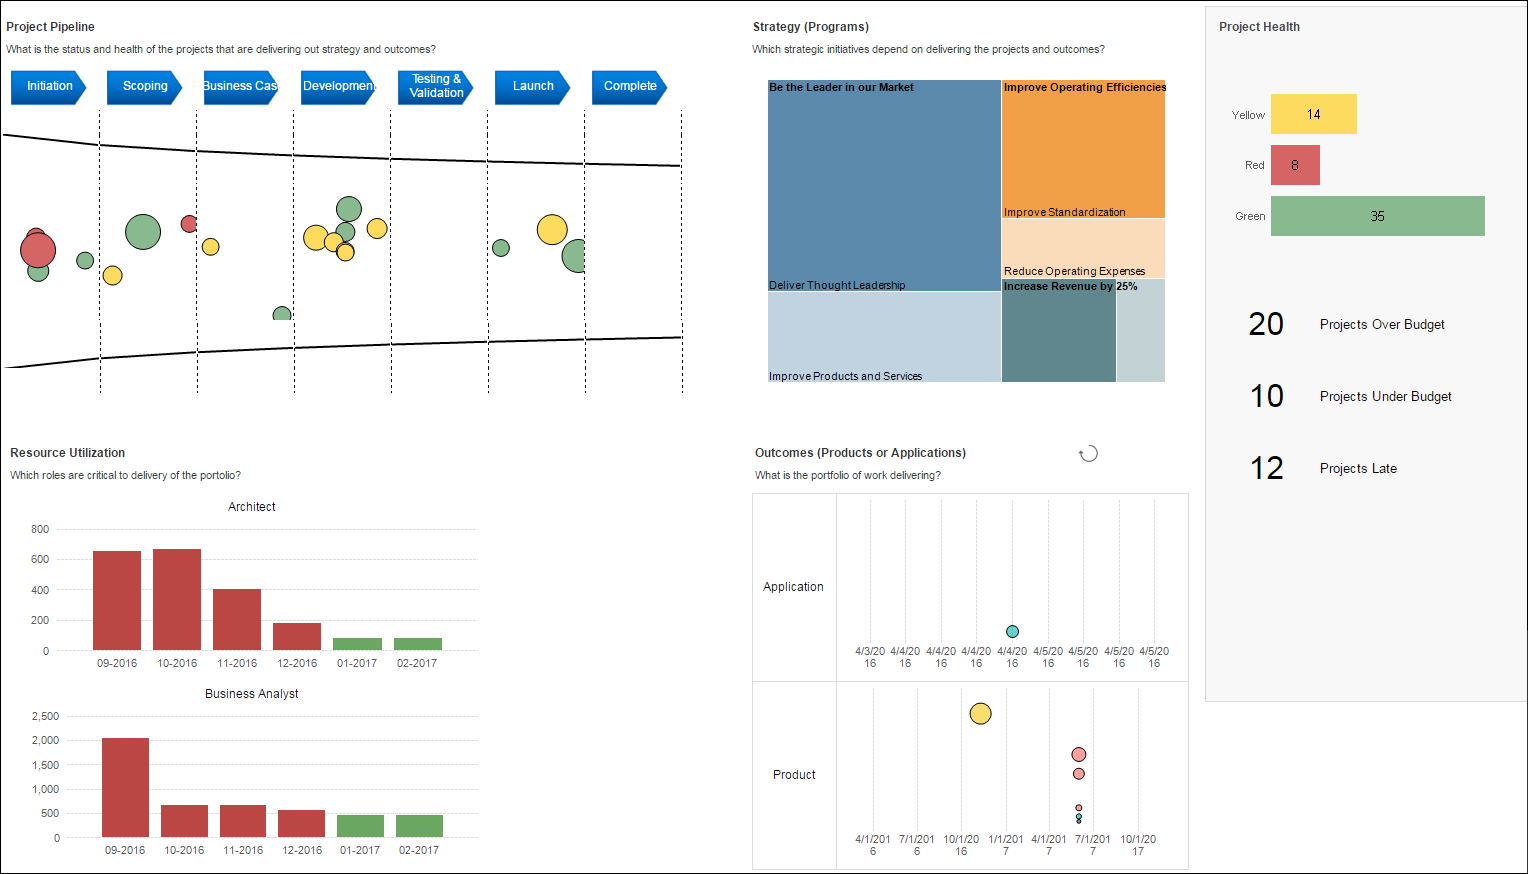
RPM Dashboard MY102 - Portfolio Performance (Administration)

Functional Prerequisites for Using this Dashboard |
|---|
|
The Portfolio Performance dashboard is a My Planview dashboard that has the following Planview Enterprise functional and data prerequisites:
It is recommended that customers seek assistance from Planview Consulting to provide assistance in preparing and deploying the essential prerequisite configuration and to apply the customer specific dashboard configuration required to enable the dashboard. For information on the configuration process refer to the RPM Analytics - Report Configuration topic. |
| Overall Configuration Rules |
|---|
| The report layout is not customer configurable - all dashboard widgets must be used, specific widgets cannot be removed or moved within the dashboard. |
User Parameter Configuration (Information for Planview Administrators) |
|||
|---|---|---|---|
| Parameters | Description | Configuration Options | Default/Example Settings |
| Aggregate Data By: | This parameter determines the period of time that financial and effort information will be broken down by in the report | Possible values are:
|
breakdown_by=month |
| Currency: | Display Currency | It is only possible to change currencies in a multi-currency environment. Currency selection is manual via the parameter drop down. |
Defaults to users currency in Financial preferences |
| Effort Unit | Unit of measure used for effort | Possible values are:
TopTip: Configuration entry will accept hour or hours. It actually just uses just the first three letters (hou, fte, day) to determine the value. |
effort_unit=hour |
| Org Res Utilization: | The list of values will contain all organizational resources | ||
| Project Health Attribute | This parameter determines the attribute used in the bar chart at the top of the project health section (grey box on the far right of the report) | Possible values are any single select work attribute in the framework with charting colors applied. Configured using the syntax:
|
proj_health_attrib=wbs709_plan |
| Financial Accounts to Include: | Specify the accounts that should be considered in the analysis |
This is a multi select parameter, showing a list of accounts for each account type used in financial planning. Accounts will be prefixed by their associated account type. The list of values returned is customer specific depending on the financial planning configuration. Typical Values are:
|
Defaults to all selected. Manually de-select any accounts you want to ignore from analysis. |
| Baseline Version | Allows selection of two FM versions that are used for FM calculations. Defaults to marked and forecast and marked as baseline. Can be adjusted to compare to (for example) compare to a different baseline. | If zero (or not provided) the marked versions from the model will be used. Values provided are the version ID. Baselines are chosen from a list of master baselines for schedule variance calculations used in dates and milestones sections. Version IDs are listed in the ADM01 report. |
bl_version_id=0 |
| Working Version | Allows selection of two FM versions that are used for FM calculations. Defaults to marked and forecast and marked as baseline. Can be adjusted to compare to (for example) compare to a different baseline. | If zero (or not provided) the marked versions from the model will be used. Values provided are the version ID. Baselines are chosen from a list of master baselines for schedule variance calculations used in dates and milestones sections. Version IDs are listed in the ADM01 report. |
fc_version_id=0 |
| Strategy Chart Color: Strategy Chart Size: |
See Strategy Treemap Section | ||
| Project Pipeline Bubble Color: Pipeline Bubble Size Pipeline Y Axis: Pipeline X-Axis: Pipeline Grouping: |
See Project Pipeline chart Section | ||
| KPI 1 Attribute: KPI 2 Attribute: KPI 3 Attribute: |
Parameters that define the attribute used for the KPIs in the project health section (grey box on the far right of the report) | This report includes report-specific derived attributes which can be set as KPI attributes using the following syntaxes.
The available attributes and their report-specific attribute IDs are:
* Attribute only available for use as KPIs |
kpi1_attrib=my102_fm_over_budget kpi2_attrib=my102_fm_under_budget kpi3_attrib=my102_bl_late_projects |
| Outcomes Color Attribute: Outcomes Bubble Size: Outcome Y-Axis |
See Outcomes bubble chart section | ||
General Parameter Configuration (Information for Planview Administrators) |
|||
|---|---|---|---|
| Parameters | Description | Configuration Options | Default/Example Settings |
| Financial Model | Ability to control the financial model used for the Financial Planning data displayed in the report. For additional information refer to the Using Financial Management Data in RPM Analytics topic |
The financial model for this report can be changed from the Model marked as default to a specific model ID. Model IDs are listed in the ADM01 report.
|
By default this parameters doesn't exist in the configure structure but can be added to override the financial model Until overridden, the model will default to the work model. |
| Number of Periods displayed | This parameter controls the maximum number of periods displayed in the report | This parameter will define the number of periods shown using the syntax
|
max_res_periods=6 |
| Report Title | Configurable report title that appears at the top of the report. | If a longer report title is required, then create additional report_title=xxx entries and these will be concatenated together based on the order in which they are listed in the configuration structure. | report_title=Portfolio Performance |
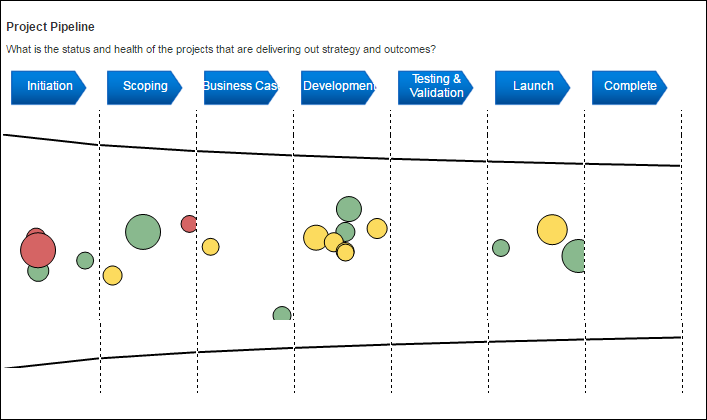
Project Pipeline Visual |
|---|
| The Project Pipeline chart shows a visualization of the pipeline demand of projects within the portfolio, broken down by lifecycle stage. Click on a stage or specific bubble to filter the report to show only things that are a part of that pipeline.
|
| Parameter Configuration (Information for Planview Administrators) | |||
|---|---|---|---|
| Parameters | Description | Configuration Options | Default/Example Settings |
| Project Pipeline Header | Parameter defines the heading text displayed at the top left of the of the Project Pipeline visual. | Configured using the syntax:
|
header_pl=Project Pipeline |
| Project Pipeline Bubble Color | Parameter defines the work attribute that sets the color for the bubbles in the visual. | Configured using the syntax:
|
pp_bubble_color=wbs709_plan |
| Pipeline Bubble Size | Parameter that defines the work attribute that sets the size of the bubbles. | Configured using the syntax:
See User Parameters - KPI Attributes for more info on report specific attributes. |
pp_bubble_size=my102_fm_forecast_cost |
| Pipeline X-Axis | Parameter that defines the work measure attribute that is used for the x-axis values. | Configured using the syntax:
|
pp_x_axis=ac_finish |
| Pipeline Grouping | Parameter that defines the work attribute that is used to group the x-axis | Configured using the syntax:
|
pp_x_group=wbs28_plan |
| Pipeline Y-Axis | Parameter that defines the work measure attribute that is used for the y-axis. | Configured using the syntax:
See User Parameters - KPI Attributes for more info on report specific attributes. |
pp_y_axis=my102_fm_forecast_net |
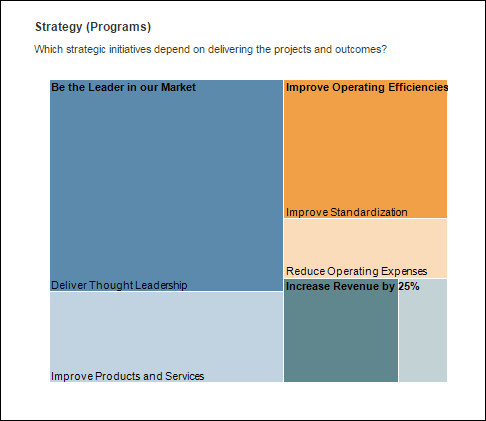
Strategy Treemap Visual |
|---|
| The Strategy breakdown treemap visual provides a quick way to drill in to sub categories of programs and subsequently filtering the rest of the report output based on this selection.
Clicking limits the rest of the analytics to the specific mission/objective/strategy and filters down projects to only those that deliver a specific initiative. |
| Parameter Configuration (Information for Planview Administrators) | |||
|---|---|---|---|
| Parameters | Description | Configuration Options | Default/Example Settings |
| Strategy Treemap Header | Parameter defines the heading text displayed at the top of the of the Strategy Treemap visual. | Configured using the syntax:
|
header_str=Strategy (Programs) |
| Strategy Chart Size: | Parameter that defines the attribute that’s used to determine the size in the tree map. | Configured using the syntax:
See User Parameters - KPI Attributes for more info on report specific attributes. |
strat_size=my102_fm_forecast_benefit |
| Strategy Chart Color: | Parameter that defines the attribute used for the color in the tree map. | Configured using the syntax:
See User Parameters - KPI Attributes for more info on report specific attributes. |
strat_color=my102_fm_forecast_cost |
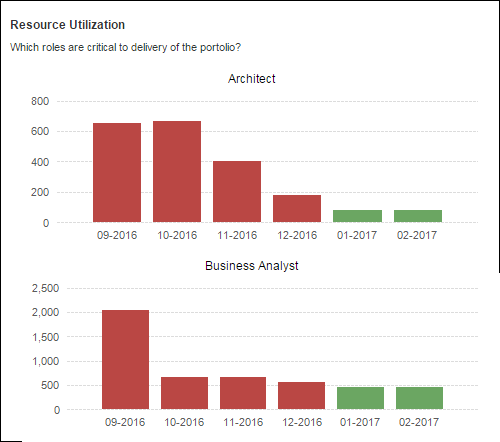
Resource Utilization Visual |
|---|
| This analytic can be used to quickly identifies key overloaded roles that are critical to the deleivery of the portfolio. Based on line attributes, this analytic highlights the roles that are most over capacity for the upcoming periods. This analytic highlights key roles and helps understand the impact of any over or under utilized resources.
|
| Parameter Configuration (Information for Planview Administrators) | |||
|---|---|---|---|
| Parameters | Description | Configuration Options | Default/Example Settings |
| Resource Utilization Visual Header | Parameter defines the heading text displayed at the top of the of the Resource Utilization visual. | Configured using the syntax:
|
header_util=Resource Utilization |
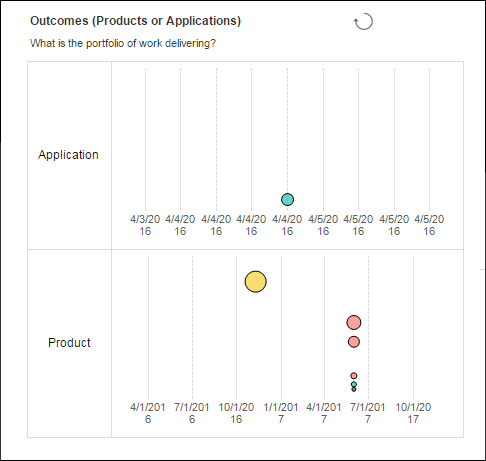
Outcomes Bubble Chart |
|---|
| This analytic shows a Product, Application or Service breakdown bubble chart, where the swimlanes and size, position and color of the bubbles allow for further dimensions of analysis. Each bubble is represents an outcome associated to the projects in Planview Enterprise.
|
| Parameter Configuration (Information for Planview Administrators) | |||
|---|---|---|---|
| Parameters | Description | Configuration Options | Default/Example Settings |
| Outcome Bubble Chart Header | Parameter that defines the heading text displayed at the top of the of the Strategy Treemap visual. | Configured using the syntax:
|
header_oc=Outcomes (Products or Applications) |
| Outcome Y-Axis: | Parameter that defines the measure attribute that is used for the y-axis of the bubble chart. | Configured using the syntax:
See User Parameters - KPI Attributes for more info on report specific attributes. |
oc_y_axis=my102_fm_forecast_net |
| Outcome Color Attribute: | Parameter that defines the attribute that sets the color of the bubble. | Configured using the syntax:
|
oc_bubble_color=pbs6_prod |
| Outcome Bubble Size: | Parameter that defines the attribute that sets the size of the bubble. | Configured using the syntax:
See User Parameters - KPI Attributes for more info on report specific attributes. |
oc_bubble_size=my102_fm_forecast_cost |