
RPM Dashboard MY102 - Portfolio Performance Detail

Overview |
|---|
| Connecting the demand pipeline to strategy, resources, projects and outcomes, the Portfolio Performance dashboard on My Planview gives portfolio managers an end-to-end view of their portfolios. Managers understand the impacts and relationships between project performance, outcome ROI, strategic financials and resource availability. They can answer questions such as:
|
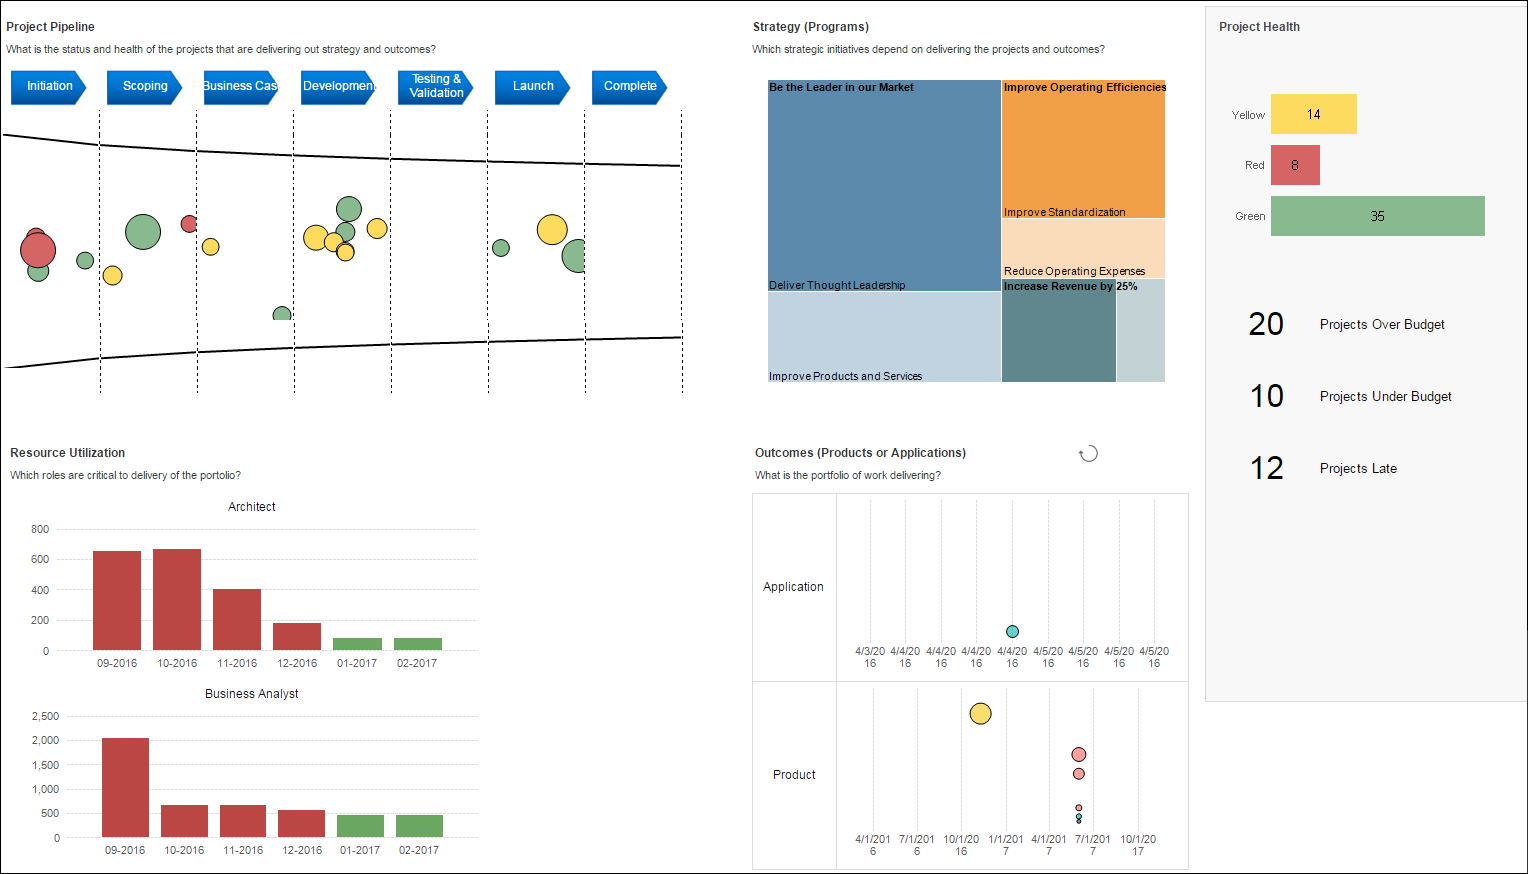
| Click on a section of the example screenshot to view detail |
| Business Outcomes | Supporting Capabilities |
|---|---|
|
|
Project Pipeline |
Back to Top ↑ |
|---|---|
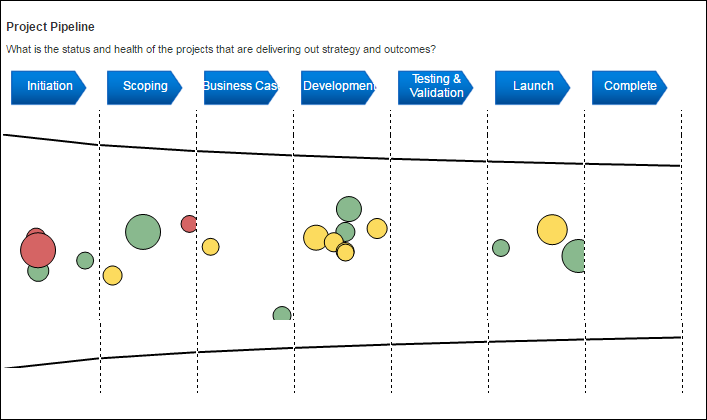
| The Project Pipeline chart shows a visualization of the pipeline demand of projects within the portfolio, broken down by lifecycle stage. Click on a stage or specific bubble to filter the report to show only things that are a part of that pipeline.
This information can be used to:
|
|
Strategy (Programs) |
Back to Top ↑ |
|---|---|
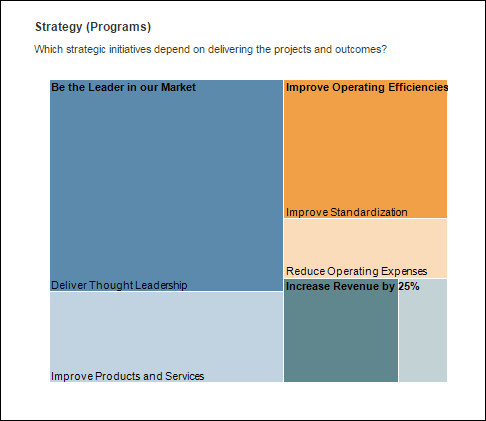
| The Strategy breakdown treemap visual provides a quick way to drill in to sub categories of programs and subsequently filtering the rest of the report output based on this selection.
Clicking limits the rest of the analytics to the specific mission/objective/strategy and filters down projects to only those that deliver a specific initiative. This also provides a way to see the breakdown of strategy while doing other analysis, and/or doing generalized analysis. |
|
Resource Utilization |
Back to Top ↑ |
|---|---|
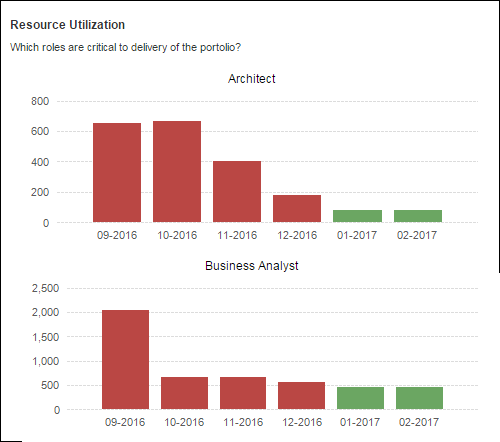
| This analytic can be used to quickly identifies key overloaded roles that are critical to the deleivery of the portfolio. Based on line attributes, this analytic highlights the roles that are most over capacity for the upcoming periods. This analytic highlights key roles and helps understand the impact of any over or under utilized resources.
|
|
| Analytic Detail | |
| Overcapacity compares the specific line attribute capacity (from the Cbs1 entities in the planning portfolio specified) to the demand of the projects. Red shows over utilized resources and green shows fully or under utilized resources. |
|
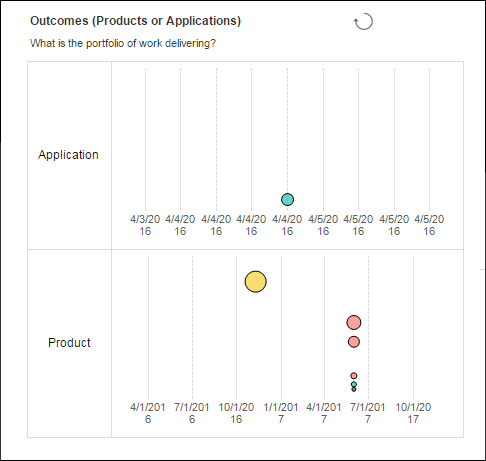
Outcomes |
Back to Top ↑ |
|---|---|
| This analytic shows a Product, Application or Service breakdown bubble chart, where the swimlanes and size, position and color of the bubbles allow for further dimensions of analysis. Each bubble is represents an outcome associated to the projects in Planview Enterprise. This Report can be used, for example, to identify an important product with low investment or a low impact application with lots of investment, providing sight of where money is being spent.
|
|
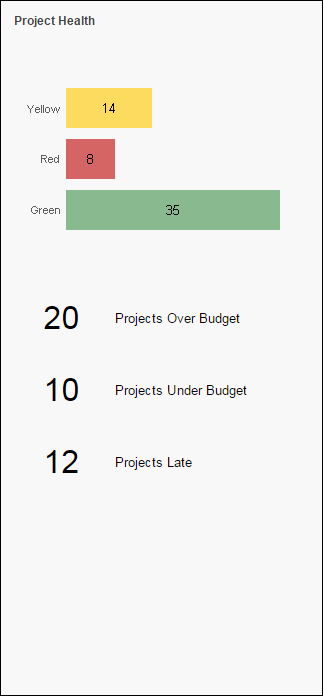
Project Health |
Back to Top ↑ |
|---|---|
| The project health visual provides quick analysis of key project identifiers and KPIs for the associated projects highlighting what’s at risk based on the execution realities.
|
|
Report User Parameters |
|
|---|---|
| The Report should execute with default User Parameters values configured by the administrator. To change a default value, select the 'Show Parameters' Click View Report to re-run the report with the new selection. |
|
| Parameters | Description |
| Aggregate Data By: | This parameter determines the period of time that financial and effort information will be broken down by in the report |
| Currency: | This parameter controls the display currency of the report. The selection will show only the defined system currencies. Defaults to users currency in Financial preferences It is only possible to change currencies in a multi-currency environment. |
| Effort Unit | Parameter is used to select the unit of measure used for effort Possible values are:
|
| Org Res Utilization: | The list of values will contain all organizational resources to select from. This is a multi-select parameter |
| Project Health Attribute | This parameter determines the attribute used in the bar chart at the top of the project health section (grey box on the far right of the report) |
| Financial Accounts to Include: | The list of values will contain all organizational resources to select from. This is a multi-select parameter |
| Forecast Version: Baseline Version |
Allows selection of two FM versions that are used for FM calculations. Defaults to marked and forecast and marked as baseline. Can be adjusted to compare to (for example) compare to a different baseline. |
| Strategy Chart Color: | Parameter that defines the attribute used for the color in the tree map. |
| Strategy Chart Size: | Parameter that defines the attribute that’s used to determine the size in the tree map. |
| Project Pipeline Bubble Color: | Parameter defines the work attribute that sets the color for the bubbles in the visual. |
| Pipeline Bubble Size | Parameter that defines the work attribute that sets the size of the bubbles. |
| Pipeline Y Axis: | Parameter that defines the work measure attribute that is used for the y-axis. |
| Pipeline X-Axis: | Parameter that defines the work measure attribute that is used for the x-axis values. |
| Pipeline Grouping: | Parameter that defines the work attribute that is used to group the x-axis. |
| KPI 1 Attribute: KPI 2 Attribute: KPI 3 Attribute: |
Parameters used to select the attribute used for the KPIs in the project health section (grey box on the far right of the report) The available attributes are:
|
| Outcomes Color Attribute: | Parameter that defines the attribute that sets the color of the bubble. |
| Outcomes Bubble Size: | Parameter that defines the attribute that sets the size of the bubble |
| Outcome Y-Axis | Parameter that defines the measure attribute that is used for the y-axis of the bubble chart. |